


Abstract
The early detection of metastatic cells can lead to better prognosis and higher survival rate. These cells have the capacity to travel through the circulatory system and invade other tissues. Often the symptoms for metastasis are not evident until cancer incapacitates a secondary organ. Hence, early detection is crucial. An imaging-based approach with a contour detection technique is presented here to distinguish metastatic breast cancer cells from benign cells when captured on anti-EGFR aptamer modified glass substrates. Metastatic (MDA-MDB-231) and non-metastatic (MCF-7) breast cancer cells were studied. The temporal tracking of cells showed that metastatic cells depicted prominent morphological changes, whereas the benign cells did not show such behavior. The metastatic cells showed rapid changes in their shapes by protruding/retracting cell membranes. The images of each type of cells captured on functionalized substrates were analyzed, and morphology changes were quantified with similarity and distance analysis. Low similarity coefficients and high distance values meant larger morphology changes. The metastatic cells showed lower similarity coefficients and higher distance metric values (average Hausdorff distance = 2.8 a.u.; average Mahalanobis distance = 0.7 a.u.) than non-metastatic cells (average Hausdorff distance = 1.5 a.u.; average Mahalanobis distance = 0.31 a.u.). These parameters were successfully used to detect 52% of metastatic cells from a cell mixture that imitated breast tissue. This approach can be used for detecting metastatic potential of a given sample towards precise therapy for a patient.
Export citation and abstract BibTeX RIS
1. Introduction
Detecting metastatic breast cancer at an early stage is of great importance for prescribing specific treatments to curtail the spread of the disease. Metastatic cancer can spread beyond the originating organ. For breast cancer, metastasis can reach bone, liver, lungs, and even brain. According to American Cancer Society, in 2016 among the new breast cancer cases 249 000 cases were diagnosed as metastatic, while only 61 000 were in situ. The death toll was 40 890 [1]. Only 6%–10% of reported breast cancer cases are diagnosed initially as metastatic [2], but eventually 20%–30% of all reported breast cancer cases become advanced or metastatic [3]. Breast cancer death rates among women are higher than those for any other cancer, besides lung cancer [1]. Early detection of metastatic breast cancer can dramatically improve the diagnosis and treatment, which in turn can reduce the possibility of occurrence of advanced cancer and improve life expectancy.
Computed x-ray tomography, magnetic resonance imaging, mammogram, and ultrasound scans are the current diagnostic tools to clinically detect metastasis. The ability of these tools hugely depends on the size and density of the tissue. Mammogram is less likely to find tumors in women younger than 50 years and less than one percent of standard mammograms can lead to cancer diagnosis [1]. Even though these tools can detect tumors in many patients, they are quite unreliable to detect metastasis as these cannot image metastatic cells traveling inside the body unless the cells form distant micrometastases. At that point, the disease is already at the last stage. Researchers are investigating new imaging tools like positron emission tomography (PET) to acquire molecular and physiological information [4, 5]. The FDA has approved PET imaging to specify the stage of breast cancer [6]. A group has reported macrophages targeting magnetic nanoparticles to detect millimeter-sized lymph node metastases in patients [7]. Another group has investigated radiolabeled monoclonal antibodies to target tumor-specific antigens such as HER2 and carcino-embryonic antigen to image cancer [8]. One of the negative sides of these techniques is that these require imaging agents or radiotracers which are often restricted if the patient is on another medication, has an illness, or medical conditions like pregnancy or allergies. Sometimes the slow clearance of tracers from the blood causes further complications. Hence, most of these are not FDA approved. As a result, if there is any confusion about a lump, a biopsy is prescribed. Biopsy is followed by histological examination of surgically removed breast tissue. Cancer stage is determined by the arrangement of cells, shape and size of cells, cell nucleus color when stained, histochemical staining of cancer cells, and immunohistochemical staining of cancer cells with antibodies. At the early stages of metastasis, the cancer cells are very few in the tissue, and histological examination after biopsy is again not very effective. About 10% of patients who have a mammogram require further testing. And less than 20% of those require a biopsy, and about 50% of those do not have cancer [1]. To effectively detect metastatic breast cancer, we report a simple post-biopsy imaging technique using aptamer-functionalized substrates. This is a label-free, single cell analysis approach where each and every cell can be examined for metastatic behavior. Examination of each and every cell provides high probability of detecting metastatic cells even though the number of these cells may be very small in the sample.
The most frequently overexpressed receptor tyrosine kinase oncogene is epidermal growth factor receptor (EGFR) which promotes cell migration, invasion, proliferation, adhesion, angiogenesis etc [9–13]. It is present on the cell membrane and is activated when it binds with growth factors. In healthy cells, EGFR expression levels vary from 40 000 to 100 000 proteins per cell [14]. The expression increases as the cells start to become cancerous. The constant activation of this upregulated receptor leads to uncontrolled cell division, which in time turns out to be cancer. Both wild type (WT) and mutated EGFR have been reported to be biomarkers for cancer. Overexpression of WT EGFR is reported to be found in lung cancer and glioblastoma cells, while a mutated variant EGFRvIII has also been reported to be present in gliocarcinoma [15]. In non-metastatic breast cancer cell line MCF-7, EGFR expression is 1.5 × 10⁴ receptors per cell, whereas in metastatic breast cancer cell line MDA-MDB-231, the expression increases to 1.3 ×10⁵ receptors per cell [16].
In this work, the capture and detection of metastatic breast cancer cells MDA-MDB-231 is reported based on their unique morphological characteristic on anti-EGFR aptamer-immobilized glass substrates. Metastatic breast cancer cells changed their morphology with time when captured on anti-EGFR aptamer-functionalized glass substrates. Non-metastatic MCF-7 cells captured on aptamer-modified substrates did not show this behavior. Based on this distinguishable trait of metastatic and non-metastatic cells on functionalized glass substrates, we established a detection technique. We used distance matrix analysis to compute shape change of cells from the optical images. This was tested on a cell mixture of metastatic and non-metastatic cells mimicking a biopsy sample. In biopsy, we extract different types of cells including metastatic ones. It is hard to detect metastatic cells from non-metastatic cells using current technologies. The technique presented here can successfully detect metastatic cells from a mixture based on their morphological alterations on aptamer-grafted substrates.
We have reported efficient capture of human glioblastoma cells and their distinction from astrocytes on aptamer grafted substrates previously [17, 18]. Cell capture technique is very popular for its selectivity, and the efficiency of our reported technique for glioblastoma cell capture was higher than astrocytes. But in the captured cell population, distinction of cells was not possible. We later showed that there was morphological non-uniformity between glioblastoma and astrocyte cells on aptamer modified substrates [18]. Here, we show a precise distance matrix based cell shape analysis to differentiate between metastatic and non-metastatic breast cancer cells on aptamer-modified substrates.
2. Materials and methods
All chemicals used in the experiments were obtained from Sigma-Aldrich (St. Louis, Missouri, USA), unless mentioned otherwise.
2.1. Substrate preparation
Fisher brand microscope slides were used as substrates. The glass slides were cut into 5 mm × 5 mm pieces and cleaned with Piranha solution (H2SO4:H2O2::3:1) for 10 min to remove any contaminant and create –OH groups. The substrates were subsequently washed with deionized (DI) water and dried in N2 flow. To remove any moisture, a baking step at 195 °C for 10 min was done. To create amine groups on the surface, the substrates were immersed in 200 μl of 2% (3-Aminopropyl)triethoxysilane (APTES) for 30 min. After thorough rinses with isopropyl alcohol (IPA) and DI water, the substrates were dehydrated again at 150 °C for 30 min. A solution of 9 ml dimethyl sulfoxide (DMSO), 1 ml pyridine and 0.002 gm p-Phenylene diisothiocyanate (PDITC) was prepared to immerse the substrates for 5 h at 45 °C. After more washing with IPA and diethylpyrocarbonate (DEPC)-treated water, unreacted PDITC end groups were capped to prevent any nonspecific adsorption. To do that, the substrates were immersed in 150 mmol l−1 N,N-Diisopropylethylamine (DIPEA) in dimethylformamide (DMF) and 50 mmol/l 6-amino-1-hexanol for 5 h. PDITC created a diisothiocyanate layer on the substrates, one end of which attached to the glass substrate-tethered APTES and the other end could bind to amine-bearing capture molecules. We used amine-modified DNA as capture molecules. The amine-modified capture DNA had the sequence: 5'-amine-CTGGTCATGGCGGGCATTTAATTC-3' and was diluted with DMSO [17]. Each of the glass substrates was loaded with 20 μl of 5 μM capture DNA, and was incubated for 18 h at 45 °C in a humid chamber. This capture DNA would later bind with the aptamers. The aptamers would then bind to tumor cells.
2.2. Aptamer preparation and substrate functionalization
The sequence for anti-EGFR aptamer was: 5'-GGC GCU CCG ACC UUA GUC UCU GUG CCG CUA UAA UGC ACG GAU UUA AUC GCC GUA GAA AAG CAU GUC AAA GCC GGA ACC GUG UAG CAC AGC AGA GAA UUA AAU GCC CGC CAU GAC CAG-3' [17]. The underlined part is the complementary chain which could bind with the capture DNA. As a negative control, to show lack of non-specific binding, a mutant aptamer sequence was used (5'-GGC GCU CCG ACC UUA GUC UCU GUU CCC ACA UCA UGC ACA AGG ACA AUU CUG UGC AUC CAA GGA GGA GUU CUC GGA ACC GUG UAG CAC AGC AGA GAA UUA AAU GCC CGC CAU GAC CAG-3') [17]. The anti-EGFR and mutant aptamers were diluted with DEPC-treated water and mixed with hybridization buffer (5:1::RNA:hybridization buffer). After 18 h incubation, the DNA incubated substrates were washed with IPA and DEPC water. A volume of 25 μl aptamer was placed on each substrate. Half the substrates were incubated with anti-EGFR aptamer, while the other half were incubated with mutant aptamer. All the substrates were incubated at 37 °C for 1 h in an incubation chamber. The chamber was previously washed with RNase-free and DEPC treated DI water. After incubation, substrates were washed with 1× phosphate buffered saline (PBS) solution (at pH 7.5) and used immediately.
2.3. Target cells
Two types of breast cancer cells were used. The metastatic cell line was MDA-MDB-231 and the non-metastatic cell line was MCF-7. They were obtained from the University of Texas Southwestern Medical Center (Dallas, TX). The cells were cultured in Dulbecco's modified Eagle's medium (DMEM/F-12; Cellgro, Corning, Manassas, Virginia, USA) with 10% heat-inactivated fetal bovine serum. L-glutamine (Invitrogen, Carlsbad, California, USA) and Gentamycin were also added to the medium. A sterile humidified culture environment was maintained with 95% air and 5% CO2 at 37 °C. In all experiments, the cells were first centrifuged to remove supernatants and then diluted with sterilized and warm 1× PBS solution. The prepared cells were immediately used.
2.4. Cell mixture preparation
Two sets of experiments were conducted with metastatic and non-metastatic cells. In the first set of experiments, both types of cells were captured on anti-EGFR aptamer and mutant aptamer modified substrates separately. Cells were observed, and images were taken. The distinctive morphological characteristics of metastatic and non-metastatic cells were established and quantified from this experiment.
In the second set of experiments, mixtures of metastatic and non-metastatic cells were used. The metastatic cells were tagged with 5-chloromethylfluorescein diacetate (CMFDA; Thermo Fisher Scientific, Carlsbad, California, USA). This fluorescent dye was used for tracking cell motility. The emission spectra were 492/517 nm. The CMFDA (0.2 μl) was mixed in 1 ml of the medium. The tagged metastatic and untagged non-metastatic cells were mixed in 1:1 ratio. The purpose of this experiment was to track morphology changes of the cells temporally, and detect metastatic cells from the mixture based on previously established quantitative metrics.
2.5. Cell suspension and image capture
In the first set of experiments, the prepared cells were suspended in 1× PBS solution. These were then loaded on the 5 mm × 5 mm functionalized glass substrates. Typically, a volume of 30 μl cell suspension was used to cover each substrate. The concentration of non-metastatic cell suspension was 200 000 cells ml−1, while that for metastatic cell suspension was 100 000 cells ml−1. Usually, 3 or 4 min were given to let the cells settle down on the functionalized substrates. After settling down, the average concentration of cells on functionalized glass substrates was ∼240 cells per mm2 for non-metastatic cells and ∼120 cells per mm2 for metastatic cells. To inspect cell attachment on the substrates and their behavior over the time, an optical microscope was used. Three samples from each of the four groups of cell-aptamer pairs were analyzed: metastatic cells captured on anti-EGFR aptamer-functionalized substrates, metastatic cells captured on mutant aptamer-functionalized substrates, non-metastatic cells captured on anti-EGFR aptamer functionalized substrates, and non-metastatic cells captured on mutant aptamer-functionalized substrates. The cells on all 12 substrates were imaged. Over the period of 30 min, images were taken 30 s apart using a Leica DM series optical microscope with DFC295 camera at 20× magnification.
In the second set of experiments, CMFDA tagged metastatic and untagged non-metastatic cell pellets were suspended in 1× PBS solution at 1:1 ratio. The anti-EGFR aptamer-modified substrates were covered with this cell suspension. The cells were then imaged with Zeiss fluorescence microscope (Axioplan 2 LSM) with AxioCamMR3 camera.
2.6. Image analysis
The captured images were analyzed with custom written code in MATLAB. From the images, each cell was cropped and arranged sequentially with respect to time. A batch of images was generated for each cell showing its shape change with time. These images were in RGB format. They were processed using edge detector code which generated batches of binary images. All the binary images were processed in a way that the center of the cell was always at the same position. This precaution was taken due to the fact that, some cells moved a little over time while still attached to the surface. Each of these batches of binary images was processed using custom software to quantify their shape change.
2.7. Computational methods
2.7.1. Cell contour detection
The computational approach for cellular edge detection was based on level set algorithm. The RGB images were processed with Wiener filter for noise removal. Wiener filter is a low-pass filter which removes noise by adapting to pixel wise statistical estimation of the local neighborhood. The Wiener filter had neighborhoods of size 4 × 4 pixels to estimate the local mean and standard deviation. Gaussian white noise was assumed to be the noise parameter. The adaptive nature of Wiener filter worked better than linear filters due to its capability to preserve edges. The images were further smoothed by Gaussian filter. The Gaussian filter had the size of 25 × 25 pixels with positive standard deviation of 1.5. The edge of a cell was the place of rapid change in the intensity profile of the image. Therefore, the cellular edge corresponded to the extremas of the derivatives of image intensity. Gradients of the images were calculated which indicated the places with most rapid intensity change i.e. the cellular edge. The gradient function of MATLAB 2013 was used to calculate the 2D numerical gradient of image metric. The strength of the edge was calculated by the magnitude of the gradient. From this magnitude, an edge indicator function was calculated using the following formula:
Level set methods are used for the implementation of interface evolution under various forces. It is a dynamic process which tracks the motion of an interface [19]. The interface is called zero level set, and in our case, it was the image boundary. When the image boundary (zero level set) started to move inwards and towards the cellular edge, we got an initial value for the partial differential equation. The evolution forces caused the movement of the interface. The partial differential equation with evolution forces is:
where  is external vector
  based normal force on interface f. The right-hand side (
 ) is curvature value
  based force on the interface f.
In solving this equation, Neumann boundary condition was used. Neumann boundary consisted of the derivatives of the image intensity. The curvature-based force curved the interface, when the vector-based force pulled the interface towards the cell boundary. The edge indicator function stopped the interface around cell boundary. Therefore, the tracked boundary from the evolution forces was compared with the edge indicator function over and over until matched. In this way, we segmented the cells from non-cell background by detecting the cell contour.
2.7.2. Shape similarity calculations
The segmented cells were converted to binary, where the cell body was black and the background was white. To quantify the cell shape change, we employed a shape similarity matching technique. The cells were tracked over time with an optical microscope, and images were taken for 30 min. These images were converted to binary formats by contour detection. The binary data was matched from image to image. The binary data had a '1' value where cell body was present and a '0' value meant absence of cell body. A 2 × 2 contingency table was generated for each pixel to match two consecutive images. The four conditions that dictated the table were: presence of cell body in both images, 'a'; presence of cell body in first image and absence in second image, 'b'; absence of cell body in first image and presence in second image, 'c'; and absence of cell body in both images, 'd'. For a pixel, only 1 of the 4 conditions had to be true. A value of '1' was assigned for the true condition and '0' for false. A similarity coefficient, Sokal–Sneath coefficient [20], was calculated from this table. The mathematical formula is:
Mutually absent attribute or 'd' was not necessary for similarity calculation, according to Sokal–Sneath [20]. When two binary shapes were similar, 'a' was very large; as well as the similarity coefficients. If a cell did not change shape significantly, it remained similar to its previous form, and would generate a high similarity coefficient. Continuous morphological change of a cell thus depicted lower values of Sokal–Sneath coefficients.
2.7.3. Distance matrix calculation
Distance metric analysis is a rigorous method for comparing cell shape. It is a statistical method of pattern recognition, where each pattern is described in terms of features. In our case, we calculated two features: Hausdorff distance and Mahalanobis distance. Features were computed in a way that for different patterns there were non-overlapping feature spaces. We calculated and established Hausdorff distance profile and Mahalanobis distance profile for metastatic and non-metastatic cells. These distance profiles clustered in clearly recognizable manners to distinguish metastatic and non-metastatic cells based on a decision boundary.
The first distance matrix, the Hausdorff distance, calculated the resemblance between cell contours in two consecutive images [21]. If A and B are the sets of points on the cell contour in two consecutive images, the distance is:

where, 
The Hausdorff distance minimizes positional errors with nominal and fast calculations. The distance between two closed sets is zero, if and only if both sets are identical. That means, if the cells are not showing any morphological changes, the Hausdorff distance will be ideally zero or practically a small number. If a cell is changing shape, distance will be a large number.
Another distance matrix, the Mahalanobis distance, measured the numbers of standard deviations the cell periphery was away from mean cell boundary [22]. It is calculated from the formula:
where, D = Mahalanobis distance, m = vector of mean values from initial cell boundary, x = vector of changing cell boundary, C−1 = inverse covariance matrix of initial cell boundary, and T = transpose vector.
The points on a cell boundary were taken as vectors which were members of a 2D space representative of an image. When calculating Mahalanobis distance between two consecutive shapes, the earlier shape was assumed to be 2D Gaussian distribution and the later shape had the changing cell boundary with these 2D vectors. The Gaussian distribution would resemble an ellipsoid centered at its mean; just like a cell with an ellipsoid shape with a center of mass. When the cell was changing shape, some vectors on the cell boundary were moving. Mahalanobis distance gave us the 'extremeness' of those vectors with respect to the Gaussian shaped initial cell body. The 'extremeness' was the distance value indicating the shape change between two consecutive images.
3. Results and discussion
3.1. Dynamic tracking of morphological characteristics of cells
The metastatic and non-metastatic cells were captured separately on anti-EGFR aptamer and mutant aptamer-modified substrates. The captured cells were tracked for 30 min. Over this time, the metastatic cells changed their shapes on anti-EGFR aptamer-modified substrates by creating protrusions form cell membrane. The non-metastatic cells captured on anti-EGFR aptamer-functionalized substrates did not show such changes in shapes. Both types of cells captured on mutant aptamer-functionalized substrates did not show any morphological changes. It was unique for metastatic breast cancer cells captured with anti-EGFR aptamer to show distinctive morphological behaviors. This feature was used to identify metastatic breast cancer cells from non-metastatic ones.
Metastatic and non-metastatic cells captured with mutant aptamer showed the same behavior (no shape change) as non-metastatic cells captured with anti-EGFR aptamer. For simplicity in presentation, results from cell morphology on mutant aptamer-functionalized glass substrates are not shown in the data analysis. Results for non-metastatic cells captured with anti-EGFR aptamer are good representations of metastatic and non-metastatic cells captured on mutant aptamer-functionalized glass substrates.
The temporal optical micrographs in figure 1 show the morphological changes of cells over time. The metastatic breast cancer cells showed morphological changes when captured with anti-EGFR aptamer (figure 1(a)). Micrographs of six representative metastatic cells are shown. Non-metastatic cells captured on anti-EGFR aptamer or mutant aptamer substrates, and metastatic cells captured on mutant aptamer substrates did not show such behavior (figure 1(b)).

Figure 1. (a) Metastatic cells captured with anti-EGFR aptamer. Micrographs of five different cells after (I) 2 min, (II) 9 min, and (III) 17 min of capture. Each cell shows change in contour over time; (b) (A) non-metastatic cells captured on anti-EGFR aptamer substrate, (B) non-metastatic cells on mutant aptamer substrate, (C) a metastatic cell captured on mutant aptamer substrate. Micrographs taken after (I) 2 min, (II) 9 min, and (III) 17 min of capture. Non-metastatic cells do not show any morphological change over time.
Download figure:
Standard image High-resolution imageThe morphological changes of metastatic cells on anti-EGFR aptamer-modified substrates can be explained by the expression of EGFR on cell membrane. Metastatic breast cancer cells have 10 times more EGFR than their non-metastatic counterparts [16]. EGFR detects specific signals for cell movement, proliferation and migration [23, 24]. Metastatic breast cancer cells, having higher density of EGFR, created more receptor-aptamer bonds than non-metastatic cells. In these cells, more activated EGFRs generated cascades of intracellular signals. It is known that intracellular signaling stimulated by EGFR results in continuous restructuring of actin filaments [25]. Overexpression of EGFR thus triggered dynamic rearrangement of cytoskeleton structure of metastatic cells on anti-EGFR aptamer-functionalized substrates.
3.2. Shape similarity matching
In figure 2(a), average Sokal–Sneath coefficient values are plotted for metastatic and non-metastatic cells with respect to time. It is a similarity coefficient, and lower value of the coefficients means cell shape is changing prominently with time. Average coefficient value for non-metastatic cells was more than 0.9 a.u. during the 30 min period, confirming a high similarity. For metastatic cells, the average coefficient value was much lower for the first 10 min. Later, it increased but still stayed below 0.9 a.u. The propensity of changing morphology for metastatic cells was observed to gradually decrease with time. It can be inferred that after around 20 min, the cytoskeleton rearrangement of metastatic cells was finally stable. In figure 2(b), the comparison is shown for two time points. The non-metastatic cells have same average coefficient values (∼0.9 a.u.) at 4 and 28 min. The average coefficient values for metastatic cells, on the other hand, changed from 0.77 to 0.84 a.u. for these two time points. The average coefficient values for metastatic cells are significantly different than those for the non-metastatic cells at both time points (*p-value < 0.01). For better diagnostics, the contrast between metastatic and non-metastatic cells is preferable to be strong. The early coefficient values are thus better for error-free diagnosis.
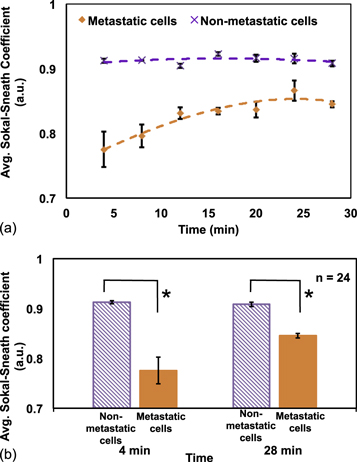
Figure 2. (a) Average Sokal–Sneath coefficient values for metastatic and nonmetastatic cells over 30 min. The trend shows metastatic cells have lower coefficient value, which means cell shape is changing vigorously. Non-metastatic cells are uniformly showing higher similarity with coefficient values closer to 1, where 1 means exactly same shape. (b) Comparison between Sokal–Sneath coefficient values for metastatic and non-metastatic cells at two time points (*p-value < 0.01).
Download figure:
Standard image High-resolution imageLower similarity is clear depiction of more change in the morphology of metastatic cells on anti-EGFR aptamer-functionalized substrates. This confirmed the fact that the cytoskeleton structure of these cells was more flexible than non-invasive cancer cells [26–28]. The actin filaments of the cytoskeleton have been reported to be very agile in metastatic cells [29, 30].
Over the imaging period, it was observed that the cells did spread out on the substrates. Hence, their size changed in the 2D images. For coefficient analysis, where we took every pixel change into account, this phenomenon had an undesirable influence. This decreased the sensitivity of this metric. We calculated distance matrices to avoid this problem. Distance matrix analysis was done only on cell contours. Though cell contours also changed due to spreading out, the change was subtler than the cell area change. Although coefficient analysis was burdened with cell spreading phenomenon, it still presented a quick and simpler measure to quantify dynamic morphology of metastatic cells.
3.3. Distance metric analysis for cell shape comparison
3.3.1. Hausdorff distance profile for metastatic and non-metastatic cells
In figure 3(a), the average Hausdorff distance for metastatic and non-metastatic cells are shown with time. Higher Hausdorff distance means higher cell shape change. The non-metastatic cells showed a less and uniform distance over 30 min. Due to constant morphological changes of metastatic cells, their distance values were higher. From this analysis, it was again evident that the shape changing tendency of metastatic cells subsided after around 20 min. When activated EGFR on cell membrane triggered intracellular signaling pathways, actin-modifying proteins were released from the cell membrane, which reorganized actin cytoskeleton [31]. Filopodia/lamellipodia extension and retraction from cell membrane was controlled by actin cytoskeleton. Presence or absence of suitable binding sites on the substrates stabilized the extension or retraction of filopodia/lamillipodia [32, 33]. Stable binding between surface-bound anti-EGFR aptamer and cell membrane EGFR ultimately suppressed cell morphological change after 20 min. The total distance value after 30 min consisted of the high-contrast early values and low-contrast late values. We could only take the high-contrast early values for discrimination, but from our results, we concluded that inclusion of the low-contrast late values augmented the metric, and enhanced the difference between metastatic and non-metastatic cells. Average Hausdorff distance after 30 min is plotted for both types of cells in figure 3(b). The average was 1.5 a.u. (SD = 0.4 a.u.) for non-metastatic cells and 2.8 a.u. (SD = 0.7 a.u.) for metastatic cells. Two-tailed t-test confirmed that the averages were statistically significant (p-value < 0.05).
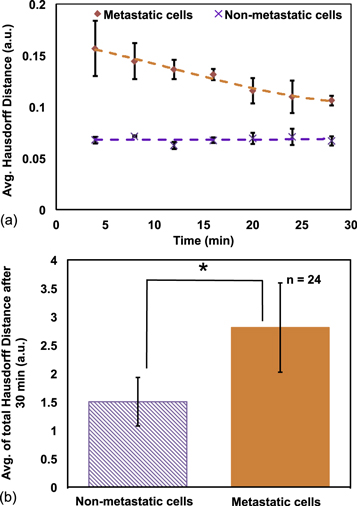
Figure 3. (a) Average Hausdorff distance of metastatic and non-metastatic cells with respect to time; (b) average of total Hausdorff distance of both type of cells after 30 min. Two-tailed t-test showed *p-value < 0.05.
Download figure:
Standard image High-resolution imageMetastatic cells have the unique ability to move into tissues surrounding the primary cancer sites. This aberrant behavior is caused by genetic mutations. One such mutation happens in the EGFR family of genes [34]. Genetic alteration of EGFR gene is reported to result in upregulation of EGFR on cell membrane of metastatic cells [35]. We employed this fact to capture metastatic cells with anti-EGFR aptamers. Upregulated growth factor driven signaling boosted cell motility in metastatic cells.
3.3.2. Mahalanobis distance profile for metastatic and non-metastatic cells
Larger Mahalanobis distance value means larger change in the cell boundary. In figure 4(a), this distance is plotted with respect to time. The metastatic cells showed higher dissimilarity than non-metastatic ones. The non-metastatic cells showed a more uniform trend than metastatic cells. Average Mahalanobis distance after 30 min is shown in figure 4(b). The averages are 0.7 a.u. (SD = 0.27 a.u.) and 0.31 a.u. (SD = 0.08 a.u.) for metastatic and non-metastatic cells, respectively. Two-tailed t-test showed that the distance values for metastatic cells were significantly different from that of non-metastatic cells (p-value < 0.05).
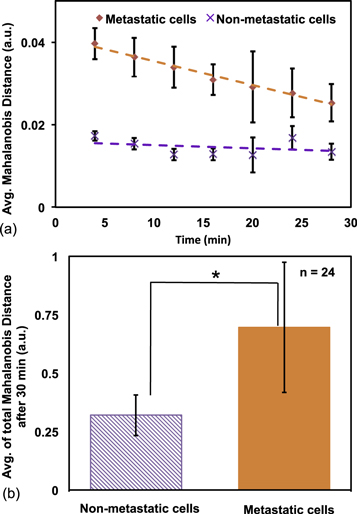
Figure 4. (a) Average Mahalanobis distance for metastatic and non-metastatic cells over 30 min; (b) average of total Mahalanobis distance of both type of cells after 30 min. Two-tailed t-test showed *p-value < 0.05.
Download figure:
Standard image High-resolution imageHausdorff distance analysis is very precise and includes very small positional change of cell contour in calculations. Cells are alive entities, and it is usual for any cell to show small shape change over time. As a result, Hausdorff distance analysis is sometimes overloaded, and the detection contrast between metastatic and non-metastatic cells decreases. On the other hand, Mahalanobis distance analysis is based on mean boundary of cell, and its covariance matrix with new boundary. Hence, Mahalanobis distance sometimes misses subtle change in shape that is expected to be taken into account and over-amplifies the contrast between metastatic and non-metastatic cells. We combined these two features to counterbalance the imprecise calculations and came up with combined distance profiles for metastatic and non-metastatic cells.
We observed that similarity coefficients took cell area into account. Even a very small change of cell shape was amplified in the calculated similarity coefficients and produced huge variability in average values. Whereas, distance matrices circumvented the cell spreading effect to some extent. Both type of calculations can thus give us insights into the cell activity over time.
3.4. Detection of cells from cell mixture based on distance profile
From distance matrix analysis, we could successfully differentiate metastatic cells from non-metastatic ones from their morphological behavior on anti-EGFR aptamer-modified substrates. For the purpose of clinical applications to detect metastatic cells, we demonstrated our technique on a cell mixture. Metastatic and non-metastatic cells were mixed in 1:1 ratio. The anti-EGFR aptamer-modified substrates were incubated with the cell mixture and imaged for 30 min. Metastatic cells, tagged with CMFDA, were confirmed by fluorescence imaging. Figures 5(a), (b) show the cell images from a mixture, taken with optical and fluorescence microscopes.

Figure 5. (a) Optical and (b) fluorescent micrographs of metastatic and non-metastatic cell mixture at 1:1 ratio. Metastatic cells were tagged with CMFDA. Fluorescence imaging was used to verify the identity of cells. Both images are for the same spot.
Download figure:
Standard image High-resolution imageCell images on anti-EGFR aptamer-functionalized substrates were converted into binary format and distance matrix data were accumulated. In figure 6(a), the captured cells from the mixture are plotted with respect to their Hausdorff and Mahalanobis distances. We took these two parameters because both are distances, and their combination gave flexibility and precision in the analysis. A 2D distance profile is simple, sensitive and more robust as advantage of one parameter balances the disadvantage of the other. For metastatic cells, figure 3(b) showed the average Hausdorff distance of 2.8 a.u. (SD = 0.7 a.u.), and figure 4(b) showed the average Mahalanobis distance of 0.7 a.u. (SD = 0.27 a.u.). Combining these features, we hypothesized that we can expect metastatic cell population around and beyond these values. In figure 6(a), we established regions where we expected metastatic and non-metastatic cells to be present. We did find some cells inside the metastatic region. We overlaid the fluorescent images on the optical images to confirm cell types. Figure 6(b) shows results from the fluorescent (b). These are and in our established metastatic region all cells were metastatic (inside red dotted circle). We could thus successfully detect 52% metastatic cells from the mixture. Two more experimental results are included in the supplementary material figures S1(a), (b). These are available online at stacks.iop.org/BPEX/4/025038/mmedia. Cell profile for Sokal–Sneath coefficient is also included in the supplementary material figure S2. Using cell profile for three features: Hausdorff distance, Mahalanobis distance, and Sokal–Sneath coefficient, cell detection from cell mixture is summarized in supplementary material figure S3. The 3D plots with 3 metrics are shown in supplementary material figure S4. The combination of 3 metrics is more powerful yet complex than individual metrics. We expect even more complex data from real patient samples. The three metrics reflect three aspects (cell body rotation, coarse change of contour, and fine change of contour) of cell shape change. Sokal–Sneath coefficient considers cell body, Hausdorff distance calculates precise contour change and Mahalanobis distance measures coarse contour change. Calculations based on cell body were more accurate when cells rotated on the surface. But, cell contour based analysis eliminated the error derived from cell spreading on the surface. Hausdorff distance was very sensitive but the problem was overcalculation of subtle movements. Mahalanobis distance resolved the problem of overfitting, but it was a coarse measurement. Only one metric, however powerful on small dataset, will need supporting metrics to overcome its shortcomings when applied to larger and real datasets. Combined together, the three features are more effective for metastatic cell detection in these scenarios.

Figure 6. (a) Cells from metastatic and non-metastatic cell mixture captured on aptamer-modified substrate are plotted according to their distance profile. Metastatic and non-metastatic cell regions are established based on previous distance metrics analysis. (b) Metastatic and non-metastatic cells are plotted from fluorescent image. The red dotted line is previously established metastatic cell region containing 52% of the metastatic cells from the cell mixture.
Download figure:
Standard image High-resolution image
Cell motility on anti-EGFR aptamer modified substrates can be a novel biomarker for detection of metastatic cells from other cells. Non-metastatic cells closely resemble metastatic cells in size and shape. In biopsy samples, where both invasive and benign cancer cells are present, it is very important but difficult to differentiate between these two. Our results suggest that implementation of shape similarity analysis method with anti-EGFR aptamer functionalized capture substrates can bring about exciting new strategies for detecting metastatic breast cancer cells in a breast tissue environment. The techniques also eliminate the inadequacies of single cell analysis that exist in current clinical imaging systems. Cell staining often impedes normal cellular function, which can be unfavorable for cancer cell identification. Our technique is label-free and extremely selective.
4. Conclusions
Metastatic breast cancer detection at early stages is very important to reduce mortality and to improve quality of life. It is vital to detect metastatic cells before they spread to other organs. We have presented a simple but elegant way of discriminating between metastatic and non-metastatic breast cancer cells. Based on their well-defined characteristics, our shape matching techniques differentiated and detected metastatic cells from cell mixtures that mimicked composition of breast cancer tissue. Our work is based on 'immobilization' of anti-EGFR aptamers on substrates for capturing cancer cells [17]. Capture and release of cancer cells is necessary for further proteomic and genomic analysis. The captured cells can be later collected by washing off from the surface for these studies. It is difficult to maximize isolation of metastatic cancer cells based on EGFR expression as the expression is just 10 fold from non-metastatic to metastatic cells. Our work has introduced a 'detection stage' in between the 'capture' and 'release' stage to confirm identification of metastatic cells and maximize their collection.
From our current and previous work [17] and other studies on cell motility due to EGFR binding [31–33], we confirmed that the cause of the reported behavior of metastatic cells is high EGFR expression. We can infer that for other cell lines this should also hold true. But the sensitivity of the detection will certainly depend on the absolute expression of EGFR, and the effectiveness of the calculated metric. We also expect that the metastatic cancer cells from real patient samples will show same behavior, as it is based on EGFR overexpression. This capture procedure and morphological feature calculation can be used as a simple platform to develop a cost-effective and efficient point of care device to detect metastatic breast cancer at early stages.
Acknowledgments
We would like to thank Dr Andrew D Ellington of University of Texas at Austin for providing the anti-EGFR aptamer, Dr Mohammed Arif I Mahmood for technical help, Dr Loan Bui for assistance in cell handling. We also acknowledge Dr Nader Hozhabri and his staff at Nanotechnology Research Center for the equipment trainings. This work was supported by the US National Science Foundation, Division of Electrical, Communications and Cyber System (Grant Number ECCS-1407990).