


Abstract
This work aims at clinically evaluating the performance of a novel transmission detector (TD). The evaluation was done using a comprehensive, structure-specific, patient pre-treatment 3D QA protocol. A total of 19 IMRT and SBRT patient treatment deliveries were measured twice on an Elekta Agility linear accelerator, once with the TD and once with the MatriXX detector for comparison. According to the QA protocol statistical parameters, the results showed good agreement between any pair of the following three doses, treatment planning system computed dose, TD measurement reconstructed dose and MatriXX detector measurement reconstructed dose.
Export citation and abstract BibTeX RIS
1. Introduction
The current work introduces the reader to the potential implementation of the novel radiation transmission detector (TD) for pre-treatment patient QA. The commercial name of the device is dolphin TD. The device is manufactured by IBA (IBA Dosimetry, Bahnhofstrasse 5, 90592, Schwarzenbruck, Germany). Previous work has been done with the TD, but using a prototype device and for technical rather than clinical evaluation. Asuni et al [1] investigated the spatial resolution of the TD and validated TD measurements with Monte Carlo (MC) simulation using BEAMnrc and DOSXYZnrc (National Research Council Canada, Ottawa, Canada). The same author in a different work used MC techniques to characterize treatment beam parameters in the presence of the TD [2]. They were particularly interested in electron contamination when the TD was used. For the dynamic IMRT plan, MC computed dose was compared to that reconstructed using a TD measurement. Venkataraman et al [3] investigated the influence of the TD on 6MV x-ray beams, concluding that the device presence increased the relative dose in the buildup region, but had a negligible effect on the beam parameters beyond dmax. Cheung et al [4] investigated the effect of the TD on 6MV, 6FFF, 10MV, and 10FFF beams, concluding that the effect is minimal. McCurdy et al [5] compared the TD to a dosimetry method utilizing a solid water phantom and radiochromic films. They concluded that results from both methods were comparable. Nakaguchi et al [6] evaluated the accuracy of reconstructed dose distributions from the IBA COMPASS system using specific MLC test patterns and complicated IMRT head and neck (HN) plans. The COMPASS reconstructed dose distributions were compared with results from measurements with EPID, MapCHECK (Sun Nuclear Corporation, 3275 Suntree Blvd, Melbourne, FL 32940, USA), EDR2 film and dose distributions calculated with MC code. They concluded the COMPASS system could be routinely used for QA in the clinic with the same accuracy as the MapCHECK diode detector. Bogulla et al [7] successfully evaluated the performance of the COMPASS system for both off-line and online procedures for verification of prostate IMRT treatment plans, using respectively MatriXX and TDs (with a trade name Dolphin detector). They used an early prototype for their proof of concept. Thoelking et al [8] concluded that 2D and 3D evaluations of IMRT and VMAT plans investigated showed excellent agreement with reference measurements and dose computations, and the TD is a device suitable for routine patient plan verification. Zhen et al [9] explored the usefulness of gamma evaluation for patient pre-treatment QA, as well as validated a novel patient-dose DVH-based method and its accuracy and correlation. The authors introduced 4 types of errors on 24 clinical HN patient treatment plans. They concluded that gamma passing rate, as a QA tool, was not sufficient in detecting the specific errors introduced. Those were successfully detected when DVH-based QA method was employed.
The existing research invites further clinical exploration. This work aims at evaluating the clinical performance of the TD in comparison to that of another detector already implemented in our clinic—IBA's MatriXX. The evaluation was done with a pre-treatment structure-specific 3D QA protocol that both evaluates the treatment planning system (TPS) predicted and measurement reconstructed dose difference using 3 statistical parameters, and also performs DVH analysis. Two sets of statistical parameters were used (table 1), our clinical parameters (row A), and a stricter set for investigation (row B). If the QA pass thresholds were met for all structures of interest the treatment would be approved, otherwise the areas of failure would be manually reviewed by a physicist.
Table 1. 3D pre-treatment structure specific QA protocol implemented in our clinic. Both current (A) and more restrictive acceptance criteria (B) that are applied to any structure of interest are listed.
| 3D statistical parameter | |||
|---|---|---|---|
| Absolute average dose difference (AADD) | Absolute dose difference greater than (ADD) | 3D gamma analysis | |
| A | |||
| ADD6% | |||
| For QA to pass: 6% is the maximum allowed TPS computed and COMPASS measurement reconstructed average dose difference | For QA to pass: maximum of 4% structure volume may have TPS computed and COMPASS measurement reconstructed absolute dose difference greater than 6% | For QA to pass: at least 96% structure volume must pass 3D gamma test with parameters 3%/3 mm DTA | |
| B | |||
| ADD4% | |||
| For QA to pass: 4% is the maximum allowed TPS computed and COMPASS measurement reconstructed average dose difference | For QA to pass: maximum of 4% structure volume may have TPS computed and COMPASS measurement reconstructed absolute dose difference greater than 4% | For QA to pass: at least 96% structure volume must pass 3D gamma test with parameters 2%/2 mm DTA | |
2. Methods
2.1. TD evaluation
The IBA TD consists of a 2D array of 1513 air-vented chambers, each with 0.016 cm3 active volume and 5 mm center-to-center spacing. The device has a built-in angle sensor, and is attached to the linac head accessory mount. It remains in place to acquire measurement during patient treatments. The battery powered detector communicates with a workstation via a wireless data connection. The radiation field covers a maximum of 40 × 40 cm2 projected at isocenter. The TD is used together with the IBA COMPASS system, a 3D dosimetry software suite. It uses measurements performed by a 2D ion chamber array (e.g. MatriXX or TD) or plans supplied by the TPS. To overcome the low physical detector resolution, a high-resolution MC calculation grid was used for computing the detector response. In detail, after a measurement is acquired the dose reconstruction process involves two steps. First, de-convolution converts the measured detector response into fluence. Second, the fluence is used to reconstruct the dose in the patient CT set. Due to the limited physical resolution of either detector (5 mm physical resolution of the TD and 7.62 mm of the MatriXX detector), the de-convolution process involves an intermediate step that uses a MC derived response function to transform the measured chamber response to one with resolution of less than a millimeter. The collapsed cone convolution-superposition dose engine is used to compute the doses. This process includes two steps. First, the distribution of total energy released per mass unit is determined by a ray trace of primary radiation through the patient, taking inhomogeneities into account. Second, the superpositioning of point kernels collapsed along radial rays in a spherical coordinate system is performed, again taking inhomogeneities into account [10].
The reference system for comparison was the IBA MatriXX detector, a 2D array of 1020 air-vented ion chambers mounted on the linear accelerator gantry that covers a 24.4 × 24.4 cm2 area. The ion chambers have 0.08 cm3 active volume and are spaced at 7.62 mm center-to-center. The detector is connected to a laptop with COMPASS software installed via RJ-45 cable and to an angle sensor. It is mounted on the accelerator gantry with source to surface distance of 76.2 cm. In addition to the 3 mm intrinsic absorber material above the chambers, an additional 5 mm of solid water build up is used. Details on the COMPASS system and both detectors have been made available by the vendor [11–13].
Our work uses COMPASS to compare three pairs of radiation doses:, TPS computed versus dose reconstructed using measurements acquired with either the MatriXX or TD detectors (TPS versus TD and TPS versus Matrixx) and dose reconstructed with MatriXX detector versus that reconstructed with TD detector (Matrixx versus TD). Each comparison was made using previously developed clinical QA criteria, and compared with the clinical and investigational thresholds in table 1. The performance of the TD was considered acceptable if it met the clinical QA criteria (row A).
2.2. 3D QA protocol with COMPASS system
Our 3D pre-treatment QA protocol includes two parts: statistical evaluation and DVH analysis. The statistical evaluation compares the difference between the TPS computed and measurement reconstructed doses using three statistical parameters: absolute average dose difference (AADD, measured in percent structure volume), ADD6% (Absolute dose difference greater than 6%, measured in percent structure volume) and 3D gamma analysis (measured in percent structure volume that fails the analysis). Details of the 3D QA protocol have been previously reported [14]. In brief, the authors determined the statistical parameters and action levels included in the 3D QA protocol based on measurements performed on 114 IMRT treatment plan deliveries (all passed ion chamber QA and 2D gamma evaluation QA), and based on the sensitivity of each of the three statistical parameters to detect clinically relevant errors. Those errors included, energy switched from 6 MV to 10 MV, multi leaf collimator (MLC) leaf errors, linac jaws errors, monitor unit (MU) errors, MLC and gantry angle errors, and detector shift errors. The proposed novel 3D QA protocol was sensitive enough to detect most of the introduced errors and was superior to QA performed using 2D gamma analysis or using ion chamber by detecting 14 out of the 18 introduced errors. The errors not detected were too subtle and were not detected by any of the three QA methods investigated. Those errors included, MU change by 1% and energy switched to 10 MV. Out of the three QA methods investigated by the authors only the novel 3D QA protocol successfully detected errors that affect small patient volume, but their occurrence will render the treatment plan clinically unacceptable by introducing hot/cold spots. For an example, such errors were single central MLC leaf placed all the way in the treatment field or all the way out of it. Furthermore, using three different parameters helps address the disadvantages of using gamma test as previously discussed and different statistical parameters were sensitive to different errors.
The first statistical parameter was AADD which compared for each structure the average dose predicted by the TPS and the measurement reconstructed. The average dose was computed by summing the dose values for all voxels falling into given structure and dividing by the number of voxels. The average dose difference between both doses was computed using (1).
The second parameter was structure volume with an absolute dose difference greater than 6% (ADD6%). The system compared two dose matrices, TPS predicted and measurement reconstructed. Both consisted of the same number of voxels and structures. For any plan structure COMPASS computed the absolute dose difference deposited in a voxel with the same location in both matrixes. If the absolute dose difference was greater than 6% this voxel pair failed. The total percent of each structure volume that failed this statistical parameter is calculated and reported. In this work we also tested a stricter parameter, absolute dose difference greater than 4% (ADD4%).
The final parameter was 3D gamma analysis with computation done globally, 10% maximum dose threshold and test parameters 3%/3 mm distance to agreement (DTA) and 2%/2 mm DTA. The principle of gamma analysis was described previously [15]. In addition to applying a 3D gamma test to each structure of interest, we performed a 3D gamma test for the whole patient volume. Table 1 summarizes the complete 3D QA protocol. To test if the patient treatment might violate these constraints at the time of QA, the three investigated dose parameters were evaluated for all structures of interest.
The second part of the QA protocol was the DVH analysis. The IMRT dose constraints used were based on the QUANTEC [16] project data and on RTOG protocols [17] (femurs, bladder, whole rectum, anterior and posterior rectum, spinal cord, larynx, optic nerves, chiasm, oral cavity, trachea, brainstem, esophagus QUANTEC based; mandible RTOG1016 based; cochlea RTOG 0615 based; eyes and eye lenses RTOG 0651 based; lung, heart, ventricles and atria RTOG 0623 based). The SBRT constraints were based on the AAPM Task Group-101 report [18]. Additionally, at least 95% of the treatment target volume should receive 100% of the prescription dose.
In addition to evaluating if certain dose constraints were met, an evaluation of the complete DVH graphs was performed. For all structures of interest the difference between the TPS computed and measurement reconstructed with either detector dose, delivered to 5%–100% of the structure volume (with a 5% step), was evaluated.
In the case where results for a given statistical parameter violate the pass criterion, as indicated in table 1(A), we performed a manual review. The review consists of overlaying computed and measurement reconstructed dose difference or gamma analysis results with the patient CT set. A team of physicists examines the differences to ensure that the areas of dose difference would likely result in little clinical impact on the patient. In addition to investigating the dose difference/gamma results, DVH analysis is performed for the structure/s that fail QA.
Before each use, a consistency check was performed on both the MatriXX and the TD detectors. The process checks if the detector setup was correct, as well as if the device performed consistently. Either detector was checked by delivering 100MU to a 10 cm2 × 10 cm2 field and recording the measured counts. This measurement was performed twice, 5 min apart, and the two measured counts are required to be within 0.1% difference. For an example, the recorded counts from all ion chambers in the 10 cm2 × 10 cm2 field, for three different days and when using the TD were: Day 1: 66386 and 66370 (0.025% difference); Day 2: 66332 and 66349 (0.026% difference); Day 3: 66390 and 66378 (0.019% difference).
2.3. Simple geometry treatment plans
Four single MLC segment plans and one multiple MLC segment plan were created in Raystation TPS using 30 × 30 × 30 cm sold water phantom. Single segment plans included, C-shape, diagonal shape, diamond shape and hour glass shape. The multiple segment plan consisted of 6 segments, including 5 × 5 cm, 10 × 10 cm, 15 × 15 cm, 20 × 20 cm. For each plan 4 structures were contoured, including structure that contours the whole phantom volume, structure that contours the MLC shape, and two spheres with radii of 2 and 4 cm (figure 1). All 5 plans were delivered twice on an Elekta linear accelerator with gantry at zero degrees, once for a measurement acquired with the MatriXX detector and once for a measurement acquired with the TD.
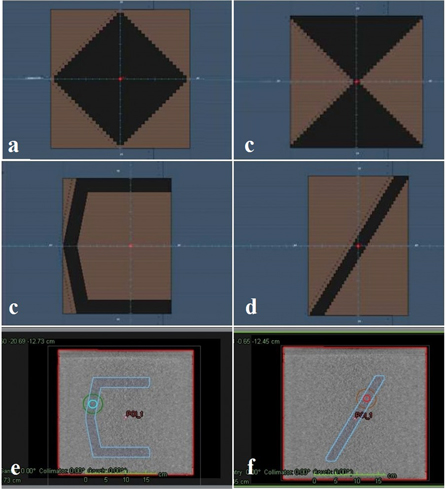
Figure 1. Simple geometry patterns, including (a) diamond shape, (b) hour glass shape, (c) C-shape, (d) diagonal shape. Figures (e) and (f) show the 4 structures contoured in each plan, including the whole phantom volume (in red), the MLC shape (in blue), two spheres with radii of 2 and 4 cm (in turquoise and green).
Download figure:
Standard image High-resolution image2.4. Patient and treatment plan structures selection
A total of 19 SBRT and IMRT clinical treatment deliveries were investigated. All met the clinical treatment plan goals as accepted in our institution and were approved for a treatment by a physician. For the SBRT treatment plans prescription doses ranged from 40 to 75 Gy delivered over 4–10 fractions. For the IMRT treatment plans, the prescription doses ranged from 18 to 72 Gy delivered over 10–40 fractions. Step-and-shoot IMRT plans included 5 thoracic, 4 HN and 3 genitourinary (GU) cases. Step-and-shoot SBRT plans included 4 thoracic and 3 gastrointestinal (GI) patient plans. No wedges were used for either treatment modality plans. Both IMRT and SBRT plans were delivered with step-and-shoot technique. The IMRT plans had 5–9 gantry angles, and the SBRT plans had 5–10 gantry angles. IMRT MU per treatment beam ranged from 42 to 208, SBRT MU per treatment beam ranged from 170 to 370. All treatments had previously passed QA performed with a single ion chamber and a Sun Nuclear ArcCHECK. Treatment plan structures investigated included, prostate, seminal vesicles, femoral heads, whole rectum, anterior and posterior rectum or rectal wall, and bladder for the GU clinic; target treatment site, normal lungs, spinal cord, heart, ventricles, atria, esophagus for the thoracic clinic; target treatment site, kidneys, stomach, spinal cord, intestines, liver, lungs, heart ventricles, atria, and femurs for the GI clinic; target treatment site, brain stem, spinal cord, parotid glands, larynx, mandible, esophagus, eyes, eye lenses, optic nerves, chasm, oral cavity, trachea and cochlea for the HN clinic. If a paired structure was present in the treatment plan, such as the femoral heads, both the left and the right structure were investigated. The number of structures investigated ranged from 7–10 for the IMRT GU or thoracic cases, 7–18 for the IMRT HN cases, from 6–13 for the SBRT thoracic cases, and 4–9 for the SBRT GI cases. All patient treatment plans were created using a RaySearch Raystation (RaySearch Laboratories, Stockholm, Sweden) TPS. Each plan was measured twice on an Elekta accelerator (Elekta, Stockholm Sweden), once with the TD detector and once with the MatriXX detector.
3. Results
For figures 2–8 each box and whiskers show the minimum, 25%, 50%, 75% and the maximum of the comparisons (figure 2 contains a visual legend bordered in red). A square indicates the mean and asterisks indicate the 1% and 99% levels of the comparisons. Each bin represents one of the three dose pairs investigated, including TPS predicted versus MatriXX measured, TPS predicted versus TD measured, and MatriXX measured versus TD measured. For figures 2–4 SBRT and IMRT results were separated and for figures 5–8 merged.
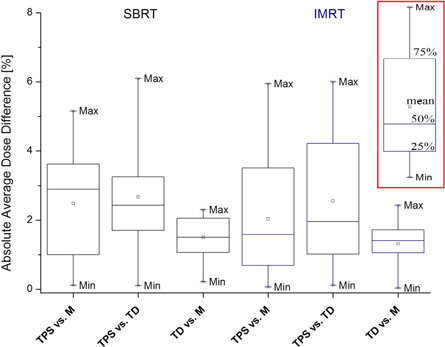
Figure 2. Absolute average dose difference results for SBRT and IMRT treatment plans. The pass criterion was 6%, meaning the maximum allowed average dose difference was 6%. In red border is the legend.
Download figure:
Standard image High-resolution image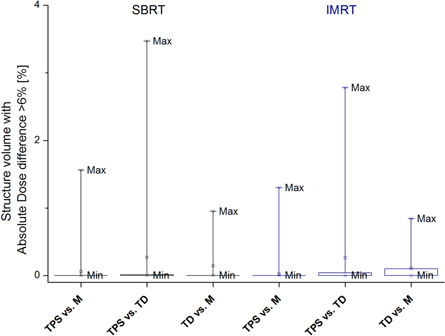
Figure 3. Absolute dose difference greater than 6% results for SBRT and IMRT treatment plans. The pass criterion was 4% volume, meaning maximum of 4% structure volume may have absolute dose difference greater than 6%.
Download figure:
Standard image High-resolution image
Figure 4. Percent structure volume that fails 3%/3 mm DTA 3D gamma analysis for both SBRT and IMRT treatment plans. The pass criterion was 4% volume, meaning for any structure at least 96% of the volume must pass the test.
Download figure:
Standard image High-resolution image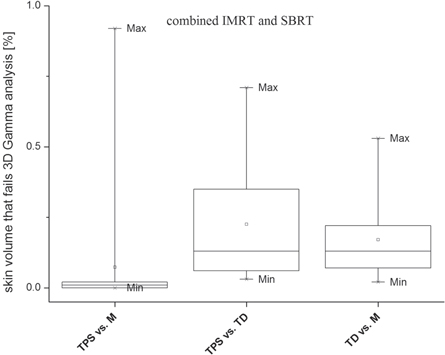
Figure 5. Percent total patient volume (skin structure) that fails 3%/3 mm DTA 3D gamma analysis. Results for SBRT and IMRT treatment plans were merged. The pass criterion was 4% volume, meaning for any structure at least 96% of the volume must pass the test.
Download figure:
Standard image High-resolution image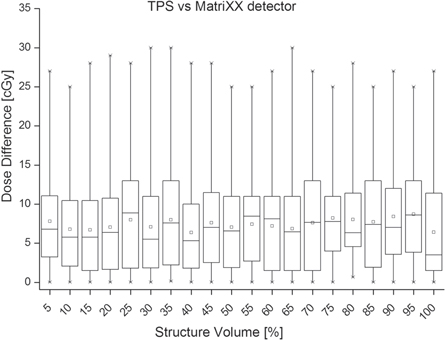
Figure 6. DVH analysis results for TPS dose versus MatriXX detector measurement reconstructed dose. SBRT and IMRT results are grouped.
Download figure:
Standard image High-resolution image
Figure 7. DVH analysis results for TPS dose versus transmission detector measurement reconstructed dose. SBRT and IMRT results are grouped.
Download figure:
Standard image High-resolution image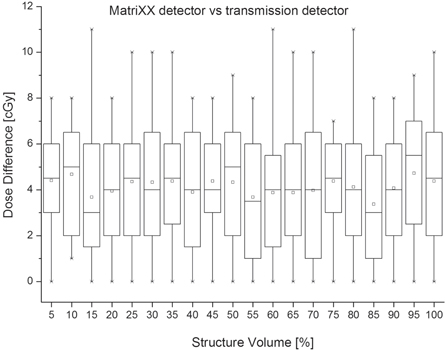
Figure 8. DVH analysis results for MatriXX detector versus transmission detector measurement reconstructed doses. SBRT and IMRT results are grouped.
Download figure:
Standard image High-resolution imageAs previously mentioned, we investigated two 3D QA protocols. One developed in [17] (table 1(A)) and a stricter one (table 1(B)). However, when the stricter QA protocol was used the TPS computed and measured with either detectors dose difference was significant, and results were excluded from the graphs and tables. For an example, for 10 IMRT and 6 SRBT treatment plans 2%/2 mm DTA 3D gamma analysis resulted in multiple structure volumes failing by more than 80%. For those plans the skin structure volume that failed the stricter gamma analysis was above 25%. Additionally, the more restrictive ADD4% parameter resulted in multiple structures in multiple treatment plans to have above 75% structure volume with ADD greater than 4%. This was observed for 11 IMRT and 5 SBRT treatment plans. However, this observation did not apply to the treatment targets. Table 4 shows results for treatment target only and when stricter 3D QA statistical parameters were used. Results showed excellent agreement between the TPS computed and measurement reconstructed with either detector target doses. Results for both treatment modalities were comparable.
3.1. Absolute average dose difference results
Results for AADD statistical parameter are shown in tables 2 and 3, and in figure 2. For simple geometry plans investigated this parameter was the most sensitive and registered the biggest dose difference across the three dose pairs investigated. This was especially valid for the MLC shape, 2 cm sphere and 4 cm sphere structures. In contrast, the whole phantom structure had an excellent dose agreement resulting in 0% AADD for any plan and dose pair.
Table 2. Analysis of simple geometry plan results.
| Absolute average dose difference AADD (%) | |||||||||||||||
|---|---|---|---|---|---|---|---|---|---|---|---|---|---|---|---|
| C-shape | Diagonal shape | Diamond shape | Hour glass shape | Multiple segments | |||||||||||
| Stat. parameter #1 | TPS versus M | TPS versus TD | M versus TD | TPS versus M | TPS versus TD | M versus TD | TPS versus M | TPS versus TD | M versus TD | TPS versus M | TPS versus TD | M versus TD | TPS versus M | TPS versus TD | M versus TD |
| Whole phantom | 0.00 | 0.00 | 0.00 | 0.00 | 0.00 | 0.00 | 0.00 | 0.00 | 0.00 | 0.00 | 0.00 | 0.00 | 0.00 | 0.00 | 0.00 |
| MLC shape | 0.20 | 0.40 | 0.00 | 0.10 | 0.10 | 0.00 | 0.20 | 0.18 | 0.00 | 0.15 | 0.23 | 0.00 | 0.20 | 0.20 | 0.01 |
| 2 cm sphere | 0.10 | 0.12 | 0.00 | 0.25 | 0.31 | 0.00 | 0.10 | 0.10 | 0.00 | 0.10 | 0.10 | 0.00 | 0.18 | 0.17 | 0.02 |
| 4 cm sphere | 0.05 | 0.08 | 0.00 | 0.33 | 0.40 | 0.00 | 0.15 | 0.19 | 0.00 | 0.20 | 0.20 | 0.00 | 0.30 | 0.30 | 0.01 |
| Stat. parameter #2 | Absolute dose difference greater than 6% AAD6% (%) | ||||||||||||||
| Whole phantom | 0.00 | 0.00 | 0.00 | 0.00 | 0.00 | 0.00 | 0.00 | 0.00 | 0.00 | 0.00 | 0.00 | 0.00 | 0.00 | 0.00 | 0.00 |
| MLC shape | 0.00 | 0.00 | 0.00 | 0.00 | 0.00 | 0.00 | 0.00 | 0.00 | 0.00 | 0.00 | 0.00 | 0.00 | 0.00 | 0.00 | 0.00 |
| 2 cm sphere | 0.00 | 0.00 | 0.00 | 0.00 | 0.00 | 0.00 | 0.00 | 0.00 | 0.00 | 0.00 | 0.00 | 0.00 | 0.00 | 0.00 | 0.00 |
| 4 cm sphere | 0.00 | 0.00 | 0.00 | 0.00 | 0.00 | 0.00 | 0.00 | 0.00 | 0.00 | 0.00 | 0.00 | 0.00 | 0.00 | 0.00 | 0.00 |
| Stat. parameter #3 | % structure volume that FAILS 3%/3 mm Gamma test (%) | ||||||||||||||
| Whole phantom | 0.00 | 0.00 | 0.00 | 0.00 | 0.00 | 0.00 | 0.00 | 0.00 | 0.00 | 0.00 | 0.00 | 0.00 | 0.00 | 0.00 | 0.00 |
| MLC shape | 0.00 | 0.00 | 0.00 | 0.00 | 0.00 | 0.00 | 0.01 | 0.00 | 0.00 | 0.00 | 0.00 | 0.00 | 0.01 | 0.02 | 0.00 |
| 2 cm sphere | 0.01 | 0.00 | 0.00 | 0.00 | 0.00 | 0.00 | 0.00 | 0.00 | 0.00 | 0.00 | 0.00 | 0.00 | 0.10 | 0.10 | 0.00 |
| 4 cm sphere | 0.02 | 0.01 | 0.00 | 0.00 | 0.00 | 0.00 | 0.01 | 0.02 | 0.00 | 0.00 | 0.00 | 0.00 | 0.20 | 0.20 | 0.00 |
Table 3. Analysis of IMRT/SBRT results for the three statistical parameters currently included in the pre-treatment 3D QA protocol. Pass criterion are given in the brackets.
| Absolute average dose difference (%) (6% pass criterion) | ||||||
|---|---|---|---|---|---|---|
| SBRT | IMRT | |||||
| Stat. parameter #1 | TPS versus M | TPS versus TD | M versus TD | TPS versus M | TPS versus TD | M versus TD |
| Min. (%) | 0.11 | 0.10 | 0.21 | 0.06 | 0.11 | 0.03 |
| Max. (%) | 5.16 | 6.10 | 2.30 | 5.94 | 6.00 | 2.43 |
| Range (%) | 5.04 | 5.99 | 2.09 | 5.88 | 5.89 | 2.40 |
| Average (%) | 2.49 | 2.67 | 1.50 | 2.04 | 2.56 | 1.32 |
| St. dev. (%) | 1.53 | 1.61 | 0.59 | 1.63 | 1.77 | 0.54 |
| Median (%) | 2.89 | 2.43 | 1.50 | 1.58 | 1.95 | 1.41 |
| Stat. parameter #2 | ADD6% (%) (4% pass criterion) | |||||
| Min. (%) | 0.00 | 0.00 | 0.00 | 0.00 | 0.00 | 0.00 |
| Max. (%) | 1.56 | 3.47 | 0.95 | 1.30 | 2.78 | 0.84 |
| Range (%) | 1.56 | 3.47 | 0.95 | 1.30 | 2.78 | 0.84 |
| Average (%) | 0.06 | 0.27 | 0.14 | 0.02 | 0.26 | 0.10 |
| St. dev. (%) | 0.26 | 0.69 | 0.31 | 0.14 | 0.62 | 0.20 |
| Median (%) | 0.00 | 0.00 | 0.00 | 0.00 | 0.00 | 0.00 |
| Stat. parameter #3 | % structure volume that FAILS 3%/3 mm Gamma test (%) (4% pass criterion) | |||||
| Min. (%) | 0.00 | 0.00 | 0.00 | 0.00 | 0.00 | 0.00 |
| Max. (%) | 2.38 | 1.96 | 0.87 | 2.44 | 2.98 | 0.86 |
| Range (%) | 2.38 | 1.96 | 0.87 | 2.44 | 2.98 | 0.86 |
| Average (%) | 0.09 | 0.35 | 0.10 | 0.08 | 0.50 | 0.14 |
| St. Dev. (%) | 0.39 | 0.60 | 0.21 | 0.33 | 0.87 | 0.24 |
| Median (%) | 0.00 | 0.00 | 0.00 | 0.00 | 0.01 | 0.00 |
| Min. (%) | 0.00 | 0.03 | 0.02 | % skin volume that FAILS 3%/3 mm gamma test (%) | ||
| Max. (%) | 0.92 | 0.71 | 0.53 | |||
| Range (%) | 0.92 | 0.68 | 0.51 | |||
| Average (%) | 0.07 | 0.23 | 0.17 | |||
| St. dev. (%) | 0.21 | 0.21 | 0.14 | |||
| Median (%) | 0.01 | 0.13 | 0.13 | |||
There was a good agreement for both treatment modality plans and three dose pairs investigated. Seventy five percent of all AADD values were below 4.3% (figure 2). For the TPS versus M dose pair, 2 of 12 IMRT and 1 of 7 SBRT treatment plans had a single structure with AADD close or a little above the 6% QA pass threshold. For the TPS versus TD dose pair such plans were 5, including 3 IMRT and 2 SBRT (table 2, statistical parameter AADD, maximum values).
3.2. Absolute dose difference greater than 6% results
Tables 2 and 3, and figure 3 show results for ADD6% with pass criterion of 4%. For simple geometry plans, and AAD6% and 3D gamma analysis statistical parameters, an excellent agreement for any investigated dose pair and structure was observed plans. For any structure and dose pair the ADD6% was 0%, meaning no structure volume had absolute dose difference greater than 6%. The largest structure volume that failed 3D gamma analysis was 0.2%, which was well below the 4% QA pass threshold. This result was observed at the multiple segments plan (4 cm sphere structure, both TPS versus M and TPS versus TD dose pairs).
The pass criterion was well met and no treatment plans needed manual review from both SBRT and IMRT plans. The range of values (table 3) was bigger for the SBRT plans and for all three dose pairs investigated. Seventy five percent of all ADD6% values were below 0.2%. A single SBRT plan, TPS versus TD dose pair, had two structures for which the ADD6% was close to the 4% QA pass threshold (table 3, statistical parameter ADD6%, maximum values).
3.3. 3D gamma analysis results
Results for structure volume that fails 3D gamma analysis with 4% volume pass criterion are shown on table 2 and in figures 4 and 5. Figure 4 shows results for all structures and the three dose pairs, while figure 5 shows the results for the skin structure only. The 4% volume pass criterion was well met for both treatment modalities and all dose pairs investigated (table 4 and figure 4). Results for both treatment modalities and three dose pairs investigated were comparable. For all patients, the skin structure volume that failed the analysis was less than 1% (table 3 and figure 5). Better agreement was observed for the TPS versus M dose pair (figures 4 and 5). For the TPS versus IMRT dose pair and both treatment modalities, 75% of all structures had less than 0.1% volume that failed the gamma analysis. For the TPS versus TD dose pair this volume was less than 0.6% (figure 4).
Table 4. Analysis of IMRT/SBRT results for stricter statistical parameters than those currently in the 3D QA protocol (table 1(A)) and for the treatment target only.
| TPS versus MatriXX detector | TPS versus TD detector | |||||
|---|---|---|---|---|---|---|
| Abs. average dose diff. (%) | (%) target volume with absolute dose diff > 4% | Target volume that fails 2%/2 mm 3D gamma analysis (%) | Abs. average dose diff. (%) | (%) target volume with absolute dose diff >4% | Target volume that fails 2%/2 mm 3D gamma analysis (%) | |
| IMRT case: 1 | 0.7 | 0.0 | 0.2 | 0.8 | 0.0 | 0.4 |
| 2 | 1.9 | 0.0 | 1.0 | 0.7 | 0.0 | 0.6 |
| 3 | 1.9 | 0.0 | 0.1 | 0.1 | 0.1 | 1.0 |
| 4 | 0.0 | 0.0 | 1.4 | 0.9 | 0.0 | 1.1 |
| 5 | 2.3 | 0.0 | 0.2 | 1.6 | 0.0 | 1.2 |
| 6 | 2.0 | 0.0 | 0.0 | 1.6 | 0.0 | 0.0 |
| 7 | 0.0 | 0.0 | 0.0 | 0.1 | 0.0 | 0.3 |
| 8 | 0.0 | 0.8 | 0.2 | 0.5 | 0.5 | 1.7 |
| 9 | 0.0 | 0.0 | 0.0 | 1.2 | 0.3 | 0.5 |
| 10 | 1.5 | 0.0 | 0.3 | 0.4 | 0.0 | 0.3 |
| 11 | 0.9 | 0.0 | 0.0 | 0.5 | 0.0 | 0.8 |
| 12 | 1.5 | 0.1 | 0.5 | 1.4 | 0.9 | 1.5 |
| SBRT case: 1 | 0.6 | 0.0 | 0.4 | 1.1 | 0.0 | 0.0 |
| 2 | 0.9 | 0.4 | 0.0 | 2.1 | 0.0 | 0.5 |
| 3 | 0.6 | 0.0 | 0.0 | 1.7 | 0.0 | 0.0 |
| 4 | 1.1 | 0.1 | 0.1 | 1.2 | 0.4 | 0.9 |
| 5 | 0.5 | 0.0 | 0.2 | 0.6 | 0.0 | 0.1 |
| 6 | 0.1 | 0.0 | 0.0 | 0.1 | 0.0 | 1.0 |
| 7 | 1.1 | 0.0 | 0.0 | 2.1 | 0.2 | 0.8 |
3.4. Dose volume histogram analysis results
In our clinic the IMRT constraints follow from the QUANTEC project [16] and relevant RTOG reports [17]. The SBRT constraints follow the TG-101 report [18]. QA results from both detectors demonstrated that the dose constraints of interest were generally met, with a few notable exceptions. For three thoracic IMRT plans the dose limit to one of the lungs was not met. For two of the GI SBRT plans the large intestine dose constraint was not met. All exceptions occurred in all three doses investigated and had equivalent values. For all but two target volumes at least 95% of the volume received the prescription dose. The exceptions were observed in one H&N and one GU patient. The unmet constraints came from the treatment plans, which have previously been reviewed by a physician in our institution and approved for treatment.
Additionally, to checking if certain dose constraints were met, during the DVH analysis we compared the absolute dose difference between TPS computed and measured doses for 5%–100% structure volume, with a 5% step. Figures 6–8 show this difference. Results for both treatment modalities and all plan structures were comparable, thus we decided to merge the results to give a compact, overall view of the measurement differences between detectors. There will be variations in the statistics per structure and modality, but those reflect the planning rather than the measurement. Each bin represents dose difference for volumes of all structures investigated and both treatment modalities. For the TPS versus MatriXX dose pair, the maximum absolute dose difference ranged between 25 cGy and 30 cGy (figure 6). For this dose pair the maximum 75% absolute difference was 13 cGy. For the TPS versus TD dose pair the maximum dose difference had a wider range of 25cGy–45cGy (figure 7). The maximum 75% absolute difference was 17 cGy, with one exception of 23 cGy.
Figure 8 shows the absolute dose difference between measurement reconstructed doses with both detectors. The maximum absolute dose difference ranged between 7 cGy and 11 cGy. The maximum 75% absolute dose difference was 7 cGy.
4. Discussion
The current work investigated the clinical implementation of a novel radiation detector for pre-treatment 3D IMRT and SBRT QA. The device is designed to stay on the linac during patient treatment, thus has the potential to perform real time patient QA by recomputing the daily measured dose on the planning CT. Out intend was to evaluate the device in typical clinical settings, thus no delivery or measurement uncertainties were removed. Its performance was compared to that of another detector using a previously established established 3D pre-treatment QA protocol (table 1(A) [17]).
The pass/fail thresholds for structure-specific analysis of organs at risk cannot be directly compared with more traditional IMRT QA thresholds. This is because the structures can be small in volume, amplifying the effect of small differences, and because organs at risk are usually relatively low dose and may contain high dose gradients. This might result in OAR TPS computed and measured dose difference larger than that for a treatment target. For clinical simplicity, a unified pass criteria for both treatment targets and OAR were used. The maximum TPS computed and measurement reconstructed with either detectors dose difference values, as seen on figures 2–4, were for low dose and/or high dose gradient OAR. However, table 4 shows excellent agreement between the TPS computed and measurement reconstructed with either detector treatment target doses, even with stricter QA criteria. When stricter set of parameters (table 1(B)) were investigated for OAR, this resulted in computed and measured with either detector dose difference well above the QA protocol pass thresholds. This was valid for both IMRT and SBRT treatment plans. After review, we concluded the dose difference was due to the OAR being in low dose region, containing high dose gradient, and due to delivery and measurement uncertainties.
The first step of the evaluation process were measurements of 4 single MLC segment and 1 multiple MLC segment treatment plans. All MLC segments were static. An excellent agreement between the three dose pairs and all plans was observed.
The second step of the evaluation process included performing measurements with both detectors on 19 IMRT and SBRT treatment plans. Out of the three statistical parameters included in our 3D QA protocol the AADD registered the largest dose difference, well pronounced between TPS computed and measurement reconstructed with either detectors dose pairs (figure 2). The largest AADD was observed for structures receiving low dose. For such structures the absolute dose difference in (cGy) was low, but the relative dose difference in (%) was high. For an example, figure 2, SBRT, TPS versus TD dose pair, the largest AADD of 6.1% was for the chiasm structure. The TPS computed average dose was 816.2 cGy, while the measured average dose was 750.9 cGy. Thought the relative difference computed using (1) was 6.1%, further investigation showed that the absolute difference between the two doses was 21.4 cGy, which we did not consider clinically significant in this case. After review, we concluded the dose difference stems from measurement and delivery uncertainties. One such uncertainty is the sub-optimal physical resolution of the MatriXX detector. Another one is the slightly different dose computation algorithms in the RayStation TPS and COMPASS system.
The 4% structure volume QA pass threshold for the other two statistical parameters, ADD6% and 3D gamma analysis, was well met for any dose pair investigated (table 3, maximum values). It was observed that results close to the threshold were all for structures located at or near the treatment field edge. These areas have the highest dose modulation and is where the TPS computed and measurement reconstructed doses might differ the most. One such structure was the anterior rectum.
In our clinic, at least 95% of the treatment target volume should receive 100% of the prescription dose. This condition was met for all but two target volumes, one IMRT GU and one SBRT HN. The worst coverage was found with a GU IMRT plan, where the TPS indicated prescription level coverage of 96.7%, but the measured coverage was 89.9% based on a MatriXX, and 92.9% based on TD measurement. Although the measured coverage was well below desired, 95% of the target volume received just under the prescription dose of 5040 cGy. This was determined to be clinically acceptable by a physicist and valid for the other two plans as well.
A desired feature that can be added to the COMPASS system in the future is the ability to perform quantitative analysis and comparisons of the entire DVH graph, rather than relying on discrete DVH volume or dose values. For patients and structures of interest included in this work, the DVH graphs were in an agreement. The biggest DVH difference between TPS computed and either detector was observed for the following structures: anterior/posterior rectum, atria, ventricles, optic nerves, cochlea and mandibles. For figure 6: anterior rectum, 15% structure volume: 28.1 (cGy); optic nerve, 30% and 35% structure volumes: 30.5(cGy) and 30.4(cGy); atria, 65% structure volume: 30.5(cGy); cochlea, 80% structure volume: 28,8(cGy); ventricles, 90% structure volume: 27.2(cGy); posterior rectum, 100 structure volume: 27.9 (cGy). For figure 7: anterior rectum, 20% structure volume: 40.2(cGy); optic nerve, 10% and 35% structure volume: 35.4(cGy)and 40.1(cGy); atria, 40% and 65% structure volumes: 38.2(cGy) and 39.5(cGy); cochlea, 60% structure volume: 34.8(cGy); mandibles, 30% and 95% structure volumes: 36.9(cGy) and 32.7(cGy); ventricles, 85% structure volume: 34.1(cGy); posterior rectum, 100% structure volume: 46.2(cGy).
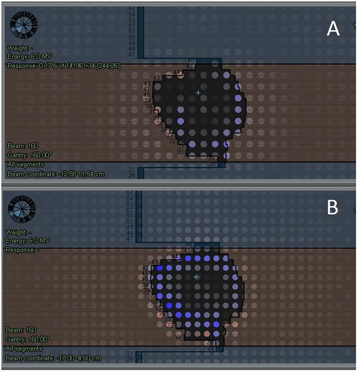
A general observation was a slight difference between the TPS computed and measurement reconstructed doses, especially seen at the field edges (figure 9). The difference was within 1%–2% and was observed for doses measured by both detectors, but generally slightly higher with the TD. The difference was minimal for the AADD parameter (figure 2) but more pronounced for the ADD6% (figure 3) and gamma analysis parameters (figure 4). It could also be seen on DVH analysis results (figures 6 and 7). After a review, we found that this difference occurred for several different patient treatment plans. During the de-convolution step of COMPASS measurement dose reconstruction, as described in section 2.1, a slight difference between the TPS computed and measured field edge fluence occurs and subsequently is causing the dose difference. We found that two were the major factors causing this difference. As mentioned in the beginning of this paragraph, the field edge is the area of the highest dose modulation. Secondly, the 3D QA system sensitivity and increased TD physical resolution may detect subtle delivery uncertainties. One such uncertainty is the individual MLC leaf position. This TPS versus measured with either detectors dose difference was minimized in the COMPASS system by optimizing the linac beam model.
Figure 9. TPS predicted versus measurement reconstructed with MatriXX detector (A) and measurement reconstructed with TD detector (B) showing dose differences observed at the field edge for a SBRT patient. Ion chambers for which the dose difference is 1%–1.5% are in blue/light blue color.
Download figure:
Standard image High-resolution image
Another observation was the larger difference between TPS computed and measurement reconstructed with the TD doses, compared to measurement reconstructed with the MatriXX detector dose (figures 4 and 5). All plans were created using the same version of RayStation TPS. The same version of the COMPASS system was used, where the TPS computed and COMPASS computed doses were equivalent. Thus, we concluded the dose difference stems from the better spatial resolution of the TD detector, which leads to better delivery uncertainty detection.
Final observation that we would like to share is the need for additional time to perform 3D QA with COMPASS system in comparison to other QA systems. For an example, in our department another QA system, IBA OmniPro I'mRT (capable of performing 2D gamma analysis), is present. Typically, it takes about 5 min to produce the final QA report with it and about 10 min when COMPASS system was being used. This time estimate includes loading the acquired measurement into the software; computing, reconstructing and analyzing the dose; and pdf report generation. The most time consuming is the dose reconstruction performed directly in the patient CT. On the other hand, Nakaguchi et al [19] concluded that the time needed to perform 3D QA with the COMPASS system is significantly less compared to the time needed when other 3D QA system were used. This is especially valid when the TD, instead of the MatriXX detector, is used due to the shorter setup up time and the detector being always attached to the linac gantry. This also leads to another advantage of using the TD, its potential use for intra-, post- and real time patient QA.
5. Conclusion
Measurements were performed for 12 IMRT and 7 SBRT patient treatment deliveries using two detectors, a novel TD and a MatriXX detector. Results showed that both detectors are suitable for IMRT and SBRT treatment modalities, with equivalent results on three different statistical parameters, and DVH analysis. The investigation of a stricter set of 3D QA statistical parameters was unsuccessful. The TD was found to be capable of performing pre-treatment patient QA.