


Abstract
Magnetic particle imaging (MPI) is a promising new tracer modality with zero attenuation in tissue, high contrast and sensitivity, and an excellent safety profile. However, the spatial resolution of MPI is currently around 1 mm in small animal scanners. Especially considering tradeoffs when scaling up MPI scanning systems to human size, this resolution needs to be improved for clinical applications such as angiography and brain perfusion. One method to improve spatial resolution is to increase the magnetic core size of the superparamagnetic nanoparticle tracers. The Langevin model of superparamagnetism predicts a cubic improvement of spatial resolution with magnetic core diameter. However, prior work has shown that the finite temporal response, or magnetic relaxation, of the tracer increases with magnetic core diameter and eventually leads to blurring in the MPI image. Here we perform the first wide ranging study of 5 core sizes between 18 and 32 nm with experimental quantification of the spatial resolution of each. Our results show that increasing magnetic relaxation with core size eventually opposes the expected Langevin behavior, causing spatial resolution to stop improving after 25 nm. Different MPI excitation strategies were experimentally investigated to mitigate the effect of magnetic relaxation. The results show that magnetic relaxation could not be fully mitigated for the larger core sizes and the cubic resolution improvement predicted by the Langevin was not achieved. This suggests that magnetic relaxation is a significant and unsolved barrier to achieving the high spatial resolutions predicted by the Langevin model for large core size superparamagnetic iron oxides.
Export citation and abstract BibTeX RIS
1. Introduction and background
Magnetic particle imaging (MPI) is a new tracer-based molecular imaging technique that directly detects and quantifies the magnetization of superparamagnetic iron oxide (SPIO) tracers. As in other molecular imaging techniques like nuclear medicine, there is no signal from background tissue in MPI, giving MPI images high image contrast for SPIO tracers. This unique contrast mechanism, combined with the use of low-frequency magnetic fields and clinically safe magnetic tracers, enables MPI to produce clinical-grade images with zero tissue signal attenuation and high image sensitivity (Gleich and Weizenecker 2005, Goodwill and Conolly 2010). As in MRI, safety in MPI is bound by magnetostimulation and specific absorption rate (SAR) safety limitations (Saritas et al 2013b). MPI is best compared to gold-standard tracer imaging techniques, such as nuclear medicine, but without the limitations of radiation safety or radionuclide half-life for longitudinal imaging. As such, MPI shows excellent promise for clinical applications such as angiography (Haegele et al 2012, Salamon et al 2016), stem cell tracking and vitality assessment (Fidler et al 2015, Zheng et al 2015, 2016, Them et al 2016), brain perfusion (Orendorff et al 2016), lung perfusion (Zhou et al 2016), lung ventilation (Nishimoto et al 2015), cancer imaging (Yu et al 2016), and localized hyperthermia (Murase et al 2015, Hensley et al 2016).
1.1. Working principles of MPI
MPI works by exploiting the nonlinear magnetization of the SPIO tracers used. At any given time during a scan, strong magnetic field gradients magnetically saturate the SPIO tracers in most of the imaging field-of-view (FOV), leaving only tracers near a field-free-region (FFR) unsaturated. Only these tracers are able to respond to a superposed AC driving magnetic field, typically at 20 kHz. As a result, the detected MPI signal from an inductive pick-up coil is dominated by the tracers at the FFR, thereby localizing the signal to the FFR and forming the basis of spatial encoding in MPI. Following the x-space approach, image reconstruction can be performed by gridding the MPI signal to the instantaneous location of the FFR (Goodwill and Conolly 2010). Because the SPIO magnetization curve is nonlinear, multiple harmonics of the drive frequency are generated with the application of the drive waveform. Reconstruction can also be performed in the frequency domain by obtaining a system function and then solving the inverse problem of the spectral image data (Rahmer et al 2009). Both methods have to discard signal at the fundamental frequency as a consequence of direct feedthrough from the excitation waveform and reconstruct from the higher harmonics. To scan the full FOV, strong electromagnets are used to slowly raster the FFR across the entire FOV. Hardware details of the MPI scanners such as the Philips-Bruker 3D Fast MPI demonstrator scanner (Rahmer et al 2015) and the Berkeley x-space scanners (Goodwill et al 2012b, 2012c) have been discussed in prior work.
1.2. Spatial resolution in MPI
Spatial resolution in MPI is closely linked to the shape of the M–H magnetization curve of the SPIO. A steeper M–H curve results in a narrower x-space PSF. This also implies stronger higher harmonics leading to a better modulation transfer function for frequency domain reconstruction. This results in a more well-posed inverse problem leading to better SNR and less artifacts in the reconstructed image and therefore improved effective resolution. For an ensemble of ideal superparamagnetic nanoparticles, each with magnetic moment m, the M–H curve can be described by the Langevin function as follows:

where  is the Langevin function which is analytically defined as
  . The constant
  is determined by the magnetic properties of the nanoparticle and defined as:

The steepness of the M–H curve is closely linked to m which is defined as:

The magnetic core diameter d has a profound impact on the M–H curve and, correspondingly, spatial resolution in MPI. Previous studies on SPIO sizes from 13 to 19 nm have shown improved MPI resolution with increasing core size to 19 nm (Ferguson et al 2009, 2010). Similarly, studies on the Feraspin series (size-fractionated Resovist) show improved MPI spectra with increased size-fraction (Ludwig et al 2012).
Rahmer et al (2009) showed that MPI spatial resolution should be inversely proportional to the cube of the magnetic core diameter using the system matrix MPI reconstruction method. Knopp et al (2011) also showed the width of the convolution kernel highly depends on the particle size. Precisely the same resolution limit was derived for the x-space MPI reconstruction method (Goodwill and Conolly 2010). For x-space reconstruction, the point spread function (PSF) that defines the spatial resolution of MPI is simply the derivative of the M–H curve. One can analytically solve for the full-width-half-maximum (FWHM), which is the standard Houston resolution criterion (Houston 1927). If the effects of magnetic relaxation are neglected, the 1D spatial resolution of MPI, for both system matrix (Rahmer et al 2009) and x-space MPI reconstruction (Goodwill and Conolly 2010), is

where G is the gradient strength in T/( m). This equation shows that MPI spatial resolution should improve cubically with increasing magnetic core diameter. Because resolution only scales linearly with gradient strength G, we are limited by cost, power and cooling constraints when improving MPI spatial resolution with stronger gradients (above 5 T/(
 m)). The relationship of spatial resolution to core diameter and gradient strength is shown in figure 1. The gradient strength is also constrained by human safety limits, magnetostimulation and SAR limitations (Saritas et al 2013b). Hence, it is enormously important to investigate the limits of the resolution improvement by increasing magnetic core diameter, and this will be even more important for scaling up to a human MPI scanners.
There have been numerous works on modeling the MPI nanoparticle response (García-Palacios et al 1998, Weizenecker et al 2010, 2012, Graeser et al 2015). Weizenecker et al modeled the effect of anisotropy and frequency on the MPI performance for 20, 25, 30 nm particles. The study noted that high levels of anisotropy reduced the MPI performance to worse than the Langevin model prediction. Graeser et al extended the Weizenecker model for 30 nm particles and showed how proper superimposition of shape semi-axis and the crystal axes during particle synthesis can give optimal MPI performance. Other research groups (Croft et al 2012, 2016, Deissler et al 2014, Deissler and Martens 2015, Dieckhoff et al 2016, Dhavalikar et al 2016) have also modeled how MPI spatial resolution varies with NP size, and with drive field frequency and amplitude. In general, all these studies have noted that larger SPIOs have longer magnetic relaxation times. While there are a multitude of models concerning the exact physical causes of magnetic relaxation, from an imaging perspective we are most concerned about time-delays and spreading of the MPI signal that will directly impact the reconstructed image. As such, we will define magnetic relaxation using the most general definition: the non-instantaneous response of the ensemble magnetization to the applied field (Croft et al 2012). The general Néel and Brownian time constants involved in magnetic relaxation can be written as follows:

where N(H) and B(H) are functions that account for the effect of applied field, H, on the time constants.
These equations show that both relaxation mechanisms have longer time constants when the nanoparticle grows larger. When these relaxation times approach the period of the excitation waveform, a noticeable blurring effect results that reduces achievable resolution. Hence, larger NPs should improve resolution, but relaxation-induced blurring of larger NPs may obviate the improvements in spatial resolution. Here, we expand upon prior modeling work (listed above) by performing the first experimental study (see figure 2 for MPI hardware used) on the MPI imaging performance of nanoparticles across a wide range of core sizes from 18 to 32 nm. By observing these two opposing effects in practice, we determine the practical limits to improving MPI spatial resolution by increasing core size.

Figure 1. (a) Calculated Langevin curves (using equation (3)) for different nanoparticle core sizes. The shape of the curves show a dramatic change with nanoparticle core size due to the cubic relationship between nanoparticle core size and saturation field. (b) Calculated MPI steady-state PSFs show a dramatic narrowing with increased core size. This is in contrast to the strategy of increasing MPI gradient strength shown in (c) where only a linear improvement of the PSF width is observed with increases in gradient strength. Because spatial encoding in MPI is a linear function of the magnetic field gradient, conversion between x-axis units of applied field (mT/ ) and distance (mm) is done simply by dividing by the gradient strength (T/
 m).
m).
Download figure:
Standard image High-resolution image
Figure 2. MPI hardware. (a) Magnetic particle relaxometer used to obtain point spread functions of SPIOs to measure the full-width-at-half-maximum spatial resolution. (b) Magnetic particle imager used to obtain images of SPIOs to validate the measurements of the relaxometer as well as provide visual images of the differences in spatial resolution as core size changes. (c) MPI obtains an image by rastering the field-free-point across the field of view as shown in the figure. The field-free-point can be considered a sensitive detection point in 3D space. In x-space reconstruction, the time-domain received voltage signal is gridded to the instantaneous location of the field-free-point to make an image.
Download figure:
Standard image High-resolution image2. Materials and methods
2.1. Magnetic nanoparticles
Imagion Biosystems PrecisionMRX® SPIO nanoparticles (Imagion Biosystems, Inc. Albuquerque, NM, USA) with carboxylic acid coated outer shell and varying core diameters were used. The core is single crystalline magnetite ( ) for all core sizes. This is experimentally confirmed by prior work (Vreeland et al 2015) with high resolution transmission electron microscopy and x-ray diffraction. A representative data sample is found in the supplementary information of this reference. The nanoparticle shape and hence the shape anisotropy remains approximately uniform and does not change significantly with core size. This is evidenced by the TEM (JEOL 1200EX) images in figure 3(a) showing uniform spherical shape across all core sizes. The high isoperimetric quotients tabulated in figure 3(b) show that the deviation from an ideal sphere with increasing core size is very low.

Figure 3. (a) Table of nanoparticle properties and experimental measurements (b) TEM of Imagion Biosystems PrecisionMRX® SPIOs showing narrow size variation and constant spherical shape as evidenced by the isoperimetric quotients (thus implying constant shape anisotropy). A representative M versus H plot ( ) is also plotted. See section 2.1 for more details.
Download figure:
Standard image High-resolution imageTo determine the particle core size distribution, synthesized nanoparticles were analyzed using small angle x-ray scattering (SAXS) with a Rigaku SmartLab diffractometer system and SmartLab Guidance system control software. Data analysis was performed using Rigaku NANO-Solver v3.5 software that uses a spherical particle shape with a Gaussian size distribution. The spherical shape assumption was experimentally confirmed by TEM analysis (see figure 3(b)). Statistically, SAXS is a more rigorous technique for measuring size distribution because it is possible to measure a large ensemble of particles with SAXS while TEM image analysis is practically limited to 100–1000 particles.
All SPIOs have same outer coating material and differ only in the magnetic core size. The core is covered by an inner monolayer of oleic acid coating and then encapsulated within a monolayer of a carboxylic acid functionalized amphiphilic polymer. The hydrodynamic diameter and zeta potential of all SPIOs was measured in deionized water pH 6.0 using a Malvern Zetasizer Nano ZS system. The zeta potentials of all SPIOs ranged between −40 and −50 mV. Hydrodynamic diameter scales with core size as described in figure 3(a). This scaling is necessary to maintain a large enough coating buffer to prevent inter-particle aggregation.
Magnetization measurements were collected using a Quantum Design MPMS-7 SQUID magnetometer. The precise mass of iron in the sample was determined using a colorimetric assay as described previously (Vreeland et al 2015). Magnetization curves were recorded from −4000 to +4000 kA m−1 at 293 K. The field-dependent magnetization data was normalized to the mass of iron in the sample to determine the saturation magnetization ( ). The measured saturation magnetization is
  which is
  of the bulk magnetite value of
  (Cullity and Graham 2011). A representative M versus H magnetization plot (25.0 nm particles) is also plotted in figure 3(b). The exact synthesis and more characterization of the nanoparticles can be found in detail in the main article and supplementary information of (Vreeland et al 2015). The MPI performance of the SPIOs was also measured using a magnetic particle spectrometer/relaxometer described in (Tay et al 2016) as well as the x-space MPI scanner described in (Croft et al 2016). Unless otherwise stated, all experimental measurements employed
  SPIOs at 5 mg Fe ml−1.
2.2. Magnetic particle relaxometer experiments
The SPIOs of different core sizes were first tested on our arbitrary waveform relaxometer (AWR) which is described in detail in our prior work (Tay et al 2015, 2016). The AWR includes a non-resonant transmit coil design to enable frequency agility as well as arbitrary excitation waveforms This table-top system does not have gradient fields for signal localization; instead, a sinusoidal excitation and linear bias field are superimposed to test the aggregate response of a sample in the applied magnetic field space. This system can reconstruct a 1D point-spread function (PSF) characteristic of the entire sample supplied to the device. To interrogate the entire Langevin M–H curve and even up to the saturation regions of the SPIOs, we scan with the background (bias) field slowly decreasing from 60 to −60 mT across 0.2 s. We have demonstrated the AWR measured 1D PSFs agree with 1D PSFs obtained using our gradient-based imaging systems (Tay et al 2016). To translate the AWR PSF to a true imaging PSF, we only need to divide the DC field by the gradient strength. Reconstruction uses the middle 60% of the time-domain signal within a half-period, centered about the sinusoidal zero-crossing in order to maximize SNR. The 60% value is chosen to be similar to that used in the Berkeley 3D Magnetic Particle Imager. For figure 4, the drive waveform is a 20.25 kHz, 20 mT sine wave to match the drive field of the 3D imaging scanner used. For figure 7, the drive frequency and amplitude are as specified in the figure.

Figure 4. (a) Experimental 1D point spread functions of Imagion Biosystems PrecisionMRX®SPIOs measured on the magnetic particle relaxometer at 20.25 kHz and 20 mT/ . The PSF narrows as core size increases from 18 to 24 nm, but stops narrowing and starts widening beyond 25 nm. This shift is concomitant with a marked displacement of the PSF in the direction of the scan which is similar to that seen in prior work on MPI relaxation (Croft et al 2012, 2016), suggesting a marked increase in magnetic relaxation processes. Data is represented by the smooth solid lines while the markers are just a visual guide to differentiate the curves. (b) Comparison of the experimentally achieved spatial resolution (n = 3) with the predicted spatial resolution from the Langevin model shows an increasing disparity with increasing core size after 24.4 nm.
Download figure:
Standard image High-resolution image2.3. Magnetic particle imager experiments
To verify the findings from the relaxometer experiments, we imaged a point source phantom by lining up 5 tubes (ID 0.7 mm, OD 1.3 mm) with  of 5 mg ml−1 SPIO inside each as shown in figure 5. We used our 3D MPI scanner with a 7 T/(
 m) FFP selection field, comprised of permanent magnet pair. An MPI image is formed by rastering the sensitive field-free-point (FFP) across the entire FOV and gridding the received voltage in an inductive pick-up coil to the instantaneous FFP position. The FFP is shifted by electromagnetic shift coils in the x and y directions and by the drive coil in z. A robot arm moves the sample in discrete steps in z to compensate for limited amplitude of the transmit coil. The scanning setup is shown in figure 2(c), where the green trajectory represents the FFP location in a y-plane. A homogeneous transmit solenoid adds a 20.25 kHz, 20 mT sine wave excitation along the z-axis, thus making the FFP zigzag (in the z-axis) as it moves along the green trajectory. This is done to sample the regions between the green trajectory lines. The magnetic field gradient is 7 T/(
 m) in the x-axis, and 3.5 T/(
 m) in the y- and z-axes. The field of view is
  and the total scan time is 9 min. Details on the 3D MPI scanner hardware and the image reconstruction algorithm have been published (Goodwill et al 2012a, Lu et al 2013, Saritas et al 2013a).
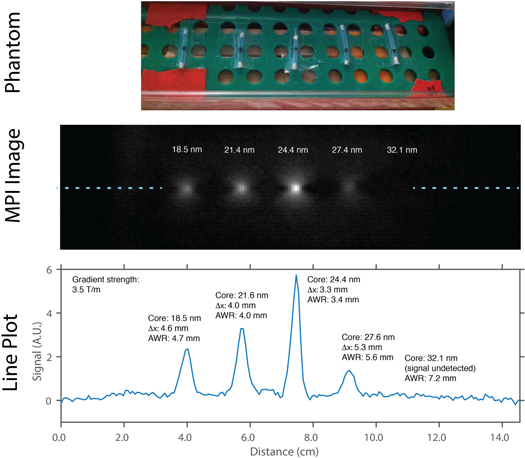
Figure 5. Magnetic particle Imager scan of point sources of different SPIO core sizes. The experimental imaging results have good agreement with the Relaxometer measurements, showing the same trend of optimal resolution with 24.4 nm SPIOs.
Download figure:
Standard image High-resolution image2.4. Calculation of langevin spatial resolution curves
In this paper, we use the Houston criterion for spatial resolution (Houston 1927) that uses the FWHM of the PSF or imaging point source. The Langevin spatial resolution (red) curves plotted in figures 4 and 7 was calculated using the equation (4) (Langevin model of an ensemble of ideal magnetic nanoparticles) where the gradient strength G is 3.5 T/( m) to match the Berkeley Magnetic Particle Imager gradient. We use the experimentally measured nanoparticle
  value of
  for these calculations. T is set as 293 K.
3. Results
3.1. Spatial resolution stops improving beyond 25 nm core diameter
The AWR was used to obtain 1D PSFs of Imagion Biosystems PrecisionMRX® nanoparticles with core diameters between 18 and 32 nm. The results in figure 3(a) show that while the PSF narrows when core diameter increases from 18 to 24 nm, this trend reverses after 25 nm. This is concomitant with an increasing displacement in the direction of the scan. This behavior is similar to results from prior work (Croft et al 2012, 2016) and is indicative of delay between the time-domain MPI signal and the applied field due to increasing magnetic relaxation. This results in blurring of the 1D PSF in the direction of the scan when the time-domain MPI signal is gridded to applied field values during reconstruction. As a result, the improved spatial resolution predicted by the steady-state Langevin PSF is not realized. The steady-state Langevin theory assumes the SPIOs instantaneously respond to the applied field. Figure 4(b) shows an increasing disparity between the Langevin model and the experimentally measured spatial resolution as core size increases. For example, the Langevin model predicts that 700 μm resolution is achievable with 32 nm SPIOs, while the experimental resolution achieved was around 7 mm, assuming a 3.5 T/( m) gradient.
3.2. Verification of trend with MPI imaging results
We confirmed our relaxometer measurement results with an imaging scan using the Berkeley MPI scanner. The images are shown in figure 5. The same trend of worsening resolution beyond 24.4 nm is observed and measurement of the FWHM from a line plot (blue dashed line) through the image are in good agreement with the AWR results. The 32.1 nm particles are not visible because the large relaxation time constants leads to very low induced signal in the MPI receive coil (MPI signal  ). 32.1 nm particles are visible in the relaxometer because a much larger volume (
 ) is used.
3.3. Magnetic relaxation limits improvement of spatial resolution
To verify that magnetic relaxation is the mechanism behind the limiting of spatial resolution as core size increases, the raw time-domain signal across a half-period of drive field was investigated. Any magnetic relaxation will cause a delay of the time-domain signal in the direction of the scan. In figure 6(a), while an increase in magnetic relaxation can be inferred from the slight delay of the peak going from 18.5 to 24.4 nm, the signal peak has an overall narrowing leading to overall better resolution. This suggests that the effect of Langevin physics dominates over magnetic relaxation in this range of core sizes.

Figure 6. Trace of the experimental time-domain MPI signal. Data is represented by the smooth solid lines while the markers are just a visual guide to differentiate the curves. (a) From 18.5 to 24.4 nm, a slight increase in delay is seen in the peaks of each subsequent trace. This is indicative of magnetic relaxation processes increasing in magnitude. However, this effect is surpassed by the narrowing of the signal peak by Langevin physics. Thus, the narrowest peak and best resolution is seen at 24.4 nm. (b) From 24.4 to 32.1 nm however, magnetic relaxation increases dramatically as evidenced by the very large time delay (phase delay of almost 40°) of the 27.4 and 32.1 nm signal peaks. This is indicative of strong magnetic relaxation processes that clearly dominate the expected peak narrowing from Langevin physics. As a result, the signal peak is spread out and worse resolution occurs when going from 24.4 to 32.1 nm.
Download figure:
Standard image High-resolution imageFrom 24.4 to 32.1 nm, however, there is a dramatic increase in peak delay (figure 6(b)). The signal is delayed by  and is spread out across almost twice the time as 24.4 nm. These results show that magnetic relaxation is dramatically more significant beyond 24.4 nm and clearly dominates over Langevin physics.
The raw MPI time-domain data shown here also provides an intuitive explanation of worsening resolution. Since the signal is spread out over more time for 27.4 and 32.1 nm, the signal is associated with more voxels in x-space reconstruction because signal(t) is directly gridded to the voxels that the FFP bypassed in that time. Similarly, for system matrix reconstruction, a spread-out signal peak corresponds to a steeper decay in the magnetic particle spectrometry spectra and thus a more poorly conditioned system matrix during image reconstruction.
3.4. Strategies for mitigation of magnetic relaxation do not work fully
Prior work has demonstrated that the MPI drive waveform significantly affects the MPI performance of SPIOs (Kuhlmann et al 2015, Croft et al 2016). Here, we investigate if low amplitude and low frequency approaches can help mitigate magnetic relaxation and achieve the Langevin model spatial resolution. For the low amplitude approach, the frequency was kept constant at the original 20.25 kHz while amplitudes of 20.0, 4.0 and 0.5 mT/ were used. For the low frequency approach, the amplitude was maintained at the original 20 mT/
 while frequencies of 20.25, 2.0 and 0.4 kHz were used.
The results show that low amplitude approaches do not work well at larger core sizes. This can be attributed to the strong field strength dependence of Néel and Brownian time constants as described in equation (5) and (Deissler et al 2014, Dieckhoff et al 2016), where the smaller AC drive amplitudes mean that the time constants remain relatively large throughout the entire AC period. In contrast, low frequency approaches work better at larger core sizes. The spatial resolution minima of the curve is shifted to 27.4 nm at 0.4 kHz and there is significantly improved spatial resolution by almost 2-fold from the optimal resolution at 20 kHz curve. This can be attributed to the fact that the temporal blurring has a lower impact on the time-domain raw MPI signal shape when the drive waveform period is longer, which in turn results in less blurring during image reconstruction as shown by Croft et al (2016). Overall, while both approaches help mitigate magnetic relaxation and improve spatial resolution, the general trend of worsening spatial resolution beyond 27.4 nm still remains. Notably, the fact that low frequency approaches work well at core sizes past the minima of the 20 kHz curve while low amplitude approaches do not (relaxation time constants are longer at low fields) lends further credence to the idea that increasing magnetic relaxation from larger core sizes is the main cause of worsening spatial resolution. In essence, these results suggest that magnetic relaxation is a significant spatial resolution barrier that is not easily resolved by current approaches.
Discussion
As shown in figure 1, the ideal steady-state Langevin model for an ensemble of nanoparticles predicts a highly desirable cubic improvement in MPI resolution with core size (Rahmer et al 2009, Goodwill and Conolly 2010). However, in practice, relaxation-induced blurring of the MPI signal also occurs and is known to also increase with core size as described in equation (5). Blurring of the MPI image by magnetic relaxation (Néel and/or Brownian mechanisms) is a well-known phenomenon that has been shown in prior work for both system matrix (Schmidt et al 2015) and x-space reconstruction approaches (Croft et al 2012, 2016). Our key result, shown in figure 4, is the first experimental study of SPIOs in aqueous solvent showing the interplay of these two effects resulting in optimal resolution being achieved at 24.4 nm core size, with worsening resolution beyond 24.4 nm. We presented experimental evidence that the resolution improving effect of the ideal Langevin model for an ensemble of particles is increasingly mitigated and dominated by relaxation-induced blurring. For example, in figure 6(a), it can be observed there is an increase in time-delay of the MPI signal as core size increases from 18.5 to 24.4 nm indicating an increasing delay in ensemble magnetization (magnetic relaxation). Notably, the signal response is still narrower in time for 24.4 nm, suggesting that both the resolution improvement from the Langevin model and relaxation-induced blurring are affecting the MPI signal.
While magnetic core size is a major factor in influencing the Néel and Brownian relaxation time constants as described in equation (5), there are other factors that may affect these time constants and therefore the MPI resolution. One possible factor is the shape anisotropy constant. While the particles used in this study are all spherical, larger core sizes are slightly less so (see figure 3(a)). However, the maximum shape anisotropy calculated from this factor is  which is only a small fraction (
 ) compared to the magnetocrystalline anisotropy. Equations (10) and (11) of Graeser et al (2015) and magnetocrystalline anisotropy of magnetite
  was used. Therefore, the increase in shape anisotropy contributes only minimally and cannot be solely responsible for the two-fold worsening of spatial resolution between 24.4 and 32.1 nm particles.
Another possible factor is the changing hydrodynamic sizes between different core sizes (see figure 3(a)). Hydrodynamic size has a large impact on the Brownian relaxation time constant but is does not affect the Néel relaxation time constant (equation (5)). While there is a poor correlation between the measured hydrodynamic size and measured MPI resolution for the 18.5–24.4 nm range of particles, the correlation is better for the 24.4–32.1 nm range of particles. The results suggests that the impact of hydrodynamic size on MPI resolution is modulated by the relative dominance of Néel and Brownian relaxation mechanisms which in turn is most dependent on magnetic core size due to the exponential dependence of the Néel time constant on the magnetic core volume. While it is possible that hydrodynamic size contributes towards the worsening resolution going from 24.4 to 32.1 nm and that better resolution could be obtained with very thin coatings, in practice, a minimum coating thickness is required in synthesis for successful phase transfer as well as to prevent spontaneous aggregation of nanoparticles.
Yet another factor to consider is the width of the particle size distribution. From Knopp et al (2011), there is less than a two-fold improvement in resolution of the normalized convolution kernel between a 15 nm monosized ensemble and a polysized ensemble (lognormal with 16.4 nm mean with 4 nm standard deviation). For the particles used in this study, the standard deviation is constant at 1.5 nm and only increases to 2.1 and 2.2 nm at 27.6 nm and 32.1 nm core sizes respectively (see figure 3(a)). The variation in size distribution for this study is thus much lower than that shown by Knopp et al, and therefore this factor can be considered to contribute only minimally to the spatial resolution trend measured in this study.
The results of our study show that with current typical MPI imagers operating around 20 kHz and 20 mT drive amplitude, spatial resolution on a typical 7 T/( m) gradient is limited to about 1.5 mm. For preclinical applications, this spatial resolution is not ideal. This is especially so for smaller rodents such as mice and also when investigating disease models of the vasculature. This resolution challenge of MPI is valid with both methods of reconstructing the MPI image. For example, Weizenecker and Rahmer's 2009 landmark paper on the system matrix (Rahmer et al 2009) noted that while a 5.5 T/(
 m) gradient and dominant particle diameter of 30 nm theoretically allows a resolution better than 0.5 mm, experimentally, due to the wide distribution of particle sizes and the regularization applied in reconstruction to mitigate limited SNR, the observed resolution was not better than 1.5 mm.
Many approaches have been taken to improve the spatial resolution of MPI. One approach is to increase the gradient strength of the MPI imager (Goodwill et al 2015, Vogel et al 2015, Yu et al 2015). Gradients of up to 7 T/( m) have been achieved on murine scanners at Berkeley (Yu et al 2015, Goodwill et al 2015). Notably, Vogel et al (2015) achieved a gradient strength of 85 T/(
 m) which will theoretically achieve 29 μm resolution with a 30 nm magnetite core particle (assuming instantaneous relaxation). However, the bore size of the device is very small ( 6 mm diameter) and cannot fit small animals. Such high gradients for a small animal-sized bore would require superconducting magnets, with increased cost and complexity. In addition, the high gradients imply that the rate of scanning across the entire FOV will have to be proportionally slowed down due to obey magnetostimulation and SAR safety limits (Saritas et al 2013b). Finally, as demonstrated in figure 1, like MRI, the spatial resolution of MPI improves only linearly with increasing gradient strength.
Deconvolution approaches could potentially obtain significant spatial resolution improvements. However, our knowledge of the in vivo PSF and relaxation behavior is imperfect, and also the conditioning of the computation could damage final SNR, especially with relaxation-induced blurring of the MPI signal. The fundamental SNR versus resolution tradeoffs with sophisticated deconvolution algorithms has been studied specifically for MPI by Knopp et al (2011) and in general by Shahram and Milanfar (2004).
Other approaches include optimizing the drive waveform to mitigate the blurring effects of magnetic relaxation. Notably, low amplitude or low frequency approaches have been investigated before (Murase et al 2014, Shah et al 2014, Kuhlmann et al 2015, Croft et al 2016). In our study, we tested out these strategies on our range of magnetic core sizes. Unfortunately, while some improvement in spatial resolution was observed, figure 7 shows that neither approach is able to fully mitigate the blurring from magnetic relaxation in order to achieve the theoretical Langevin spatial resolution for larger core sizes. Very low frequencies ( Hz) could show promise for MPI, but MPI uses an inductive pick-up coil today, so SNR will be reduced. SQUID detectors have SNR independent of frequency, so they may mitigate this challenge.

Figure 7. Low amplitude and low frequency drive waveform strategies have been shown in prior work to reduce the negative impact of magnetic relaxation (Kuhlmann et al 2015, Croft et al 2016). Both approaches were tested separately (n = 3, error bars are small and within the shape markers). (a) In the low amplitude approach, frequency is held constant at 20.25 kHz and amplitudes of 20.0, 4.0 and 0.5 mT/ were used. (b) The low frequency approach keeps amplitude constant at 20 mT/
 while frequencies of 20.25, 2.0 and 0.4 kHz were used. While both strategies help achieve better spatial resolution overall, spatial resolution still stops improving after a certain core size. These strategies are unable to fully mitigate the negative impact of the large amount of relaxation seen by larger core size particles and are unable to achieve the cubic spatial resolution improvements predicted by the Langevin model.
Download figure:
Standard image High-resolution image
Perhaps the most promising approach is to optimize novel magnetic nanoparticle tracers for great resolution and minimal relaxation-induced blurring (Ferguson et al 2009, 2010, 2012, Hufschmid et al 2015). Here, the nanoparticle synthesis will involve attention to particle phase purity. Furthermore, as Weizenecker et al (2012) has shown, optimizing the particle anisotropy can prove valuable. In addition, Graeser et al (2015) has shown that superimposing of shape semi-axis and crystal axes during crystal growth can improve the MPI performance. For very large core sizes, because the Néel time constant is larger than Brownian time constant for low applied fields (Deissler et al 2014), Brownian relaxation will be dominant. Hence, tailored SPIOs with the smallest hydrodynamic radius possible while still maintaining a thick enough coating to prevent aggregation may also show resolution improvements.
Conclusions
In this study, we perform the first experimental study on the interplay of Langevin steady-state physics and magnetic relaxation as particle core size is increased and measure its effects on MPI spatial resolution. The experimental results show that magnetic relaxation limits the optimal core size of MPI nanoparticle tracers to ∼25 nm. We experimentally observe a significant disparity, consistent with trends from prior modeling work, between the resolution predicted by the steady-state Langevin physics model and that achieved experimentally for SPIOs with core size larger than 25 nm. For example, the steady-state Langevin predicts ∼600 μm resolution with a 3.5 T/( m) gradient and 32 nm SPIO, but experimentally ∼7 mm resolution is achieved. This spatial resolution disparity remains even after optimizing the drive waveform to reduce the impact of relaxation-induced blurring, suggesting that magnetic relaxation is a potent and unresolved barrier to unlocking the potential of large core size particles. We hope that in the near future, MPI researchers will invent new methods to overcome magnetic relaxation-induced blurring for larger core sizes. This will allow us to unlock the highly desirable cubic improvement of MPI spatial resolution with nanoparticle core size.
Acknowledgments
We are grateful for funding support from the Keck Foundation Grant 009323, NIH 1R01EB019458, NIH 1R24MH106053, and the UC Discovery Grant. This work was performed, in part, at the Center for Integrated Nanotechnologies, an Office of Science User Facility operated for the US Department of Energy (DOE) Office of Science by Los Alamos National Laboratory (Contract DE-AC52-06NA25396) and Sandia National Laboratories (Contract DE-AC04-94AL85000). Z W Tay is supported by a fellowship from the Agency of Science, Technology and Research (Singapore).