
Abstract
In opening this duology, we present a physicochemical model of the evolution of malignant tumors (carcinomas) into metastases. The continuum-theoretic model, congruent with recent experimental evidence, analyzes the plausibility of neoplasia-induced cavitation or tensile yielding of the tumoral basement membrane (BM) to activate cancer invasion and metastasis. Normal BMs are semicrystalline sheets, ca 0.1–30 μm-thick, and ca 500–1000× stiffer than the epithelial cells they ensheath. A specialized form of extra-cellular matrix (ECM), BMs are, however, distinctly constituted of tri-continuous networks of collagen-IV, laminin, and aqueous interstitial fluid with connector proteins; e.g. nidogens and perlecans. At the outset, we posit by physical analogy and inductive reasoning that a malignant tumor grows in size until reaching a threshold determined by its mechanochemical state vis-à-vis its microenvironment. This threshold is equated to the cavitation of a pathologically-softened (e.g. proteolyzed) BM that encapsulates the growing neoplasm. We test this postulate by constructing a tumor spheroid prototype consisting of normal and cancer cells that grows radially via the influx of water and nutrients while being constrained by the BM and the adhesome, chiefly cadherins and integrins. Next, we formulate a coupled continuum model based on the mechanics of fluid-solid interactions, exergy-dependent mechano-damped Monod kinetics for cell proliferation and apoptosis and the cellular bioenergetics of glucose–lactate symbiotic metabolism incorporating empirical data alone as parameters. Exergy is the available energy as adenosine triphosphate (ATP) molecules. This nonlinear 'mechano-metabolomics' model, where the tumor and the BM represent a mutually-interacting composite, is computationally solved via Comsol® equation-based modeling routines to simulate realistic tumor growth dynamics and the elasto-plastic deformation of the BM. Our computations indicate the plausibility of BM cavitation and suggest epithelial-to-mesenchymal transitions (EMT) and/or invadopoiesis as corollaries, ostensibly due to stress-localized ruptures of the adhesome and the mechano-chemotactic flow of detached tumor cell(s) through the widening 'nanovoid'.
Export citation and abstract BibTeX RIS
Introduction
To date, a great deal of scientific research on cancer has focused on approaches based on genomics and proteomics. However, the influence of biophysics, such as the effects of mechanotransduction on physiological processes such as homeostasis, morphogenesis and cell proliferation, among others, have been less understood. Mechanotransduction—mechanisms by which cells respond to physical force fields in their microenvironment and utilize such mechanical (or electromagnetic) stimuli to alter their biomolecular signaling pathways—has attracted much interest of late. In this duology [1], we study these phenomena in the context of physicochemical biodynamics, or the dynamics of biotic (living) systems from a physics–chemistry perspective, applying them to oncogenesis (or carcinogenesis), specifically, the growth of malignant tumors or neoplasms, followed by the initiation of cancer cell invasion into the stroma, or equivalently, early metastasis.
In a recent review of note, Mierke [2] listed eight well-studied hallmarks of cancer as (i) sustained proliferation signaling, (ii) evading growth suppressors, (iii) avoiding immune destruction, (iv) activating invasion and metastasis, (v) enabling reciprocal immortality, (vi) inducing angiogenesis, (vii) resisting cell death, and (viii) dysregulating cellular energetics, while identifying a ninth, recently-recognized hallmark as (ix) the primary tumor and tumor microenvironment alter survival conditions and the phenotype (cellular properties) of a certain set of cancer cells, which then favor selection of the aggressive subtype of cancer cells. Our research envisages a prototype wherein many of these hallmarks are incorporated, directly or indirectly, and analyzed via classical continuum mechanics and biochemical kinetics theories. In another noted review, Wirtz et al [3] elucidated the role of physical interactions and mechanical forces between cells and the matrix (and the microenvironment, in general) in the metastatic cascade that occurs during the progression of cancer. They stated the importance of specific protein down-regulation and up-regulation on cell adhesions and the strength of the basement membrane (BM), respectively. Chief among these were the decrease of E-cadherins and cytokeratins that facilitate intercellular adhesion/signaling and normal cytoskeletal properties (cuboidal epithelial morphology), respectively, and the concomitant increase of matrix metalloproteinases (MMP) and N-cadherins that degrade the BM and enhance cell motility, respectively. The BM encapsulates the tumor and is rich in collagen IV and laminin, the nanostructure of which is described below, while the extra-cellular matrix (ECM) is rich in collagen I and fibronectin. They also pointed out that the stiffness increase of the ECM correlated directly with tumor initiation at an adjacent site, growth, and metastasis in breast cancers and possibly other cancers as well. Cancer cells also typically appear viscoelastically softer and more 'frayed' or fractal than their normal cell counterparts. Discernibly, greater compliance [4] and fractality [5] correlate with higher metastatic potential (i.e. aggressiveness).
Architecturally different from the ECM, the function of the BM to compartmentalize tissues and demarcate tumor microenvironments has been known for several decades. However, only of late have researchers become pointedly aware that the cellular breach or transmigration of a pathological membrane is characteristic of the early stages of invasive carcinomas [6–8]. As elucidated in Kelley et al's cornerstone review [6], cancer cells seem to employ diverse strategies or mechanisms to breach the various kinds of tissue-specific BMs on their metastatic route. Broadly classifying BMs into epithelial and endothelial types, which correspond to tumoral and vascular BMs, respectively, they compiled recent in vivo experimental observations with provisional mechanisms on the BM breach from several sources. They identified (i) 'BM-burrowing' invadopodia, (ii) tissue growth-induced mechanical rupture of the BM, (iii) scarce network linkers, and (iv) penetration into poorly-formed, pre-existing sites or 'gates', besides the conventionally-accepted notion of (v) proteolytic degradation as salient strategies, which are ostensibly diverse phenomena but not mutually exclusive in occurrence, and can occur in any chronological order during metastasis. They further stated that the ca 600 million-year evolutionary history of BMs, concurrent with multicellularity, lends further credence to such diversity. Thus, cancer cells may breach a tumoral BM via a mechanism disparate from one they may employ to breach a vascular BM during intravasation further downstream their metastatic route. The argument is not unlike another natural phenomenon familiar to many, viz., the flooding of homes during a torrential rainstorm, say, in a low-lying town located near a dammed river or lake—the pressure in the swelling river or lake breaches or causes a tensile failure of the dam levees, while further downstream, flood waters seep through the soil and permeate smaller, pre-existing cracks in the foundation walls of homes to ultimately enter them.
In light of recent discoveries in a different discipline of research viz., abiotic polymer membrane science, where the evolution of asymmetric polymer gel membrane microstructures was imaged using time-sectioning cryogenic scanning electron microscopy (cryo-SEM) and a hypothesis on fundamental evolutionary mechanisms proposed [9] and independently verified [10], we reason via induction and analogy, that the perspective and critical insights gleaned therefrom are plausibly applicable to understanding the physics of tumor growth, epithelial-to-mesenchymal transitions (EMT), and cancer invasion (special-to-general-to-special case). The aforementioned hypothesis on microstructures describes the occurrence of a unique 'fluid-solid network instability' during polymer membrane formation. This is triggered by osmotic swelling followed by compressive pressure build-up in the pores and subsequent tensile ruptures and stress localizations in the solid phase of the gel network to form voids larger than the nearby pores. This phenomenon also has commonalities with the well-studied 'catastrophic failure' in solid structures. We believe that this mechanical instability serves as an exemplar and has major implications in understanding the onset of cancer invasion. The logical and mathematical bases with several rigorous examples of such plausible reasoning from induction and analogy were elegantly discussed in Polya's eponymous treatises, distinguishing it from demonstrative reasoning, which is deductive [11–13]. Thus intuited and also through gathered evidence from murine embryogenesis and human mammary carcinomas [7, 8], we conjecture that the onset of cancer invasion and metastasis can be viewed as spatio-temporally concurrent with the tensile yielding or cavitation of a pathologically-softened BM followed by alternating stress localizations and tensile ruptures of cell–cell and cell–matrix adhesive links (biomolecular bridges) within the growing tumor or neoplasm, approximately along the same radial coordinate. We further suggest that such a mechanochemical or 'mechanogenetic' instability, if true, may also switch compressive (push) to tensile (pull) strains along the cell adhesion–transduction molecule (CAM) bridges such as cadherins and integrins that could impart invasiveness to the cellular phenotype via mechanotransduction [8]. Throughout this duology, the term 'stress' exclusively refers to mechanical stress (Cauchy) and not biological stress that refers to survival threats.
The causal chain that leads to the above conjecture to be tested in this computational research may be stated as follows: rapid, uncontrolled cancer cell proliferation or neoplasia is a derived hallmark of cancer (first postulate); ATP-fueled neoplasia causes the net growth of the malignant tumor, or stated another way, cell proliferation exceeds apoptosis; tumor growth implies an increase in its volume or swelling due to the net imbibition or influx of water—an incompressible liquid—and nutrients from the surrounding ECM, which has also been experimentally observed via positron emission tomography (PET) scans on patients with cancer; the tumor pressure builds up due to constrained growth; BM tension becomes inevitable and can rise significantly until the yield point is reached; cavitation or tensile yielding of the BM follows; and, finally, peripheral cells breach the BM through the widening nanovoid(s) and invade the stroma (figure 1). We believe that the afore-described prototype of tumor growth, BM cavitation, and cell invasion is likely to provide a sound conceptual framework toward understanding the fundamental biophysical and histological mechanisms that underlie cancer invasion and metastasis. To determine and demonstrate the veracity of the stated conjecture italicized above, and in light of the lack of direct experimental evidence, we developed a theoretical (multiphysics) continuum model based on the applied mechanics of fluid-solid interactions, biochemical cell growth kinetics, and cellular bioenergetics in the context of metabolic symbiosis that involves aerobic glycolysis and lactate exchange. We explored the macro-scale inter-relationships between biomechanical–biochemical properties and tumor growth dynamics, spatio-temporal cell densities and exergy (ATP) generation gradients, and mechanical stress–strain fields within the tumor and BM, and analyzed the sensitivities of the dynamics to parametric and functional variations. In the second paper of the duology, we simulated the dynamics of tumor-membrane systems with normal and pathologically-softened (e.g. proteolyzed) membranes to further demonstrate the plausibility of the aforementioned conjecture and to interpret the simulations in the context of dissipative structures theory, which is a synthesis of far-from-equilibrium thermodynamics and dynamical systems theories of physics.

Figure 1. Schematic shows the conjectured (or abductively-reasoned) cavitation or tensile yielding of a stretched, pathological basement membrane during tumorigenic homeorhesis followed by the mechanical instability of the adhesome network. Homeorhesis is defined herein as the evolution or transformation of a biotic system from one homeostatic steady state to another, while 'tumorigenic' specifically refers to tumor (neoplastic) growth. We posit that the neoplastic or neoplasia-induced cavitation of the BM activates cancer invasion into the stroma. Then, we develop a theoretical model based on macroscopic mechano-metabolomics to verify this postulate via methods of inductive reasoning and plausible inference.
Download figure:
Standard image High-resolution imageAs a corollary to the above conjecture and a possible topic for future investigations, invadopoiesis may be related to the pressure increase within the tumor and the accompanying transmembrane pressure gradient between the intratumoral and extratumoral (stromal) regions. This may occur via a mechanical instability of the cell membrane, pressure-induced precipitation of the F-actin cytoskeleton at the invadopodium tip, electrochemical gradients, or a combination of these, among other reasons. Such pressure or nutrient gradients (mechano-chemotaxis) may also facilitate intravasation via invadopodia at the aforementioned pre-existing sites on blood vessels.
Physicochemical tumorigenesis
In the following paragraphs, we construct a biological prototype for theoretical analysis based on recent research on the structure (microanatomy) and dysfunctional attributes (pathophysiology) of tumors and their stromal microenvironment. Such a prototype—a spheroid consisting of an interlinked cluster of cells, both normal and cancerous in varying proportions, and encapsulated by the BM—helps visualize the similitude of microstructural and spatio-temporal stress evolution vis-à-vis the aforementioned polymer membrane network instability. We describe the nanostructure of the BM and classify the various CAMs that serve as links between the clustered cells within the tumor. Next, we develop a mathematical model, approximating the above molecular-level description to a continuum model using fluid-solid interaction mechanics and Monod-type, force-responsive cell proliferation kinetics. Mechanical stresses arise within the tumor due to volumetric constraints imposed by a 1000-fold stiffer and stronger BM, while diffusion-limited concentration gradients of various substrates metabolized by the cells affect their proliferation and death rates via cellular energetics; i.e. the generation of adenosine triphosphate (ATP). Thereon, we present results from computational finite element analyses of the coupled, nonlinear partial differential equations using Comsol Multiphysics® software to demonstrate the functionality of the computational approach and analyze its sensitivity to parametric variation, and to establish the groundwork for plausible or inductive reasoning and inference that is further constructed upon in the subsequent article. The term 'exergy' is also defined therein in the context of non-equilibrium thermodynamics, and, hence, it suffices to recognize here that exergy is equivalent to the ATP generated via the catabolic breakdown of glucose and lactate metabolites.
Biomolecular phenomenology of tumor growth—a nanoscale prototype
Pioneering discoveries in molecular and cell biology since the 1950s led Alberts [14] to propose a paradigm shift in 1998—from formerly viewing the cell as a 'chemical reactor' to a 'factory of biomolecular nanomachines' that perform highly specialized and coordinated tasks. Dynamic association/dissociation (binding/unbinding, and folding/unfolding) of biomolecules and the assembly/disassembly of supramolecular structures (e.g. tertiary or quaternary protein or DNA structures) are among the fundamental non-equilibrium processes performed within and between cells and their microenvironments during the lifetime of an organism. Such processes are critical for structural integrity of tissues and participate in the signal transduction cascades that underlie cellular functions and intercellular communication. Binding can be seen as an intermolecular association or bond—covalent or non-covalent—in a physicochemical force or energy field in that it has equivalent physical and chemical aspects; i.e. perceivable as multi-molecule, multi-site, dynamic biophysical interactions, or as biochemical reactions that involve transformations of molecular or supramolecular identities, respectively. Such a syncretic perspective aids to elucidate concepts in mechanochemistry and the multi-scale approaches used to compute and interpret our results.
The basement membrane—nanostructure and function
The BM is a thin, asymmetric, elasto-plastic, hierarchically-nanostructured, semi-crystalline, biomechanically stiff and strong, highly cross-linked, semi-permeable, hydrogel-like sheet present in most tissues and is critical to the physiology of multicellular organisms. It lines the exterior surfaces of epithelial tissues (basolateral side of cells), endothelial cells of blood vessels, regions of muscles, adipose and nerve tissues, and the inner surfaces of body cavities. Candiello et al [15] measured the thickness of a typical hydrated membrane as ca 1.5–4.0 μm via atomic force microscopy (AFM) ex vivo, whereas when dehydrated, it appeared as ca 0.4–1.0 μm-thick via transmission electron microscopy (TEM). These results suggest that the maximum volume fraction of 'solids' or the biopolymeric components, viz., the multi-protein networks of laminin and collagen IV as described below and water-binding proteoglycans, may be ca 25% in typical BMs, while the rest of the volume appears mostly as pore space filled with water and other biomolecules (i.e. the minimum volume fraction occupied by water or 'porosity' is ca 75%). This is only a first approximation based on simple volume conservation of the solids with the dehydrated state treated as dense in the mathematical limit. A measure of the pore size of the BM was ca 10 nm [16], and that of the apparent Young's (elastic) modulus ca 1.5–5 MPa in the hydrated state [15]. This is ca 1000 times greater than that of epithelial cell layers (0.1–4 kPa) and akin to that of articular cartilage. The thickness and strength of BMs vary with anatomical location and the age of the organism. In some cases, such as the ocular lens, the BM may be as thick as 30 μm [17]. The elastic modulus is a measure of a (bio)material's stiffness, or the force required to deform, which is different from strength and toughness, that are measures of the force and work (energy) required to fracture, respectively.
Nanostructurally, the BM appears to be comprised of two mutually overlapping, separately interconnected networks of biopolymers—one, chiefly of laminin anchored to the soft epithelial cells, and the other of collagen IV contacting the stiffer stroma (ECM) [18]. The networks are typically fluid-saturated (mainly water), and thus the membrane as a whole appears to consist of triply-interpenetrating multicursal (multiply-connected) labyrinths of laminin, collagen IV and water [19]. We refer to this as a tricontinuous structure. We must remind the reader that this nanostructure has been inferred from indirect experimental evidence and that direct evidence from powerful imaging techniques such as cryo-SEM is lacking and would offer clarity and confirmation. One of the aforementioned layers contacting the epithelia is referred to as lamina lucida and the other contacting the stroma as lamina densa. The term 'basal lamina' is mostly used synonymously with BM. BMs consist of ca 50 different proteins. However, collagen IV (nearly half of all BM proteins) followed by laminin are the most predominant as seen by their capacity to form macroscopic networks, while other proteins include nidogens/entactins and dystroglycans, for instance, in the lucida, perlecans and heparin-sulfate proteoglycans (HSPGs), among others, in the densa, which generally serve as structural bridges and/or signal mediators or regulators. The lamina lucida does appear to be nearly twice as stiff as the lamina densa [18].
The two networks of laminin and collagen IV are comprised of supramolecular aggregates formed via in situ self-assembly of smaller scale protein units secreted by the epithelia (laminin) and stromal fibroblasts (collagen IV). The cells first assemble BM functional units within and then secrete them. Assembly and disassembly of BMs occur at a dynamic steady state (remodeling), maintaining macroscopic properties such as size, shape, and strength over time-scales longer than those of association–dissociation kinetics. The BM performs two major functions. Firstly, it provides a structural and adhesive integument around epithelial tissue or tumor on the basolateral side, thereby compartmentalizing it—the biological equivalent of 'packaging-wrap' as well as anchoring the tissue to the stromal microenvironment (ECM), housing growth factors for cell growth and migration, and providing a scaffold for cell differentiation, survival, growth and migration. Secondly, it regulates signals at the biomolecular level—chemical, mechanical, electromagnetic—between the stromal (extracellular) microenvironment and the cells within the tissue (or tumor), thereby also acting as a 'transducer mounting plate', which is critical for the multitude of cell and tissue functions.
Laminin—a three-arm 'tinkertoy' network
The laminin network of the BM (lucida) is critical for signal transduction to and from cells, besides providing mechanical stability. The structural unit of the laminin network is the laminin heterotrimer biomolecule, which appears cross-shaped (†), and consists of three short arms of α, β, γ chains that are partially inter-twined into a single long arm (coiled coil). The individual chains are ca 160, 60 and 40 nm long, respectively. The G-domain (globular) of the long arm resides on the α chain, and binds to the cell surface receptors; namely, integrins and dystroglycans among others. The three free short arms interact with neighboring heterotrimers to form a ternary node network that appears like a 'tinkertoy' structure anchored to the cells on one side.
Collagen IV—a non-fibrillar 'ropey' network
Collagen is the most abundant protein in mammals. A third of the entire human proteome consists of collagen biomolecules. In all, there are 28 different types of collagen, of which collagen I (a fibrillar form) is the most common. Collagen provides mechanical strength, elasticity, and stability to organisms, more specifically, as integral components of connective tissues (e.g. bones, tendons, and ligaments), extracellular matrices, BMs, and ocular tissues (sclera and cornea). Collagen IV is a non-fibrillar, networkable form of collagen found primarily in BMs—one of the objects of this study. Collagen IV molecules are longer than fibrillar collagens (e.g. collagen I–III). They are derived from six distinct α-chain (single helix) polypeptides, viz., α1–α6. As shown by Kalluri [19], the collagen IV network forms sequentially via physicochemical association-driven self-assembly from monomers (single α-chain) to protomers (trimers of α-chains, i.e. triple helices) to dimers (head-to-head links of two such protomers) to tetramers (tail-to-tail links of four such dimers) to scaffolds and, ultimately, a superstructure network. This confers a 'ropey', or rope-like, nanostructure to the network.
Cell–cell, and cell–matrix or cell–BM adhesion–transduction molecules (CAMs)
Dozens of protein families play a critical role in histogenesis—to provide structural connectivity and integrity to the tissue via mechanical (adhesive) linkages and, simultaneously, to act as signal receptors and mediators between cells and their microenvironment (via adhesion complexes, or junctions). Such CAMs can be grouped into five classes: integrins, cadherins, immunoglobulin-like CAMs (IgCAMs), selectins, and CD44s. The integrin family of αβ heterodimers (22 distinct biomolecules in humans) are transmembrane proteins that mediate cell adhesion recognizing many ligands including proteins of the BM/ECM, cell surface, and plasma. They form a part of the hemi-desmosome and focal adhesion complexes, which connect the intracellular domains (F-actin cytoskeleton) to BM or ECM receptors, respectively, thereby anchoring cells and also serving as a signaling hub for cellular communication (cross-talk). Integrin-based adhesion controls cell growth, differentiation, gene expression, motility, and apoptosis [20]. Cadherins are a large family of transmembrane glycoproteins that regulate calcium-dependent, homotypic cell–cell adhesion. They can be further subdivided into: classic cadherins, desmosomal cadherins, protocadherins, and atypical cadherins. Classic cadherins, viz., E-, N- and P-cadherins, have been extensively studied and mediate via adherens junctions. Cadherins are involved in cell sorting functions during embryonic histogenesis, and E-cadherin has been identified as a suppressor of metastasis. Disruption of E-cadherin expression has been implicated in invasive carcinomas. Since adhesion facilitates carcinogenesis via dysregulation of CAMs and, consequently, cell growth, survival, and other processes along the metastatic cascade, it could be considered as a hallmark of cancer with 'anti-adhesion'; i.e. targeting specific CAMs, emerging as a key modality of oncotherapy. Integrins have been shown to be over-expressed in many cancers, while among cadherins, E- and P-cadherins are under-expressed, and N- and T-cadherins over-expressed. For more on this topic, the reader is referred elsewhere [20, 21]. In our work, we demonstrate the plausibility of cadherin switches during oncogenesis as we interpret the results of continuum modeling from a biomolecular perspective (including single molecule biophysical studies), specifically, a strain-induced anti-invasive E-cadherin to invasive N-cadherin switch [22]. Moreover, recent research has also shown the coordination and interdependence of cadherin and integrin adhesions, forming adhesion networks as opposed to functioning separately as 'adhesive crosstalk' [23]. Figure 2 shows a taxonomy of CAMs.
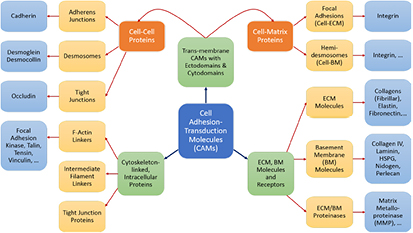
Figure 2. Schematic shows a taxonomy of cell adhesion–transduction molecules (CAMs) found in tissues.
Download figure:
Standard image High-resolution imageMathematical theory—from biological prototype to continuum nonlinear model
Model description
The previous section discussed the molecular-scale nanostructures of the tumor–BM prototype and their functions relevant to testing the proposed conjecture. We now approximate this prototype with a continuum model to be solved using Comsol Multiphysics® software. The tumor spheroid (tumor cells + BM), surrounded by the ECM or stroma, is approximated as a three-phase system, wherein a homogenous (coarse-grained) viscous liquid is enclosed within an elastic membrane (homogenous solid) as shown in figure 3. Proliferating cells, due to oncogenic neoplasia, set up a flow field within the growing tumor and are approximated as a viscous liquid for the (long) time-scales relevant to our model (see the time-scale comparison below). We neglect active (self-propelled) motion of cells due to a high cell number density  inside the tumor. We assume that the close-packed cells are confluent and are interlinked via CAMs that undergo dynamic assembly and disassembly at much shorter time-scales than cell or solute transport or kinetic processes that facilitate cell proliferation, apoptosis, and net growth of the tumor. The net proliferation of cells thus creates a radially-outward flow of the tumor liquid that pushes against the elastic membrane with increasing pressure versus time. This sets the liquid velocity at the tumor-membrane interface equal to the rate of increase of tumor size (inner radius
  ). To balance volumes, the increase in tumor volume is facilitated by an influx of water and solutes from outside the tumor through the membrane assumed semi-permeable or permeable to water and solutes, but not to the cells.
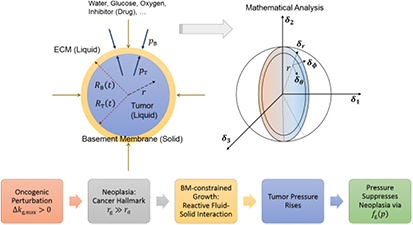
Figure 3. Theoretical model of the biological prototype of figure 1. This sketch depicts the avascular tumor microenvironment as a 2-phase spheroid surrounded by a 3rd phase. The elastic solid basement membrane encapsulates the viscous fluid tumor (cell cluster) and partitions the fluid ECM (stroma).
Download figure:
Standard image High-resolution imageExterior to the tumor-membrane system is a different liquid (the non-BM ECM or stroma), whose flow is of less interest than its ability to exert a nearly steady pressure on the membrane (BM). As a note on cell rheology at short time-scales, cells are understood to respond in an elastic, viscoelastic, or poroelastic manner [24]. These time-scales may only become relevant when we discuss the post-cavitation phase of the growing tumor–BM inasmuch as 'catastrophic failure' from stress localization is suggested to occur at these shorter time-scales. The elastic membrane, which represents the BM, is approximated as a Hookean solid; i.e. stress is linearly proportional to strain with a constant modulus of elasticity. This is referred to as the small strain (or infinitesimal strain) limit in solid mechanics. The fluid flow inside the tumor is expected to be Stokesian, as the low rates of tumor growth (time-scales in order of hours/days even in highly malignant tumors), microscale tumor diameters (μm), and high fluid viscosities yield low Reynolds' numbers. However, we avoid using the Stokes equation as such and instead use the simpler velocity-explicit Darcy's law. The time-scales for change in flow are so much smaller in comparison to substrate diffusion and cell growth kinetics that it is appropriate to assume steady flow, i.e.  ; see the paragraph preceding equation (24) further below. Darcy's law is written in 3D spherical coordinates (figure 3) with the origin at the tumor center in equation (1). Here, v is the vector velocity of the cells inside the tumor (a liquid);
  is the 'homeorhetic' or mechanical pressure defined as the isotropic force per unit area exerted by cells normally on any arbitrary surface within the steadily-growing tumor, i.e.
  , while
  are the Darcy permeability, and the effective cell viscosity that reflects the complex rheology of a cell cluster interconnected via adhesions, respectively.
An aside on homeorhesis and homeostasis
The homeorhetic pressure is neither the thermodynamic nor hydrostatic pressure; rather, it is the mechanical pressure, exerted intrinsically by active cells seen as units unto themselves, similar to the concept of molecules that due to their native kinetic energy give rise to thermodynamic pressure. The precedents for this concept can be found in the works of Prost and colleagues, who referred to it as 'homeostatic' pressure [25], and Lowengrub et al who used the term 'oncotic' pressure [26]. However, following Waddington's work nearly half a century ago [27] as well as Mamontov et al's [28], and Raubenheimer et al's [29], we propose that the term homeorhesis is more suitable to describe a growing (malignant) neoplasm. We recognize that homeorhesis is the appropriate physiological and ontogenic description of the evolutionary morphogenetic processes during the life-span of an organism or biological unit (BU) as in a cell, tissue (including tumor), or organ—it is the time-dependent extension of homeostasis. While homeostasis refers to the BU's ability to self-regulate (or autoregulate) and, thereby, self-organize (self-assemble) into far-from-equilibrium states of stasis, homeorhesis describes the broader pattern inclusive of the dynamical transitions between such steady states through state space. In essence, homeorhesis is the 'flow of life' itself of an organism or BU—an arrow of time—where the organism or BU evolves along a definite time-path from an initial stage or state (as in the zygote or fertilized egg) through birth, childhood, adolescence, adulthood, and eventually, senescence. The various stages of the cell cycle may also be seen in the context of homeorhesis. In fluid dynamics, (thermodynamic) pressure is written as the sum of hydrostatic and hydrodynamic pressures. Similarly, we may think of homeorhetic pressure as the sum of previously homeostatic and 'homeodynamic' pressures, if necessary.
Returning to the model description, we further assume spherical symmetry, i.e.  , and make a 1D approximation leading to:

To determine a suitable value for permeability, we use an empirical expression [30] for biphasic media, where the contiguous majority cellular phase has a high volume fraction  and the minority interstitial phase is fibrous. We choose this arbitrary value to render this expression finite and state that such an approximation is physically valid considering that most tumors contain some collagen (I, III) fibers in the extracellular, interstitial and intratumoral space and resemble hydrogels used as scaffolds for tissue engineering. We, therefore, implicitly assume that choosing a viscous rheology for the tumor contents (mostly the cell cluster) does not preclude visualizing the tumor microstructure as biphasic where the volume fractions of each phase remain constant throughout the tumor growth process. The non-cellular matter (fibers, etc) may be assumed to move along with the cells. With a fiber diameter of 20 nm
  , and constant 'cytosity'
  —porosity occupied by cells—we calculated a Darcy permeability of
  . Similarly, as described in the following paragraphs, it is useful to visualize the intracellular nanostructure as a porous medium as well, albeit at the macroscale (continuum), the contiguous cell cluster within the tumor is rheologically viscous. In percolation theory or gelation nomenclature, both the biphasic tumor and individual cells are visualized as poroelastic media near the low elasticity-limit or equivalently, 'poroviscous' media near the high viscosity-limit in relation to a percolation-viscosity/elasticity plot [31]. This means that the tumor scaffold (the 'histoskeleton', if you will) and the cytoskeleton are low elasticity solids or high viscosity liquids, while the cells within the tumor and cytosol within those cells, respectively, flow viscously.
We now write the coarse-grained (continuum) differential mass balance equations for cell and solute concentrations (densities) inside the tumor domain. The solute may be a substrate; i.e. a nutrient molecule that participates in metabolic enzymatic reactions such as glucose, lactate, glutamine, or an oxidant or oxidizing agent (an electron acceptor such as oxygen). The modeling framework constructed herein incorporates key concepts on cellular mechanics elucidated recently by Prost and colleagues [32]. Another component draws on biochemical engineering literature, specifically concepts, cell growth rate laws based on Monod-type kinetics albeit with dependence on cellular energetics, and parametric data reported in literature [33]. As discussed below, Monod kinetics may be interpreted from the perspective of Michaelis–Menten kinetics of enzyme–substrate biocatalytic reactions—an integral component of intracellular metabolic pathways in both prokaryotes and eukaryotes. Midway through this section and in the subsequent article [1], we interpret enzymatic catalysis, biomolecule binding-dissociation, and folding-unfolding from the perspective of single molecule physics and mechanochemistry as enunciated by Bell and subsequent researchers [34–36]. The cell mass balance is written as:
Here,  and
and  are the cell concentration and ATP generation rate, respectively. The cell concentration can be written as a number density, a (wet) cell mass concentration, or a dry cell mass concentration. The dry or drained cell mass concentration is commonly used in biochemical engineering literature [33]. It denotes the mass concentration of the cells minus their water content of the 'solids' alone (a hypothetical dry or drained state). The dry state can also be seen as a drained or dehydrated state apropos of porous media nomenclature. The plots from the simulations will be presented after conversion to the more favored parameter in physical biology, viz., cell number density [25]. The two are related via a simple constant:
  , where
  is the mass of a single dry or drained cell. Similarly, one could use a wet cell mass concentration that represents cells in their native (hydrated) state in vivo or in vitro. Typically, for the objectives herein, we assume that the dry mass or solids constitute ca 30% of the total cell mass (wet mass) in its homeostatic or stress-free state. In other words, water constitutes 70% of the mass of a typical cell in its stress-free state. We also approximate that as a cell is stressed (or equivalently, strained), it loses or gains water depending on whether it shrinks or swells, respectively. In this context, the mass of the solids within a cell is conserved during deformation, which implies that
  , where
  is the volume of a single cell.
Generally, tumors are comprised of normal and abnormal (cancer) cells that exhibit starkly different phenotypes, including fractal morphology, mechanical properties, consumption rates of nutrients, and rates of cell growth and death. These dissimilar cell groups compete for resources required for survival and growth. However, in this work, we assume local, coarse-grained homogeneity of continuum properties from mixture theory (e.g. kinetic rate constants and viscosity). We systematically vary these properties along an arbitrary phenotypical coordinate (from normal to cancer cells) to demonstrate their effects on the overall growth dynamics of the tumor constrained by the BM.  and
and  denote cell growth and death rates, respectively, and are written as mathematical functions of cell concentrations, ATP generation rates that depend on solute concentrations, and the total stress tensor
  to account for effects of mechanical stress on cell growth. Cell growth ranges from normal mitotic proliferation to oncogenic neoplasia. Cell death may occur from apoptosis, necrosis, or atrophy, while stress effects on growth/death occur via mechanotransduction among other causes and modes. Although we analyze avascular tumors alone in this work (pre-angiogenesis stage, or post-devascularization induced by tumor pressure), in general, the solute or substrate/oxidant balance equation for a vascularized tumor can be written [37] as the multi-component reaction-advection-diffusion equation for species
  as:
as:
The last term denotes the mass transfer from vasculature within the tumor (post-angiogenesis) into the extra-vascular tumor volume (mostly cells, and intra-tumor ECM).  denotes the effective diffusivity of solute species
  ; e.g. glucose
  , oxygen
  , lactate
  , glutamine, growth factors, and drugs through the tumor tissue via various transport mechanisms that may be active (primary, secondary), or passive (diffusion, osmosis, facilitated transport via channels or carriers) [38, 39]. For simplicity, we only consider three species, viz., glucose, oxygen, and lactate, which participate in glucose metabolism and are critical to cellular respiration/energetics. Their measured effective diffusivities are shown in table 1. The biochemical equation for tumor cell growth can be written as:

Table 1. List of parameters, variables and other notation.
| Name | Value/Expr. | Description, reference; units in SI |
|---|---|---|
 |
 |
Parameter in cell growth-stress function,  , equation (18) [51] , equation (18) [51] |
 |
 |
Parameter in cell growth-stress function,  , equation (18) [51]; Pa−1 , equation (18) [51]; Pa−1 |
 |
 |
Parameter in cell growth-stress function,  , equation (18) [51] , equation (18) [51] |
 |
 |
Parameter in cell growth-stress function,  , equation (18) [51]; Pa−1 , equation (18) [51]; Pa−1 |
 |
 |
Parameter in linear alternative,  , equation (33) [51]; Pa−1 , equation (33) [51]; Pa−1 |
 |
 |
Parameter in linear alternative,  , equation (33) [51] , equation (33) [51] |
 |
 |
Parameter in linear alternative,  , equation (33) [51]; Pa−1 , equation (33) [51]; Pa−1 |
 |
 |
Parameter in linear alternative,  , equation (33) [51] , equation (33) [51] |
 |
 |
Parameter in lactate function,  , equation (10) [47]; mol cell−1 , equation (10) [47]; mol cell−1 |
 |
 |
Parameter in lactate function,  , equation (10) [47]; mol cell−1 , equation (10) [47]; mol cell−1 |
 |
 |
Parameter in linear alternative,  , equation (34) [47] , equation (34) [47] |
 |
 |
Parameter in linear alternative,  , equation (34) [47]; mol cell−1 , equation (34) [47]; mol cell−1 |
 |
Variable | Dry cell mass concentration or density; kg m−3 |
 |
Variable | Tumor volume-averaged dry cell mass concentration; kg m−3 |
 |
 |
Initial dry cell mass concentration or density in tumor; kg m−3 |
 |
Variable | Substrate concentration of species  in tumor; kg m−3 in tumor; kg m−3 |
 |
 |
Initial substrate (glucose) concentration in tumor; kg m−3 |
 |
 |
Steady bulk substrate (glucose) concentration in ECM; kg m−3 |
 |
Parameter | Initial substrate (oxygen) concentration in tumor; kg m−3 |
 |
 |
Steady bulk substrate (oxygen) concentration in ECM; kg m−3 |
 |
Parameter | Initial substrate (lactate) concentration in tumor; kg m−3 |
 |
 |
Steady bulk substrate (lactate) concentration in ECM; kg m−3 |
| cvi | Variable | Substrate concentration of species in vasculature; kg m−3 |
 |
Variable | Substrate concentration per cell, equation (6); mol cell−1 |
 |
 |
Cell diameter; m |
 |
 |
Tumor interstitial collagen fiber diameter; m |
 |
 |
Effective diffusivity of substrate (glucose) in tumor [48]; m2 s−1 |
 |
 |
Effective diffusivity of oxygen in tumor [48]; m2 s−1 |
 |
 |
Effective diffusivity of lactate in tumor [48]; m2 s−1 |
 |
 |
Effective diffusivity of glucose in hydrogel [57] set to BM; m2 s−1 |
 |
 |
Effective diffusivity of oxygen in hydrogel [57] set to BM; m2 s−1 |
 |
Variable | Elastic or Young's modulus, or stiffness, of tumor (cells + ICS); Pa |
 |
 |
Initial elastic modulus of tumor [17]; Pa |
 |
 |
Elastic modulus of typical, normal basement membrane [17]; Pa |
| Eb | Parameter | Reduced elastic modulus of BM due to pathology; Pa |
 |
Equation (18) | Pressure-effect-on-cell-death function as in equation (12) |
 |
Equation (18) | Pressure-effect-on-cell-growth function as in equation (12) |
 |
 |
Time-dependent thickness of basement membrane (BM); m |
 |
 |
Initial homeostatic thickness of basement membrane (BM); m |
 |
Variable | Specific cell death rate as in equation (5); s−1 |
 |
Variable | Specific cell growth rate as in equation (4); s−1 |
 |
 |
Maximum specific cell growth rate for Monod cell kinetics [45]; s−1 |
 |
 |
Maximum specific cell death rate for Monod cell kinetics [45]; s−1 |
 |
Parameter | First-order rate constant for substrate consumption [47]; s−1 |
 |
Parameter | Rate constant for substrate consumption defined by equation (9); s−1 |
 |
 |
Measured rate constant for glucose consumption [47]; s−1 |
 |
 |
Measured rate constant for lactate consumption [47]; s−1 |
 |
Variable | Bulk modulus of tumor, related to  or or  via scaling law (16); Pa via scaling law (16); Pa |
 |
![${{E}_{0}}/\left[3\left(1-2{{\nu}_{\text{T}}}\right)\right]$](https://content.cld.iop.org/journals/2057-1739/2/1/015001/revision1/cspoaa1462ieqn121.gif) |
Initial bulk modulus of tumor; Pa |
 |
 |
Molar cell growth saturation constant [45]; mol cell−1 s−1 |
 |
 |
Molar cell death saturation constant [45]; mol cell−1 s−1 |
 |
 |
Power law exponent for tumor elastic or bulk modulus [24] |
 |
 |
Mass of one dry cell; kg |
 |
 |
Molecular weight of glucose; kg mol−1 |
 |
 |
Molecular weight of oxygen; kg mol−1 |
 |
 |
Molecular weight of lactate; kg mol−1 |
 |
 |
Molecular weight of ATP; kg mol−1 |
 |
 |
Power law exponent for tumor viscoelastic relaxation time [24] |
 |
 |
Total number of cells in tumor |
 |
 |
Initial number of cells in tumor |
 |
 |
Cell number density; m−3 |
 |
Variable | Homeorhetic pressure in tumor, scales with  , equation (16); Pa , equation (16); Pa |
 |
 |
Initial homeostatic pressure in tumor [52]; Pa (or mm Hg) |
 |
Variables | Pressure at tumor–BM, and BM-ECM interfaces (pB = p0); Pa |
 |
 |
Molar rate of ATP generated per cell, equation (6); mol cell−1 s−1 |
 |
Variable | Molar rate of substrate consumed per cell, equation (8); mol cell−1 s−1 |
 |
Coordinate | Radial coordinate in spherical coordinate geometry; m |
 |
Variables | Mass rate of cell growth, or death per tumor volume; kg m−3 s−1 |
 |
Variables | Mass rate of substrate consumed per tumor volume kg m−3 s−1 |
 |
Variables | Radius of tumor, and tumor–BM spheroid; m |
 |
Variables | Rates of tumor growth, and tumor–BM spheroid growth; m s−1 |
 |
 |
Initial tumor radius (homeostatic state); m |
 |
 |
Initial tumor–BM spheroid radius (homeostatic state); m |
 |
Coordinate | Time coordinate; s |
 |
 |
Characteristic time-scale for substrate (glucose) diffusion; s |
 |
 |
Characteristic time-scale for cell flow (viscous fluid) in tumor; s |
 |
 |
Characteristic time-scale for cell growth kinetics; s |
 |
Variable | Displacement of solid membrane (BM); m |
 |
Variable | Cell velocity (fluid) in tumor: vector, radial component; m s−1 |
 |
Variable | Tumor volume; m3 |
 |
 |
Initial tumor volume (homeostatic state); m3 |
 |
Variable | Specific volume of cells (native hydrated state); m3 kg−1 |
 |
 |
Dimensionless radial coordinate |
 |
Unit vector | For Cartesian,  ; spherical coordinate system, ; spherical coordinate system,  |
 |
Variable | Effective cell (fluid) viscosity; Pa s |
 |
 |
Initial effective cell viscosity; Pa s |
 |
 |
Cell number density-dependent volume of a single cell; m3 |
 |
 |
Initial volume of single cell, set equal to sample mean [45]; m3 |
 |
 |
Darcy's permeability, calculated from [30]; m2 |
 |
 |
Mass transfer coefficient from ECM to tumor–BM interface [57]; m s−1 |
 |
 |
Poisson's ratio of tumor cells (fluid) [24] |
 |
 |
Poisson's ratio of basement membrane (solid) |
 |
 |
Initial density of single cell; kg m−3 |
 |
Variable | Cauchy total stress tensor, stress components |
 |
Variable | Effective von Mises stress in the basement membrane; Pa |
 |
Parameter | Yield strength of basement membrane; Pa |
 |
 |
Ultimate breakage or rupture strength of BM across lifespan [59]; Pa |
 |
Variable | Tumor cell viscoelastic relaxation time; s |
 |
 |
'Cytosity' or porosity of tumor spheroid occupied by cells |
 |
Parameter | Mass transfer coefficient from vasculature to tumor; s−1 |
 |
 |
Basal survival fraction of cells [45] |
Cells in all living organisms derive energy for their numerous activities, including biomolecular syntheses, mitosis, and apoptosis from several metabolic reaction pathways of which the metabolism of glucose (a monosaccharide produced from the breakdown of carbohydrates) is fundamental. Metabolism comprises the two processes of catabolism and anabolism—where cells decompose complex molecules to harvest free energy (exergonic) and assemble simpler molecules into complex ones, such as proteins, and nucleic acids, consuming the harvested free energy (endergonic), respectively. The molecule ATP is the chief energy currency in these reactions and, hence, its availability is critical to cellular activities. In eukaryotic cells under normoxia, where the tissue is well-oxygenated, ATP is generated via aerobic respiration, which involves the selection of one of two possible metabolic pathways, or 'metabotypes', vis-à-vis glucose catabolism. The oxidative metabotype is most common among normal cells and, generally, involves glycolysis in the cytoplasm followed by the citric acid or Krebs' cycle, and oxidative phosphorylation (electron transport chain) in the mitochondrion with carbon dioxide and water as end-products. The second metabotype—called aerobic glycolysis or the Warburg effect [40]—occurs during carcinogenesis or oncogenesis (during neoplasia), and/or under transient hypoxia (when oxygen becomes scarce). This 'path bifurcation' specific to cancer cells involves glycolysis followed by fermentation in the cytoplasm with lactate or ethanol as end-products and is sustained, via genetic re-programming (a biochemical adaptation), even after return to normoxia with no detectable mitochondrial dysfunction. Such fermentative catabolism is akin to anaerobic respiration seen in prokaryotes and hypoxic eukaryotic cells (e.g. muscle cells after exertion), except that the re-programmed pathway in eukaryotic cancer cells could lose reversibility vis-à-vis oxygen availability as Warburg's observations had suggested. Oncogenesis is currently understood to be triggered either via genotoxicity of cells (genetic mutations), or homeorhetic (or homeostatic) dysfunction [28], or a tangled hierarchy of both and is followed by natural selection. While oxidative catabolism, a typical feature of normal cellular energetics, is highly efficient, generating ca 38 ATP molecules per glucose molecule, aerobic glycolysis is inefficient, generating only 2 ATP molecules per glucose molecule (as in anaerobic respiration). However, in contrast and, presumably, as an adaptation too, neoplastic (cancer) cells concomitantly consume glucose voraciously to meet their energy requirements for proliferation. This synergetic attribute of the Warburg effect—the correlation between the steep glucose uptake rates (hyperglycolysis) and metabolic path bifurcation—has enabled signature cancer-detection technologies such as positron emission tomography (PET). The steeply increased uptake (ca 200-fold) is facilitated by the up-regulation of glycolysis via the appearance of increased glucose-transporter biomolecules (members of the GLUT family)—key participants of facilitated diffusion across the plasma membrane. Researchers, until a few years ago, correlated this rapid glucose uptake in cancerous tumors to the observed intratumoral hypoxia, the consequent selection of the aerobic glycolytic metabotype amongst cells imparting hypoxia resistance notwithstanding energy inefficiency, and lactate accumulation. Recently, Sonveux et al and others [41–44] unraveled a missing conceptual link by demonstrating that a 'metabolic symbiosis' existed within tumors between metabotypically-altered and unaltered cancer cells, wherein the former sub-group metabolized glycolytically, while the latter did so oxidatively. They demonstrated that the lactate generated by the former (hypoxia-resistant cells) was utilized as a source for the untransformed latter's consumption (normoxia-only cancer cells). These cell sub-groups (unaltered versus altered cancer cells) likely correspond to normoxic and hypoxic regions, respectively, within the growing tumor. Also, since the tumors contain normal cells as well, lactate further becomes a nutrient for their oxidative catabolism in addition to the available glucose, creating a three-way competition for survival that is influenced by local availability of oxygen. This '3-phase' scenario is illustrated schematically in figure 1. Besides, the up-regulation of GLUTs, monocarboxylate transporters 1 and 4 (MCT1, MCT4), are also up-regulated in cancer cells in contrast to normal cells. These lactate-transporter biomolecules are essential for the facilitated diffusion of lactates in and out of cancer cells, and for tumor growth in general (MCT1 for lactate ingestion, and MCT4 for egestion). We also emphasize that although we have classified intratumoral cells into these three distinct sub-groups, this is only an approximation to reality where cells vary in a graded manner with regard to phenotypes and proliferative potential.
To capture the effect of microenvironmental nutrients on tumor growth dynamics, inclusive of the aforementioned glucose–lactate symbiosis, is thus essential in our model. We use Monod cell kinetics to describe the rates of cell proliferation (growth) and death—an empirical relation based on Michaelis–Menten enzymatic kinetics, which has a theoretical basis, and has proven reasonably accurate when accounting for the effect of substrate concentrations on cell growth rates [33]. The mathematical similarity between the two equations, which are hyperbolic functions, could be viewed from the perspective of cell growth rate being limited by a single enzymatic reaction, or a sequence of reactions along a metabolic pathway with parametric criteria imposed [45, 46]. However, we modify Monod's equations by introducing the hyperbolic dependence of cell growth and death rates on cellular ATP generation rates  rather than substrate or nutrient concentrations
  as described in Venkatasubramanian et al [45]:
In the initial, homeostatic (stress-free) state, the net molar rate of ATP (mol s–1) generated per cell, Qatp, can be related to the molar rates of substrates glucose, oxygen, and lactate, consumed per cell; i.e., Qsg, Qso, Qsl, respectively, as shown by Forbes and co-workers [45, 47]. This can be simplified further, via the stoichiometry of the metabolic reactions as shown in equation (6). ω is the basal survival fraction and is included to account for cell death independent of cellular energetics; e.g. apoptosis from nuclear damage:
The notation used is annotated in table 1 [45]. The subscript 'tm' denotes 'transmembrane flux', as the cellular uptake rates of two substrates—glucose and lactate—are limited by transport across the cell membrane, while oxygen uptake is limited by intracellular metabolism.  (mol cell−1 s−1) are measured uptake (consumption) and ATP generation rates, respectively, while
  (mol cell−1) is related to
  —our preferred choice for substrate concentration on a unit tumor volume basis (kg m−3) as:
Note that  only when lactate is generated.
Similarly,  is related to substrate consumption rates per unit tumor volume,
  , as:
, as:
A Thiele modulus estimation reveals that nutrient uptake by cells occurs much faster than their diffusion rates through the tumor [47]. To simplify computational analysis, we restrict the governing partial differential equations in the tumor domain to the cell balance and a single limiting substrate balance, viz., equations (2) and (3). Due to its tenfold lower diffusivities, the transport of glucose is much slower than that of oxygen, both across the BM and through the tumor, wherein concentrations likely remain normoxic, with hypoxic pockets, as discussed earlier. Coupled with the signature high glucose uptake rates of cancer cells, visualized with PET, glucose becomes the best choice for the rate-limiting nutrient, forging the critical link between mechanics and biochemistry at the continuum scale (see table 1 for diffusivity data [48]). The lactate concentration within the tumor and stroma are negligible when normal cells overwhelm cancer cells in number, but increase within the tumor when cancer cells are hyperglycolytic and/or hypoxic. This accumulation of lactate is an affirmation of aerobic glycolysis, which becomes fuel for cell proliferative/apoptotic processes—available to enter the citric acid cycle and oxidative phosphorylation, especially when glucose is in shortage [49, 50]. With glucose as the most essential externally supplied nutrient/substrate for tumor growth and due to low Peclet numbers (i.e. substrate diffusion relatively dominates the anti-parallel advection due to Stokes' flow), equation (3) for avascular tumors, further simplifies to:
in that there are three concentration variables,  , and only two governing equations, viz., equations (2) and (9) that incorporate equations (4)–(8), we can relate the transient lactate concentration,
  , to the glucose concentration,
  , via an arbitrary mathematical function that qualitatively captures the effect of metabolic symbiosis described above, i.e.
  . For simplicity, we shall assume the hyperbolic 3-parameter form, where the parameters
  are determined from experimental data and a 3-point curve fit [47]:
From (6), (7), (10), and using  , we have:
Cell growth in tumors is however different from those in artificial bioreactors, and shows significant dependence on imposed mechanical stresses (normal and shear) [51–53]. In our prototypical spheroid (the tumor–BM composite), we will account for this dependence by factoring the growth rates with mathematical functions that reflect the effects of the Cauchy stress tensor. We assume that isotropic pressure dominates viscous stresses, especially due to slow flow (Stokes' regime), while the greater elasticity (a thousand-fold) of the BM contributes to the confluence of cells. We apply 1D spherical symmetry and combine the above equations to provide two governing equations to be solved within the tumor domain,  , recognizing that
  , and similarly,
  :
:
We can also write an integral cell mass balance for the tumor volume (for counter-checking) as:

Equations (12) and (13) are central to understanding the mechanochemistry of tumor growth from a macroscopic (continuum or coarse-grained) perspective that would subsequently facilitate a molecular interpretation.
We now require an equation of state (EOS) to relate the tumor pressure to cell concentration or number density. We relate the local bulk modulus of the tumor to cell concentration using a scaling law derived from measurement of the mechanical behavior of wet polymer gels [54, 55]. Cells are made up of a filamentous, gel-like network (F-actin, intermediate filaments and microtubules) and are adhered together via CAMs, which lends credence to such a scaling approximation. Recent work has also shown that individual cells behave in a poroelastic manner at short time-scales [24]. To visualize this, we could imagine an infinitesimal cube of tumor tissue (mostly cell cluster and a little intercellular/interstitial fluid) subjected to a pressure change from  to
to  , while its cell density changes from
  to
to  , maintaining the original proportion of cells to intercellular space (ICS); i.e.
  stays constant. As more tumor tissue (cells plus small ICS) is squeezed into this cube, the cells crowd, deform, and shrink, exuding water in relation to their compressibility (inverse of the bulk modulus). Such an image can also be used to prove an expression derived earlier, viz.,
  a constant. Although the physics is a little more complex than that of shrinking or swelling polymer gels due to different water transport mechanisms (active, facilitated transport, etc), we will use this relation as a starting point and a platform for future experiments. The scaling exponent
  typically ranges between ca 3.5–4.0 for polymer gels. Recalling that
  , we have:

Defining an initial, stress-free (homeostatic) state of the cells with the subscript '0', we deduce three corollaries:
Similarly, for the effective viscosity (used in Darcy's law), we may scale via a power-law relaxation time for cells, i.e.  to write:
In both the scaling relationships (16) and (17), we assume that the stress-free homeostatic state and the exponents  , can be measured empirically via dynamic mechanometry and rheometry, respectively. Using microindentation and optical techniques, Moeendarbary et al [24] determined the scaling power law between the elastic modulus, poroelastic diffusivity, and volumetric pore size, when HeLa and Madin–Darby canine kidney (MDCK) epithelial cells underwent volume change upon compression. Rendering their results into the notation used in this work, we find that
  for the HeLa cells, and
  for the MDCK cells. Similarly,
  , and
, and  , for HeLa and MDCK cells, respectively. Higher values of bulk moduli signify greater stiffness or lower compliance; therefore, a cluster of proliferating MDCK cells would get much stiffer than a similarly-sized cluster of proliferating HeLa cells. However, MDCK cells would relax stresses faster than HeLa cells, neglecting the effects of cell–cell adhesion.
To account for the effect of mechanical forces on cell growth and death rates in equations (12)–(14), we apply concepts suggested by Fung [56] and data from Montel et al [51] as well as Stylianopoulos et al [52] as starting points and arbitrarily choose the following functions to reflect some of their intuitions:
Equation (18) was curve-fit to computational data extracted from dissipative particle dynamics simulations [51], where pressure is applied externally to a spheroid via osmosis. The function  has a single term for the spheroid 'core' where stress effects on apoptosis (cell death) are greater than on mitosis (growth) and an additional term for the 'proliferating rim'—arbitrarily defined by two cell diameters' width—where mitosis dominates over apoptosis. The cell diameter is a function of cell number density as shown in table 1. The functions on these sub-domains are interpolated into a single function valid for the entire tumor domain, viz.,
  .
.
Following the above development, the governing equations (12) and (13) for the tumor domain  are rewritten as:

We can now write the boundary and initial conditions (BCs, ICs) for the above tumor-domain equations, incorporating spherical symmetry (21), a moving tumor–BM interface (22), and a stress-free, homeostatic initial state (23) as follows:
Here,  denote the mass transfer coefficient of the solute/substrate glucose from the bulk ECM to the tumor-membrane interface and substrate concentration in the bulk ECM, respectively. A dimensional analysis of the various process time-scales involved gives a flow time-scale of
  , diffusion time-scale of
  , and kinetics time-scale of
  . This shows that cell flow sets up rapidly, justifying our assumption of steady confluent flow. However, solute diffusion and cell kinetics are much slower processes and become rate-limiting. The mass transfer of glucose and oxygen through the BM is described by effective diffusivities,
  , measured on polyvinyl alcohol (PVA) hydrogel substitutes instead [57], and the time-dependent membrane thickness,
  , or, equivalently, mass transfer coefficients,
  ,
,
Note that we consider only two of the three solutes as lactate is generated and consumed within the tumor and arguably negligible amounts exuded out of the tumor.
We now turn attention to the elastic membrane which represents the BM. The equilibrium stress–strain fields in a pressurized hollow sphere with given internal and external pressures are derived elsewhere [58]. We utilize the analytical solutions therein by approximating the tumor growth dynamics as a quasi-static process; i.e. the rate of growth is much slower than rates at which the stress–strain fields in the membrane reach steady state. This allows an infinitesimal strain approximation, or linear elasticity, and differentiation of displacement from Bower's analysis, to yield the constraint equation at the tumor-membrane interface. This equation is imposed on the governing equations in the tumor domain and BCs elucidated earlier in equations (19)–(23) and solved in a coupled manner on the Comsol Multiphysics® Equation-Based Modeling platform. This constraint equation at the tumor membrane interface,  , is rewritten as:
This can be written in a more convenient, pressure-explicit form,  , as:
, as:
An equation similar to (25) could be written for the outer radius  as well. However, a simpler form may be obtained by conserving the volume of the membrane:

The radial, tangential (polar and azimuthal), and effective von Mises stress are written as:
The reader must be aware of the sign convention whose stress is positive when tensile, while pressure is positive when compressive. Following the above development, we can now define the criterion for cavitation of the BM as:

Here,  denote the yield strength and the ultimate breakage or rupture strength of the BM, respectively—quantities that can be measured experimentally via tensile tests. The former always precedes and, typically, is less than ('
 ') the latter as discussed in detail in a subsequent section. Recent work [59] has shown that the breakage strength of a normal or healthy human anterior lens capsule, which is the thickest BM in the human body, decreases from ca 17.5 to 1.5 MPa with increasing age—from 7 months to 98 years, respectively—while correspondingly increasing in thickness from ca 4 to 30 μm. Although stiffness (elastic modulus) and breakage strength are not directly related, it is reasonable to surmise that a pathologically-softened (e.g. proteolyzed) BM is likely to show a decreased modulus as well as breakage strength. A linear reduction in
  with
with  would serve as a good starting point in our calculations, especially when
  data are unavailable.
To summarize, figure 4 pictorializes the entire model and pinpoints its chief conceptual ingredients, viz., (i) the open reactive system—a growing tumor—that imbibes substrate glucose, oxygen, and water via diffusion, and (ii) catabolizes these nutrients into available energy or exergy in the form of ATP for cell proliferation or growth, and apoptosis; (iii) the fluid–solid interaction of the proliferating tumor cells creeping radially outward as a Stokesian fluid while being constrained by the elastic solid (Hookean) BM; and (iv) the mechanotransduction-based damping of cell proliferation via the function,  . The model inputs are grouped into those that relate to (v) the initial homeostatic state and the diffusive transport of nutrients; (vi) the rheology or poroelasticity or EOS of the cells; (vii) mechanical properties of the BM, especially, the elastic or Young's modulus, which quantifies stiffness or, inversely, softness; (viii) the symbiotic relationship between the imbibed substrate glucose and metabolite lactate generated via aerobic glycolysis of the former; (ix) the mechano-damping function that suppresses proliferation with increasing pressure; and (x) the oncogenic, or more specifically, mutagenic switch or perturbation that represents a sharply-increased proliferation efficiency characteristic of neoplasia and quantified by the maximum specific growth rate,
  . The model outputs are grouped as local and global variables that quantify spatio-temporal distributions and volume-averaged properties, respectively.
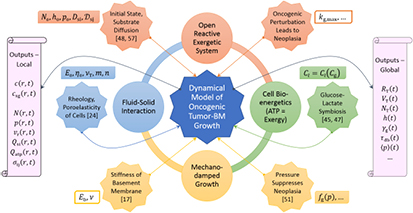
Figure 4. Sketch shows an overarching perspective of the theoretico-computational model developed herein with inputs (icosagons and proximate rectangles), salient interacting theoretical concepts (circles) and outputs (scrolls). The reader is also referred to the summary at the end of the theory section.
Download figure:
Standard image High-resolution imageResults: tumor-membrane growth dynamics as perturbative homeorhesis
We non-dimensionalized equations (19) and (20)—the governing equations of the tumor domain—using the variable  , where
  , and solved them using equation-based modeling routines in Comsol Multiphysics®. The input parameters to the model are experimental data from literature and their curve-fits shown in table 1. The solved output variables are
  , while other spatio-temporal or local variables shown in figure 4 are derived therefrom. Note that we drop the subscript on glucose for convenience when appropriate, e.g.
  . We also evaluated volume-averaged properties such as
  as shown below:
Herein, we present numerical solutions of the model to demonstrate the functionality, robustness, and consistency of the theoretico-computational methods used in this duology. The simulations capture the homeorhetic journey of the tumor-membrane system from its initial homeostatic steady state to a new steady state, also at homeostasis vis-à-vis its microenvironment, in response to a perturbation or step change to a sensitive input variable such as the maximum specific growth rate of cells in the Monod equation(4),  . Equivalently, input variables such as
  of equations (2) and (5) may be perturbed to the purpose that, on the whole,
  , i.e. the rate of cell proliferation is in excess of the rate of apoptosis, or net tumor growth occurs. We refer to these as 'perturbation simulations' throughout this duology, and the final steady state may be likened to the concept of a 'new normal' used in the social sciences. We also analyzed the sensitivities of the tumor-membrane growth dynamics to the following parameters and functions: maximum specific cell growth rates, scaling exponents for the tumor modulus and viscosity, viz.,
  , respectively, the glucose uptake coefficient,
  , cytosity,
  , cell stiffness,
  , in addition to various forms of the mechanodamping function,
  , and the glucose–lactate symbiosis function,
  . The scaling exponents are a measure of change in tumor stiffness (different from BM stiffness), and cell rheology inclusive of adhesions (cell–cell, cell–matrix), respectively, with respect to cell number densities, while the uptake coefficient is a measure of the activity of GLUT enzymes for facilitated transport across the cell membrane. The physical significance of the other parameters and functions mentioned above are more self-explanatory and/or described further below accompanying corresponding subplot results.
We present three quartets of plots in this article, which in addition to the above objectives, aim to provide a partial basis for addressing the central question posed in this work, viz., does cavitation near the tensile yield point of the BM mark the onset of cancer invasion leading to metastasis? Further proof via comparative simulations and the physical insights gleaned therefrom are the main theme of the subsequent article [1]. For the parametric values displayed in table 1, extracted from experimental data in literature, figure 5 shows the effect of variation of the BM stiffness; i.e. elastic modulus, on the dynamic tumor radius, tumor–BM interfacial ATP (exergy) generation rates, local homeorhetic tumor pressures, the tumor–BM interfacial effective von Mises stress, and the thickness of the BM. Elastic moduli were varied between  0.2 and 0.8 MPa, with the lower limit, or
  0.2 MPa used in the comparative study of the sequel [1] as well, to represent the stiffness of the pathologically-softened BM. The plots reveal several interesting features that are also visualized later in figure 8(left). We observe that for moduli decreasing between 0.6–0.4 MPa, the system starts to exhibit a second-order dynamical response with an inflexion point as seen in the
  plot described in greater detail in the sequel. The tumor volume expansion is very pronounced during this range of membrane stiffness decrease or softening. Also, the energy (or more precisely, exergy) generation rates among the peripheral cells surges,
  , presumably due to easier access of nutrients due to the thinning membrane's reduced diffusional resistance (see equation (24)). Nearly synchronous with the inflexion seen in the
  plot, the pressure plots,
  , show maxima during the homeorhetic process. The corresponding effective von Mises stress plots also demonstrate an interesting phenomenon. Results document a dramatic jump in the von Mises stress at the tumor–BM interface for a decreasing modulus between 0.6–0.4 MPa following which, between 0.4–0.2 MPa, the stress line shifts downward to lower values. At steady state, the stress,
  , after 30 d is computed as 478 kPa for the
  0.4 MPa case. This behavior can be understood by recognizing that the von Mises stress is a 'uniaxialization' of the state of stress, given by the difference between tangential and radial stress in this case (equation (30)), and hence, different factors compete for influence. When the BM is normal, owing to high pressure differences between the tumor periphery and stroma, the gradient in the radial stress across the BM is also high, and the tangential stress is influenced not only by the high tumor pressures but also by low strains. When the BM is degraded pathologically, the tangential stress decreases with lower tumor pressures yet increases due to the higher strains, while the radial stress gradient varies in proportion with tumor pressure.
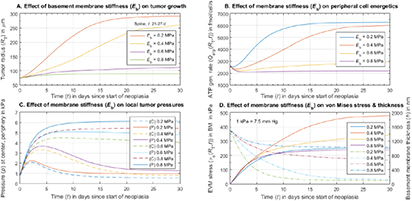
Figure 5. Perturbation simulations demonstrate the effect of stiffness variations of the BM on tumor growth dynamics, ATP (exergy) generation rates at the tumor-membrane boundary, local tumor pressures at the center (C) and periphery (P), i.e. the tumor–BM boundary, and the effective von Mises stress at the tumor–BM interface (solid lines) and thickness of the BM (dotted lines). Some of these variables are presented in volume-averaged form in the sequel publication [1].
Download figure:
Standard image High-resolution imageIt is useful to examine the cumulative or net change in these output variables over the time span of the simulation, i.e. 30 d. These data, calculated as a percent change from their initial value, are shown in figure 8(left). The plot shows the relative changes of the tumor radius and BM thickness, which are equal to the net radial and thickness strains, respectively. As alluded to earlier, a dramatic increase in the tumor radial strain from ca 21 to 296% occurs when the BM stiffness is decreased from 0.8 to 0.2 MPa. In addition, as the sensitivity analysis at a fixed BM stiffness of  2 MPa in figure 6 verifies, the simulations consistently compute low net radial strains at BM values higher than 0.6 MPa suggesting a transition in the vicinity. The plot also documents a significant relative drop in local tumor pressures and relative increase in ATP generation with decreasing BM stiffness. Specifically, while the pressure at the periphery increases by ca 660% over the growth period for the stiffer membrane (
 0.8 MPa), it increases only by ca 20% for the softer membrane (
 0.2 MPa). The plot of ATP generation in the peripheral cells captures an interesting feature of a net decrease of ca 18% for the stiff membrane in contrast to a corresponding increase of ca 136% for the softer membrane that suggests that the cells in the latter case have a better access to nutrients due to the thinning membrane.
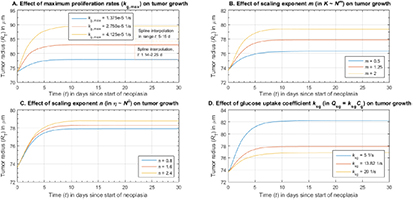
Figure 6. Results show the effect of variation of maximum specific growth rate of cells,  , the pressure scaling exponent,
  , the viscosity scaling exponent,
  , the glucose uptake coefficient,
  , on tumor growth dynamics at fixed Eb = 2 MPa.
Download figure:
Standard image High-resolution imageFigures 6–8(right) show the results of sensitivities of the dynamics to the following parameters in the vicinity of their arbitrarily-chosen, experimentally-supported 'baseline' set of values shown in table 1, which are also used in the first case-study of the sequel [1]. As shown in figure 6, for variation in the maximum specific growth rate of cells,  , we examined values that were twice and thrice the baseline value. From an initial value of ca 73.6 μm, the net radial strain of the tumor increases from ca 5.8 to 21.5% as
  , which represents the efficiency of neoplastic growth rates, is doubled and trebled. In the second sub-plot, the strain at the new steady state changes only from ca 3.6 to 7.8%, as the modulus exponent,
  , which characterizes the influence of the number density of cells on their stiffness, is changed from 0.5 to 2. In the third graph, the changes to the net radial strain are even smaller: from ca 5.8 to 7.0%, as the viscosity exponent,
  , which represents the fluidity of the cell cluster in relation to cell number density, is changed from 0.8 to 2.4. The mass transfer coefficient for glucose uptake by cells,
  , has an inverse effect—as seen in the fourth sub-plot, the strain decreases from ca 11.7 to 4.4%, as the uptake coefficient is increased from 5 to 20 s−1.
As described earlier, the parameter cytosity represents the volume fraction of cells within the tumor while the remainder volume is occupied by intratumoral ECM. Choosing an appropriate value for this term is a little more nuanced than others, as it helps describe the creeping flow of the growing number of tumor cells via the velocity-explicit Darcy law without resorting to the solution of the less wieldy, velocity-implicit Stokes' equation. In our simulations, we choose a value as close to unity as physically imaginable, a la aerogels, while simultaneously allowing for the intratumoral ECM structure to move and reconfigure itself in relation to the dynamic, nearly-biphasic flow field. The influence of this parameter on the results is shown in figure 7 (top left). This subplot indicates that the choice of cytosity does have a moderate, but significant, influence on the system dynamics and is, therefore, a key candidate for future experimental investigations. A drop in the cytosity from 98 to 80% shifts the net radial strain of the new homeostatic steady state from ca 5.8 to 13.8%. The second subplot in figure 7 shows the effect of initial or undeformed or stress-free cell stiffness on the tumor growth dynamics. Similar to the parameters  and
and  discussed in figure 6, stiffer cells (higher initial moduli) mildly increase the net volume expansion of the tumor with other parameters held constant. A ca 4.4% increase in net radial strain was computed for a five-fold increase in initial cell stiffness from 1 to 5 kPa. This increase is small, apparently due to the stronger influence of the 1000-times stiffer BM at 2 MPa in damping the growth.
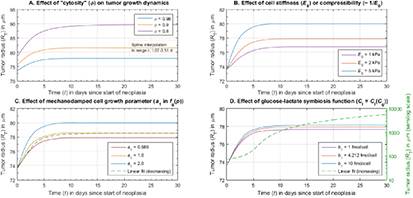
Figure 7. Results show the effect of variation of cytosity or the volume fraction of cells in the tumor,  , the initial or stress-free cell stiffness,
  , the mechanodamping function,
  , and its associated parameter,
  , the glucose–lactate metabolic symbiosis function,
  , and its associated parameter,
  , on the tumor growth dynamics at fixed Eb = 2 MPa.
Download figure:
Standard image High-resolution imageIn the remaining subplots, we document the effect of the forms of key functions in the model, viz., the mechanotransduction function,  , and the glucose–lactate symbiosis function,
  . These functions have been represented in our model by exponential and hyperbolic forms, respectively, determined via curve-fits to in silico and experimental data detailed in the previous section. The subplot at bottom left of figure 7 shows the simulation of tumor growth dynamics when exponential and linear curve fits are applied to the monotonically-decreasing pressure versus growth rate data, with the former (exponential fit) described by equation (18) and a parametric sweep of
  , and the latter (linear fit) as below with the fit parameters,
  , shown in table 1.
Similarly, the subplot at the bottom right of the figure shows hyperbolic and linear curve fits to the monotonically-increasing-and-saturating glucose–lactate data with the former (hyperbolic fit) described by equation (10) and a parametric sweep of  , while the latter (linear fit) is given by:

The plots document a small change in the output radial strains for sample parametric changes of  and
and  . However, the functional changes show more interesting features. While there appears to be only a small change when the exponential is replaced with a linear fit in the mechanotransduction function,
  , there is a more dramatic change when the hyperbolic is replaced with a linear fit in the case of the glucose–lactate relationship,
  . This is apparent when we see that growth rates monotonically decrease with pressures in the former case and never reach values where the function becomes negative. However, in the latter case, the tumor size shows a large difference when a linear function is chosen to fit the data over a hyperbolic (saturating) function. This appears to be due to the proportional increase in lactate availability for metabolism at higher concentrations of glucose, which are reached when the thinning BM increasingly facilitates glucose transfer from the stroma where the concentration is held at a constant value significantly higher than that in the tumor.
Figure 8 demonstrates the sensitivity of some output variables to variations in key parameters. Several features were discussed in preceding paragraphs, so it suffices to mention that, as concerns the plot on the right, the maximum specific growth rate,  , cytosity,
  , and substrate consumption rate constant,
  , seem to be moderately sensitive in the chosen parametric range (see figures 6 and 7 also), whereas the other parameters show low sensitivity. These results add to the favorability of the theoretical framework and model robustness in this research and provide a foundation for data acquisition in the future via well-designed experiments.

Figure 8. An analysis of the output shown in figures 5–7, that illustrates the sensitivity of the dynamics to key parametric values. Note the x-axes on the left and right figures are in descending and ascending order, respectively.
Download figure:
Standard image High-resolution imageDiscussion
We analyze the results of the theoretical simulations of the previous section and construct a plausible account of the cancer cells' breach of the BM during the growth of malignant tumors that is congruent with both experimental evidence and the laws of classical physics, but is not limited by the reductionism of the latter. Prior to Kelley et al [6], the prevailing perspectives on cancer invasion at early metastasis were—in chronological order—the ostensible proteolytic degradation or dissolution of the BM, which was then outplaced by the non-conflicting invadopoiesis hypothesis, i.e. cancer cells form protrusions akin to podosomes that attach to the BM and, nearly concomitantly, locally proteolyze it via their secretome, and displace/slide or push through the softened BM ('burrowing'), eventually escaping through the tunnel and entering the stroma or ECM. These microscopically-observed protrusions are known as invadopodia, hence the term, invadopoiesis, which signifies its formation and is thought to be genetically regulated. This viewpoint, however, does not provide a satisfactory explanation to many questions, chief of which may be: Is it realistic to assume that a 'flimsy' invadopodium, without additional enablers, is able to burrow or bore through a ca 100–1000-times stiffer BM, normally considered formidable enough to avoid such cellular transgression, notwithstanding the modest chemotactic driving forces across the BM, local proteolysis, and self-propulsive capability of cells? Roughly speaking, this difference in stiffness between cancer cells and the BM seems similar to that between a tennis ball and the racket string-mesh, although size, shape (ball versus string spacing), and contact velocities also help prevent the breach in the latter case just as they would in the former as well. Secondly, given that there is no direct evidence of active 'invadopodic burrowing' through BMs and only circumstantial evidence exists, we believe that the mechanism proposed in this work, viz., neoplastic growth-induced cavitation, or tensile yielding, is more fundamental. This mechanism or hypothesis is based on well-established theories of physics and chemistry vis-à-vis abiotic systems and apparently provides a simpler and better explanation to the experimental observations germane to cancer cell invasion inclusive of invadopoiesis as discussed below. If we invoke Occam's razor—the antithesis of complexity—a simpler explanation, if accurate, is generally more favorable. However, at the opposite end of the dialectical argument, one might invoke Occam's razor again to pose the contrarian question: If cancer cells possess the biomolecular tools, viz., invadopodia, to breach the thinner endothelial BMs in blood vessels where pressure-induced yielding of the BM may be less likely, why would they not use the same strategy or mechanism to breach the epithelial BMs encasing primary tumors? These questions are addressed below with the aid of the theoretical simulations presented in the previous section and further analyzed in the sequel [1].
Figure 9 shows the author's perspective as an engineer–physicist on the inter-relationship between the sciences that is relevant to this research and the trans-disciplinary research field of physical biology or biological physics—where physics and biology, historically espousing different perspectives and methods, meet. All systems at the macroscale—abiotic or biotic—follow the known laws of physics at the very minimum. The description of biotic systems goes beyond these laws into nascent or yet-to-be-discovered territory. Concisely introduced earlier, we shall now demonstrate rudiments of the proof to the conjecture that neoplasia-induced or neoplastic cavitation of the BM may, arguably, be a critical predecessor to cancer cell invasion and metastasis. At the outset, we derive a corollary to the well-established nine hallmarks of cancer [2], viz., oncogenic neoplasia is an inferred hallmark of cancer. This may be interpreted as an increase in the efficiency of tumor cell proliferation and thus, in consonance with biochemical kinetic theory, an increase in the maximum specific growth rate,  , of the Monod-type, ATP-fueled growth law. From this corollary, it is a matter of deductive physicochemical logic to arrive at each of the following results. Initially, oncogenic neoplasia drives the influx of water and nutrients into the tumor (high glucose consumption is seen via PET scans). Moreover, the nutrients are solutes dissolved in water that, on account of its incompressibility, requires the volume of the tumor to expand. Thirdly, the pressure in the swelling tumor rises (pressure is always compressive) and, concomitantly, raises the tensile stress in the BM. A normal BM, finally, suppresses the cell and tumor growth rate via mechanotransduction; however, a flawed BM—say via local proteolysis that creates notches—can become vulnerable to cavitation events as described further below.
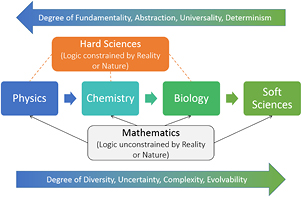
Figure 9. A perspective on the interrelationship between the scientific disciplines and mathematics, and their principal pursuits. Also see Volkenstein [60], and Zallen [61].
Download figure:
Standard image High-resolution imageThe load-deformation or stress–strain behavior of typical elasto-plastic solids is shown in figure 10. Ductile materials, pertinent to the ongoing discussion of BM cavitation, display an elastic regime where the load-deformation behavior is linear and reversible, i.e. a deformed or strained material returns to its undeformed, stress-free state once the load is removed. To recall, strain is defined as the departure of material dimensions from its stress-free state [62]. However, beyond a threshold known as the yield point, the mechanical behavior or rheology turns nonlinear and irreversible with the stress–strain curve likely exhibiting a maximum followed by an end-point known as the breakage, rupture, or failure point. This regime (shaded in lighter blue in figure 10) is known as the plastic regime, and if a once solid material's deformation reaches this zone, it does not return to its original dimensions when the load is removed. Instead, it travels to a different equilibrium state of quasi-permanent deformation as shown in the figure. The stress at the maximum of the stress–strain curve is known as the ultimate tensile strength, or simply, tensile strength, while the stress at failure is known as the (ultimate) breakage or rupture strength.
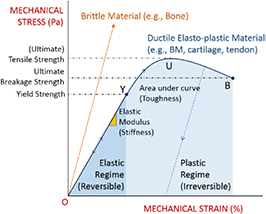
Figure 10. Typical load-deformation or stress–strain behavior of ductile (elasto-plastic) and brittle (elastic) biomaterials. Basement membranes are elasto-plastic; cavitation, viz., 1 or 2D nanoscale tensile rupture, occurs near the yield point under uniaxial or biaxial stretching, respectively.
Download figure:
Standard image High-resolution imageAlluded to earlier, Kelley et al [6] concatenate recent in vivo experimental evidence on the diverse array of strategies or mechanisms that malignant cells appear to actively employ or passively utilize while making their metastatic journey from the primary tumor site to a secondary tumor site. A central theme of the present duology is the proposition that what appears phenomenally diverse may well be emergent from a fundamental noumenon or set of physical principles. Specifically, the diverse strategies may have underlying or related commonalities. We draw on three independent research works of Buehler [63, 64], Pawlak [65], and Halfter [66] and their co-workers to fortify the central argument of the hypothesis proposed in this research. This is shown schematically in figure 11. Buehler et al's notable studies apply large-scale atomistic and molecular modeling techniques to provide a fundamental basis for the deformation and fracture mechanics of biological protein materials (BPMs) such as cytoskeletal filaments, collagen in tendon and bone, and spider silk, among others, thereby, connecting the nano- to macroscales. Many engineering materials such as metals, ceramics, and polymers demonstrate elasto-plastic or ductile behavior as generically sketched in figure 10. However, BPM networks, while displaying these abiotic characteristics, also dynamically adapt or evolve to load application via self-organization, self-assembly, and variable adhesion. BMs are BPMs too, and much of the aforementioned studies on computational biomaterial science are applicable to BMs unequivocally. These researchers also identify the multiscale hierarchical structure of BPMs as the basis for deformation and failure at different scales wherein the inter- and intra-hierarchical interactions, predominantly via weak hydrogen (H) bonds, compete or reinforce biomechanical properties. They also elucidate the critical influence such deformation and failure mechanisms have on diseases such as Alzheimer's disease, Parkinson's disease, and diabetes, in addition to genetic diseases including the Hutchinson–Gilford progeria syndrome, osteogenesis imperfect and, in a relatively nebulous way, cancer.

Figure 11. A conceptual map to provide the rationale for neoplasia-induced or neoplastic cavitation of basement membranes as a critical biomarker of the onset of cancer invasion and metastasis.
Download figure:
Standard image High-resolution image
By way of small angle x-ray scattering (SAXS), SEM and AFM, Pawlak et al demonstrated the cavitation of nanovoids and microvoids in synthetic (abiotic), semicrystalline polymers such as polyethylene and polypropylene, above their glass transitions and during uniaxial or biaxial stretching. They related the mesoscopic cavitation events to the macroscopic tensile yielding of the polymers, which are heterogeneous with respect to inter-dispersed crystalline and less stiff amorphous domains. Halfter et al highlighted the compositional and structural changes that many BMs undergo with aging and discussed the correlation observed between altered mechanical stiffness or softening of BMs to specific pathologies. They cited biomechanical testing that showed that mutations of BM proteins lead to BM instabilities that result in tensile ruptures in blood vessels in addition to pial and skeletal muscle BMs. They also reported recent measurements of BM elastic moduli in the kPa range (lower than values used in this work) indicating a wide range of stiffness in organisms. The biosphere is also replete with examples of growth-induced tensile ruptures of biological membranes, which are other than BMs (e.g. the tensile rupture of the amniotic sac or membrane during childbirth). In light of these works [63–66] and our theoretico-computational results of the previous sections, we reason that neoplasia-induced or neoplastic cavitation is a plausible-to-probable phenomenon during tumorigenesis that could also lead to the formation of invadopodia in combination with electro-mechano-chemotactic gradients across the BM nanovoids, accompanied with stress localization-induced tensile ruptures and/or conformational switches of cell adhesion molecules (e.g. a cadherin switch). Thus, the term 'neoplastic cavitation' is more than a fortuitous happenstance. In the context of this work, it is a genuine pun as it could refer to a conceptual combination of tumor neoplasia and BM plasticity.
The simulations appear consistent with the theoretical considerations, creating realistic and hypothetical scenarios where the von Mises stress of the BM might exceed the yield strength of the BM leading to cavitation and the subsequent invasion of detached tumor cells. Direct experimental verification is, however, not possible at this stage due to the lack of data and the challenges involved in acquiring them. At best, we can use tensile testing data on the human anterior lens capsule—the thickest BM in the body where a monotonic decrease in breakage strength from ca 17.5 to 1.5 MPa was recorded on BMs derived from healthy donors aged from ca 0.5 to 98 years old, respectively [59]. Note that while BM thickness monotonically increases with age—ca 4 to 30 μm across the data range—the breakage strength as such is thickness-independent at any given age in that it is an intrinsic property of the material. The documented data included age-specific values of ca 4.7 and 2.5 MPa for healthy (normal) sample donors aged 65 and 88 years, respectively. A ductile material typically yields prior to attaining the maximum on the stress–strain curve, and hence, it might be reasonable to surmise that cavitation occurs significantly lower than the above numbers, especially considering pathological effects in addition to carcinoma in older patients. As mentioned earlier, if we consider a tenfold-softening of the BM due to the carcinoma, a tenfold-reduction of the breakage strength appears to be a reasonable approximation. Therefore, an estimate of the breakage strength, σu, for the carcinoma-softened BMs of 65- and 88-year-old humans may be taken as ca 0.47 and 0.25 MPa, respectively, if the corresponding stiffness or elastic modulus, Eb, was reduced from 2 to 0.2 MPa. Our 1D model was able to demonstrate that a BM ca 1.5 μm-thick initially probably encounters tensile stresses in the order of ca 0.1–0.5 MPa during neoplasia (see the bottom right plot of figure 5 or the left plot of figure 8). In tandem with additional results, we clearly demonstrate in the sequel [1] that BM cavitation does occur in the 88-year-old patient, but not the 65-year-old patient when both exhibit neoplasia and a tenfold BM softening induced by the carcinoma (see figure 10 of [1]). In 3D reality, where local proteolysis by proto-invadopodia might create molecular- or mesoscale notches, and sharp spatial gradients thus come to exist, a significantly-taut BM is more likely to allow a crack to propagate through its thickness, thus cavitating a 'nanovoid'. As Fung indicates [56], it is much easier to cut twine with a blunt pair of scissors when the former is taut, not relaxed.
In closing, we would like to point out that the arguments presented in this section are inferential and not demonstrative in the rigorous sense. However, given the complexity of the question posed and the lack of specific evidence on the breaching of BMs and cancer invasion, these physics-based arguments—causative rather than correlative—make an enduring case for focused research in the future. Polya [13] described the logic of such plausible reasoning in substantial mathematical detail and its far-reaching relevance in science. While he affirmed that plausible reasoning has no rules like demonstrative reasoning, he lucidly enunciated rules of a different kind, viz., legal rules in contradistinction to logical rules. He regarded these as rules of admissibility in scientific discussion, not unlike those valued in a court of law where only circumstantial evidence may exist. Following the in silico evidence presented in this work, the concatenation of key experimental evidence and theoretical concepts from literature, the arguments presented in this section, and an application of Polya's rules (see Pearl [67] for instance), we infer that the plasticity of the BM and its loading (tensile stress) history are likely to be critical in cancer invasion and metastasis. All four experimental case-studies presented in Kelley et al may be rationalized based on the conceptual map described in this work, and this simple exercise is left to the reader to test and verify.
Conclusions
We have developed a biological prototype and a theoretical nonlinear model of the growth of malignant tumors that culminates in cancer invasion and metastasis. The model is used to demonstrate the plausibility that the onset of stromal invasion of carcinomas is marked by the neoplasia-induced cavitation or tensile yielding of the BM that ensheathes the tumor. The analysis applies methods of plausible inference, such as those elucidated by Polya, to the computer simulation results that are supported by recently-published ex vivo and in vitro data, noting the lack of direct evidence of invasion events in vivo. The macroscopic 'mechano-metabolomics' model is a first, distinct from predecessor mathematical models in three ways. Initially, it treats the BM as a thin, solid entity separate from the fluid ECM, imposing a measured mechanical and biochemical kinetic constraint on proliferating, fluid cells through the mechanotransduction principle. Secondly, it bases neoplastic cell growth and apoptotic death as directly dependent on the available energy (exergy) in the form of ATP generated via the symbiotic metabolism of glucose and lactate. Finally, our model applies poroelasticity and scaling laws to derive equations of state that incorporate cell compressibility as well as cell–cell and cell–matrix adhesions or linkages. The mechanochemical theory is thus a coupling of the mechanics of fluid–solid interactions and metabolic exergy-dependent cell growth and death kinetics, with a goal to identify a minimalist physical description that explains biological observations as concerns oncogenesis. The model, free of adjustable parameters, consistently simulates the homeorhetic dynamics and steady states (homeostasis) of the tumor–membrane system. These perturbation simulations confirm that neoplasia can lead to BM cavitation followed by cancer cell invasion, and, hence, the initial conjecture is indeed plausible and merited for experimental verification of probabilities. To further these plausibility studies, we rationalize similar perturbation simulations via far-from-equilibrium thermodynamics and dynamical systems theory, which is the subject of the subsequent article [1].
Acknowledgments
I am very grateful for the interest, expertise, and partial financial support provided by Dr Kenneth Pienta of the Brady Urological Institute and Oncology at the Johns Hopkins School of Medicine. Many thanks as well to Dr Sean Sun of Mechanical Engineering and the Physical Sciences and Oncology Center for his key, early contributions toward developing the theoretical framework of this research and for thoughtful critiques of the final manuscripts. Thanks also go to the following colleagues at Johns Hopkins, viz., Charlotte O'Donnell for her artistic rendition in the form of figure 1, Dr Eric Johnson for his primer on biochemistry, Dr Donald Coffey for his enlightening discussions on oncology, Dr Shanm Ganapathy-Kanniappan and Dr Takumi Hiraishi for their educative conversations on tumor metabolism, and Denise Link-Farajali for editing the final manuscripts.