
Abstract
Glucose concentration is considered an indicator for the diagnosis of diabetes, highlighting the importance of accurate glucose detection. Non-enzymatic electrochemical sensors have been extensively studied for glucose detection applications, with nanocomposites composed of molybdenum disulfide (MoS2) and gold nanoparticles (Au NPs) demonstrating high catalytic activity. In this study, a nanocomposite material composed of MoS2 and Au NPs (MoS2/Au) was synthesized and employed to construct a non-enzymatic electrochemical glucose biosensor. The detection limit of this sensor was explored, reaching as low as 1 mM. Additionally, compared to MoS2, the MoS2/Au nanocomposite exhibited a higher linear correlation coefficient and sensitivity, with a linear range of 1–25 mM and a sensitivity of 417.556 μA mM−1 cm−2. The sensor demonstrated excellent performance within the range of human blood glucose concentrations, showing potential for real-time monitoring and precise measurement of glucose levels. Furthermore, it exhibited good stability and reproducibility. These findings indicate the potential applications of MoS2/Au in biosensors and immunoassays.

Original content from this work may be used under the terms of the Creative Commons Attribution 4.0 licence. Any further distribution of this work must maintain attribution to the author(s) and the title of the work, journal citation and DOI.
1. Introduction
Diabetes increases the risk of numerous complications, directly impacting individuals' health and daily lives [1, 2]. Consequently, reliable and rapid glucose concentration detection is crucial in biotechnology and clinical diagnostics. Various glucose detection methods have been developed [3–7], among which electrochemical detection has been widely used due to its rapid response, high sensitivity, ease of operation, and potential for miniaturization [8–11]. Electrochemical sensors are categorized into enzymatic and non-enzymatic sensors, with non-enzymatic sensors avoiding the use of enzymes, thereby reducing detection costs and operational complexity, while also enhancing sensor stability and reproducibility [12–14]. Therefore, monitoring diabetes through glucose detection using non-enzymatic electrochemical sensors is significant.
Various materials have been reported for non-enzymatic electrochemical glucose detection, including metals, metal oxides, and carbon materials. One study reported a composite of polyaniline particles with Co3O4 nanorods, achieving a glucose detection limit (LOD) of 0.676 μM and a sensitivity of 3.024 μA μM–1 cm–2 [15]. Another study developed a bimetallic nanocomposite of Cu nanowires (Cu NWs) and Ag nanosheets (Ag NSs), achieving a sensitivity of 2033 μA mM−1 cm−2 and a linear range of 0.0015–4.02 mM for glucose detection [16]. Additionally, a graphene-based three-dimensional silver nanoplate sensor demonstrated ultra-high sensitivity of 2 × 10¹¹ μA mM−1 cm−2 and a detection limit of 2 nM for glucose [17]. However, previous studies have noted that metal oxides suffer from low conductivity, resulting in lower sensitivity. While metal materials exhibit high sensitivity, they face issues of oxidation and agglomeration. Addressing these challenges, transition metal dichalcogenides (TMDs) have emerged as novel materials in electrochemical detection due to their structural diversity and excellent optoelectronic properties [18–21]. MoS2, in particular, exhibits high electrocatalytic potential due to its tunable bandgap, large surface area, and abundant active sites [22–24]. Its large specific surface area also serves as an excellent support for metal nanoparticles, preventing their agglomeration. Combining MoS2 with metal materials can enhance MoS2's electron transfer capability and catalytic activity. For instance, Zhai et al from our research group constructed an excellent glucose electrochemical sensor by compositing gold nanoparticles (Au NPs) with MoS2 [25] Another study developed a non-enzymatic electrochemical glucose sensor by modifying MoS2 with silver nanoparticles [26]. However, the detection limit of non-enzymatic electrochemical glucose sensors based on MoS2/Au nanocomposites has not been explored. Therefore, constructing a non-enzymatic glucose sensor using MoS2/Au nanocomposites to detect glucose within the human blood glucose concentration range and exploring its detection limit is of significant research value.
This study utilizes MoS2/Au composites to construct non-enzymatic electrochemical glucose sensors and analyzes their morphology and structure, exploring their detection limits and sensitivity to glucose. The repeatability and stability of the MoS2/Au glucose sensor were also verified. The results indicate that the enzyme-free sensor based on MoS2/Au composites exhibits significant performance in glucose detection within the range of human blood glucose concentrations. Its rapid response speed allows for real-time monitoring, while its low detection limit and wide linear range provide potential for precise glucose concentration measurements, offering a new option for blood glucose monitoring in diabetic patients. Additionally, this study provides new insights for applications in food safety and environmental monitoring.
2. Experimental
2.1. Material
Thiourea (CH4N2S) and sodium molybdate (Na2MoO4) were purchased from Sigma Aldrich, Cetyltrimethylammonium bromide (CTAB), chloroauric acid (HAuCl4·3H2O), graphite powder, and N-Methylpyrrolidone (NMP) were obtained from Aladdin. Sodium hydroxide (NaOH), hydrochloric acid (HCl), potassium dihydrogen phosphate (KH2PO4), dipotassium hydrogen phosphate (K2HPO4), and glucose (C6H12O6·H2O), dipotassium hydrogen phosphate (K2HPO4·3H2O), potassium ferrocyanide (K4[Fe(CN)6]·3H2O) were purchased from Beijing Chemical Factory, while acetylene black (ACET) and polyvinylidene difluoride (PVDF) were purchased from Macklin Reagent. All reagents used were of analytical grade. Highly purified water was used throughout the entire experiment.
2.2. Characterizations
The microstructures of the samples analyzed using a field emission scanning electron microscope (SEM, Regulus 8100) and transmission electron microscopy (TEM, FEI Tecnai), with working voltages of 5 kV and 20 kV for SEM and TEM, respectively. The structural analysis of the samples was was analyzed by x-ray diffraction (XRD, Rigaku-D-max2550) equipped with Cu-Kα radiation (λ = 0.154 nm), operating at 40 kV and 30 mA, with a scanning rate of 2°/min. Raman spectroscopy characterization was performed using a 532 nm He-Ne laser (LabRAM HR E). An electrochemical workstation (CS350) was employed for glucose electrochemical detection.
2.3. Synthesis of MoS2/Au
MoS2 and MoS2/Au were synthesized using hydrothermal and thermal reduction methods, scheme as shown in figure 1. Initially, 1.0 g of Na2MoO4 and 1.4 g of CH4N2S were added to 45 ml of deionized water, followed by the addition of 0.5 g of CTAB after stirring. After the solution is fully mixed, the pH was adjusted to 8. The mixed solution was then transferred into a reactor and heated at 240 °C in a forced air oven for 48 h. Upon completion of the reaction, the product was washed with deionized water and absolute ethanol, centrifuged to collect the precipitate, and dried in an oven at 40 °C to obtain MoS2 powder. Subsequently, 6.5 × 10⁻⁴ M of MoS2 was added to a boiling solution of HAuCl4·3H2O. After 10 min, heating was stopped, and the solution was allowed to cool naturally. The precipitate was collected by centrifugation, washed with deionized water and absolute ethanol, and dried to obtain MoS2/Au.

Figure 1. Schematic illustration of MoS2 and MoS2/Au.
Download figure:
Standard image High-resolution image2.4. Glucose detection
MoS2 and MoS2/Au powders were mixed with PVDF, ACET, and graphite powder in a mass ratio of 74:6:10:10 in NMP solvent. The mixture was thoroughly ground into a paste and coated onto nickel foam (NF) to prepare MoS2 and MoS2/Au electrodes. Cyclic voltammetry (CV) tests were conducted on the electrochemical workstation. The electrolyte used was a phosphate buffer solution containing 30 mmol/L K4[Fe(CN)6]·3H2O and 30 mmol/L K3[Fe(CN)6]. An Ag/AgCl electrode was used as the reference electrode, Pt as the counter electrode, and MoS2 or MoS2/Au as the working electrode. The prepared MoS2 and MoS2/Au electrodes were immersed in the electrolyte, and different concentrations of glucose solution were added for CV testing.
3. Results and discussion
3.1. Morphology and structure
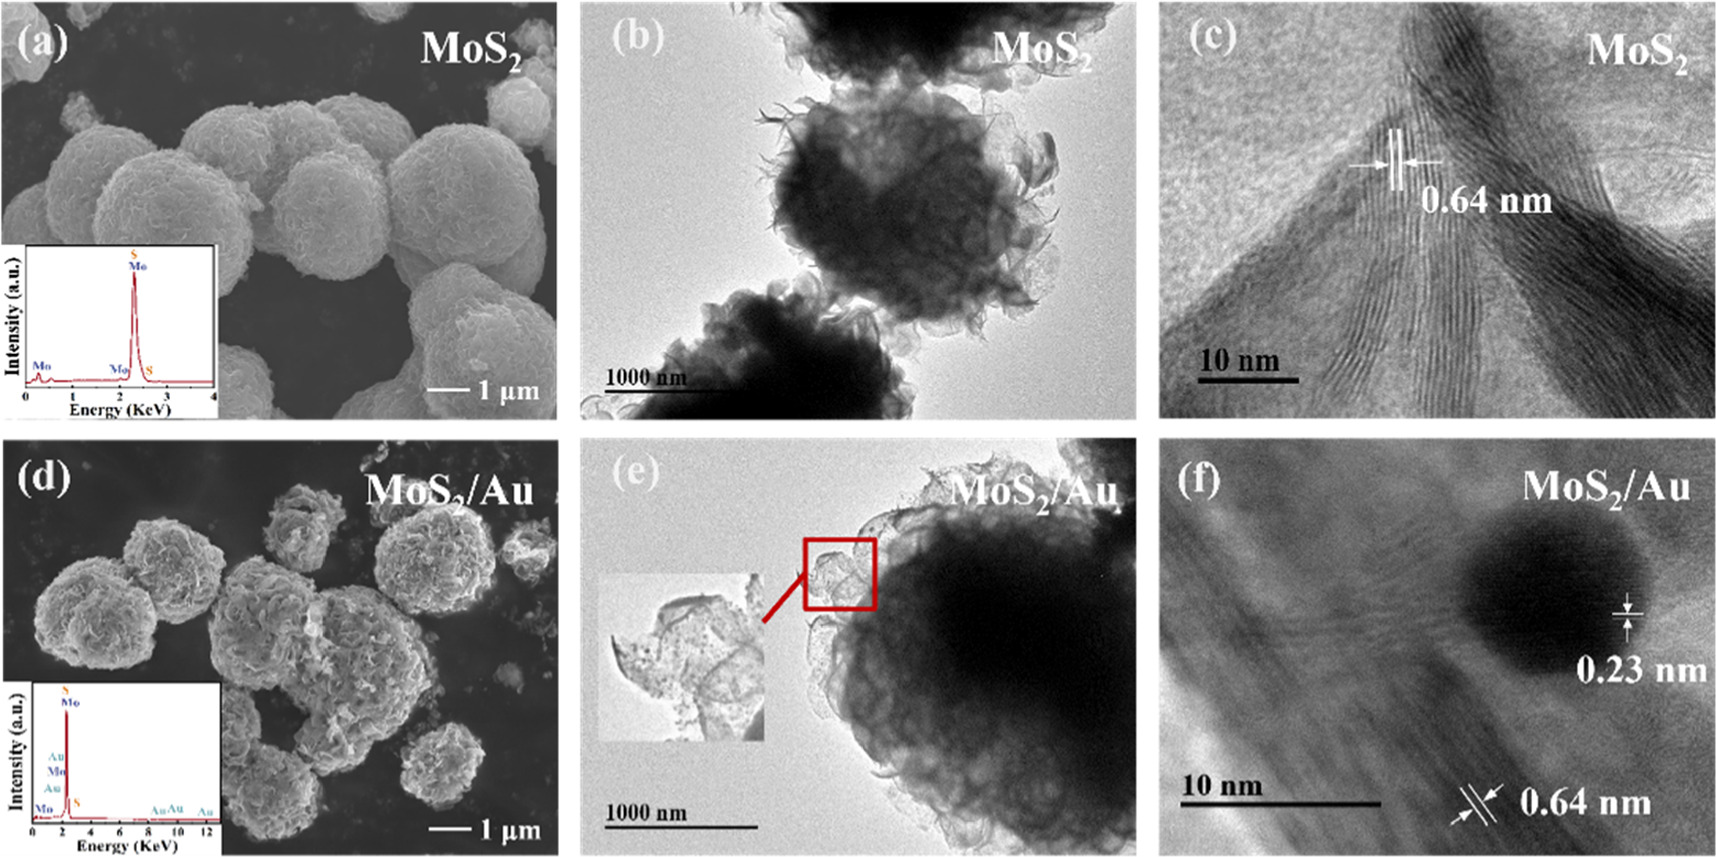
To investigate the properties of the prepared electrode materials, the morphology of the samples was first observed using SEM and TEM. Figure 2(a) shows the SEM image of MoS2, revealing numerous interlaced petal-like nanosheets forming a three-dimensional flower-like structure, typically around 2 μm in size. The inset displays the EDS spectrum of MoS2, indicating the presence of only Mo and S elements, confirming the absence of impurities. The further TEM image (figure 2(b)) illustrates the layered structure of MoS2, with wrinkles due to the flexibility of the atomic layers, forming a flower-like structure. The HRTEM image in figure 2(c) shows that the average lattice fringe spacing of MoS2 is approximately 0.64 nm, which is consistent with the theoretical spacing of the (002) plane of hexagonal 2H-MoS2. Figure 2(d) shows the SEM image of MoS2/Au, where Au NPs are observed attached to the MoS2 structure, confirming the formation of the MoS2/Au composite while maintaining the morphology of MoS2. The inset displays the EDS spectrum of MoS2/Au, indicating the presence of only Au, Mo, and S elements, with no other impurities. In the TEM image (figure 2(e)), Au NPs can be clearly seen decorating the MoS2 nanosheets, with individual Au NPs around 5 nm in size. The HRTEM image (figure 2(f)) shows that the lattice fringe spacing of MoS2 is approximately 0.64 nm, while the lattice fringe spacing of Au NPs is about 0.23 nm, indicating that the Au NPs do not alter the crystal structure of MoS2 upon composite formation.

Figure 2. (a)–(c) SEM, TEM and HRTEM images of MoS2, (d)–(e) SEM, TEM and HRTEM images of MoS2/Au.
Download figure:
Standard image High-resolution imageThe crystal structure and purity of the samples were characterized using x-ray diffraction. The XRD patterns of MoS2 and MoS2/Au are shown in figure 3. As displayed in figure 3(a), the diffraction peaks of MoS2 appear at 2θ = 13.88°, 33.06°, 39.3°, and 58.72°, corresponding to the (002), (101), (103), and (110) planes of MoS2, respectively. The diffraction peaks of 2H-MoS2 in the hexagonal system are consistent with the standard card. The sharp and prominent peak at the (002) plane indicates a preferred growth orientation along this plane. The absence of strong diffraction peaks corresponding to the (105) plane suggests suppressed growth of MoS2 on the (105) plane. Furthermore, no impurity peaks from other elements were observed, indicating the high crystallinity of the prepared MoS2 nanoflowers. Figure 3(b) shows that the diffraction peaks of MoS2/Au at the (002), (111), and (110) planes are consistent with the standard card (PDF#75–1539) of MoS2. The other four diffraction peaks correspond to the (111), (200), (220), and (311) planes of Au. No impurity peaks from other elements were detected, indicating the high purity of the synthesized MoS2/Au composite.

Figure 3. XRD patterns of MoS2 (a) and MoS2/Au (b), Raman spectra of MoS2 and MoS2/Au.
Download figure:
Standard image High-resolution imageTo further investigate the lattice vibration modes of MoS2 and MoS2/Au, Raman characterization was performed. Figure 3(c) shows the Raman spectra of MoS2 and MoS2/Au. The g mode represents in-plane vibrations, while the A1g mode represents out-of-plane vibrations. The g and A1g peaks of MoS2 appear at 376.43 cm−1 and 403.35 cm−1, respectively, with a peak difference of 25.92 cm−1, close to the reported value for bulk MoS2. For the MoS2/Au composite, the g and A1g peaks are located at 377.76 cm−1 and 403.79 cm−1, with no additional peaks, indicating that the presence of Au NPs did not affect the MoS2 nanoflowers during the preparation process. Additionally, the enhanced Raman signal is attributed to plasmon resonance induced by the Au NPs under laser excitation, enhancing the Raman intensity of MoS2.


3.2. Study on electrochemical characteristics
Figure 4 shows the CV curves for NF, MoS2, and MoS2/Au electrodes. As can be seen, both MoS2 and MoS2/Au electrodes exhibit a pair of symmetric redox peaks, while the NF electrode shows almost no redox peaks and a relatively small integrated area. In contrast, the redox peaks for the MoS2 and MoS2/Au electrodes are more pronounced, with larger integrated areas. It is evident that the MoS2/Au electrode has a larger integrated area and higher peak current value compared to the MoS2 electrode. This indicates that the modification with Au nanoparticles not only increases the specific surface area of the electrode but also enhances the electron transfer rate, making electron transfer at the electrode surface more facile and thereby improving the electrochemical performance.

Figure 4. Cyclic voltammetry curves of bare NF, MoS2 electrode, and MoS2/Au electrode.
Download figure:
Standard image High-resolution image3.3. Detection and performance study of glucose
To demonstrate the application of MoS2/Au in non-enzymatic glucose sensing, CV curves of MoS2 and MoS2/Au electrodes at different glucose concentrations were obtained, along with the corresponding linear relationship between peak oxidation current and glucose concentration. As observed in figures 5(a) and (c), both MoS2 and MoS2/Au display symmetric oxidation and reduction peaks at different glucose concentrations, indicating a reversible redox process at the electrode interface. The peak current increases with the concentration, demonstrating successful electron transfer between the electrode and glucose, leading to electrocatalytic oxidation. The peak current of the MoS2/Au electrode is significantly higher than that of the MoS2 electrode, indicating that the modification with Au nanoparticles enhances the catalytic activity and specific surface area of the electrode, resulting in more electrocatalytic active sites, better conductivity, and improved electron transfer capability, thus enhancing the electrocatalytic oxidation of glucose. As shown in figures 5(b) and (d), the peak oxidation currents of both MoS2 and MoS2/Au electrodes exhibit a good linear relationship with glucose concentration, with linear detection ranges of 1–25 mM and sensitivities of 373.226 μA mM−1 cm−2 and 417.556 μA mM−1 cm−2, respectively. The LOD for both electrodes is 1 mM. The linear equations are as follows:


Figure 5. CV curves of MoS2 (a) and MoS2/Au (c) electrodes at different glucose concentrations; MoS2 (b) and MoS2/Au (d) linear relationship of glucose concentrations and oxidation peak currents (scan rate is 15 mV s−1).
Download figure:
Standard image High-resolution imageCompared to the MoS2 electrode, the MoS2/Au electrode exhibits higher linear correlation coefficient and sensitivity.
Table 1 compares the performance of MoS2 and its composite materials in the field of electrochemical glucose biosensing. It can be seen that electrochemical non-enzymatic glucose sensors based on MoS2/Cu, AuNPs/CuO/MoS2, and MoS2/Ag exhibit higher sensitivity but narrower linear ranges. Our prepared MoS2/Au sensor has a wide linear range of 1–25 mM. Sensors based on MoS2/Au-Pd and MoS2/CuS have lower detection limits and wider linear ranges, but the MoS2/Au sensor shows higher sensitivity, indicating its potential for accurate glucose concentration detection, providing a new monitoring option for diabetes patients.
Table 1. Comparison of the non-enzymatic glucose biosensors based on MoS2 nanocomposites.
| Materials | Linear range | LOD | Sensitivity | References |
|---|---|---|---|---|
| MoS2/Cu | 0–4 mM | — | 1055 mA mM−1 cm−2 | [27] |
| MoS2/Au-Pd | 0.5–20 mM | 0.4 mM | — | [28] |
| AuNPs/CuO/MoS2 | 0.5μM-5.67 mM | 0.5 μM | 872.71 μA mM−1 cm−2 | [29] |
| MoS2/Ag | 1–15 mM | 1 mM | 46.5 μA nM−1 cm−2 | [26] |
| MoS2/CuS | 0.1–11 mM | 1.52 μM | 252.71 μA mM−1 cm−2 | [30] |
| MoS2/Au | 1–25 mM | 1 mM | 417.556 μA mM−1 cm−2 | This work |
The reusability of the sensor is crucial for its practicality and economic feasibility. To investigate the reusability of the glucose sensor, the previously tested MoS2/Au electrodes were washed with NMP and air-dried at room temperature for subsequent tests. Measurements were performed at a scan rate of 15 mV s−1 with a glucose concentration of 5 mM. The electrodes were tested multiple times over 2, 4, and 6 days. Figures 6(a) and (b) depict the CV curves of the MoS2/Au electrode at different test periods and the relationship between current intensity ratio and test period, respectively. I0 represents the initial current response of the MoS2/Au electrode, and I represents the current response obtained at a specific test period. As shown, the oxidation peak current exhibits minimal fluctuation over different test periods. After 6 days of storage, the electrode still retains 91.22% of its initial current response, indicating good reusability of the sensor.

Figure 6. (a) CV curves of MoS2/Au at different testing cycles, and (b) the relationship between the intensity of oxidation peak current and the cycle variation (Scan rate is 15 mV s−1, glucose concentration is 5 mM).
Download figure:
Standard image High-resolution imageThe stability of the sensor is critical for the reliability of continuous glucose detection. Figures 7(a) and (b) show the CV curves of the MoS2/Au electrode and the relationship between oxidation peak current and scan number during eight consecutive tests at a glucose concentration of 5 mM. As observed, the peak current remains relatively constant after eight consecutive CV tests under the same test conditions, demonstrating the sensor's good stability.

Figure 7. (a) CV curves of MoS2/Au after 8 consecutive scans, and (b) the relationship between the oxidation peak current and the number of scans (Scan rate is 15 mV s−1, glucose concentration is 5 mM).
Download figure:
Standard image High-resolution image
4. Conclusion
In this study, MoS2/Au composites were successfully synthesized using hydrothermal and thermal reduction methods and characterized using SEM, TEM, and XRD. The results indicated that the synthesized MoS2/Au composites possess a particle size of approximately 2 μm and exhibit a good crystalline structure. Utilizing these composites, a non-enzymatic electrochemical glucose sensor was constructed, demonstrating effective electrochemical oxidation of glucose within the physiological glucose concentration range. The sensor exhibited a detection limit of 1 mM, a linear range of 1–25 mM, and a sensitivity of 417.556 μA mM−1 cm−2. Additionally, the sensor retained 91.22% of its initial response after 6 days and demonstrated good reproducibility with an RSD of 1.138%. Therefore, the constructed MoS2/Au non-enzymatic electrochemical glucose sensor holds significant potential for future applications, offering valuable insights for clinical diagnostics and robust support for rapid detection in fields such as food and pharmaceuticals.
Acknowledgments
This work is supported by the '111' Project of China (D17017), the National Natural Science Foundation of China (62174015).
Data availability statement
All data that support the findings of this study are included within the article (and any supplementary files).