
Abstract
This study focuses on developing and characterizing multifunctional composites based on the diglycidyl ether of bisphenol-A (DGEBA) epoxy matrix. The aim is to enhance fire resistance and electrical conductivity properties for applications in various fields. To achieve this, aluminum tri-hydroxide (ATH) was incorporated as a flame retardant (FR) agent, while polyaniline (PANI) was added to impart electrical conductivity. The composites were categorized into three groups: the first containing flame retardant (FR), the second containing PANI for conductivity, and the third containing both PANI and FR for combined effects. E 60-FP emerged as the optimal multifunctional composite, exhibiting superior mechanical properties among the tested formulations. Thermogravimetric analysis (TGA) results provided valuable insights into the thermal stability of E 60-FP, revealing that it retained 42% of its initial mass at a temperature of 600 °C. Additionally, the composite achieved a V-0 rating in the UL 94 test, confirming its excellent fire resistance. Notably, E 60-FP displayed impressive mechanical strength, with a tensile strength of 7.2 MPa and a tensile modulus of 1117.6 MPa. Its flexural strength and modulus were measured at 31.2 MPa and 2800.2 MPa, respectively. Furthermore, the composite E 60-FP exhibited remarkable electrical conductivity, measuring 6.1 × 10⁻⁶ S cm−1. These findings highlight the potential of DGEBA epoxy composites containing PANI and ATH as promising materials for applications requiring fire resistance and electrical conductivity properties.
Export citation and abstract BibTeX RIS

Original content from this work may be used under the terms of the Creative Commons Attribution 4.0 licence. Any further distribution of this work must maintain attribution to the author(s) and the title of the work, journal citation and DOI.
1. Introduction
Advancements in material science are leading us towards the development of smart materials enabled by multi-functionality. Epoxies and resins are widely used in high-tech industries to create complex parts for automobiles, space shuttles, and aircraft. Moreover, they have replaced conventional materials and are used in other applications, e.g. electrical applications, flame retardancy, and as construction materials for buildings [1–4]. However, currently, the need for multi-functional epoxy has begun to multiply due to its durability, mechanical strength, thermal stability, electrically conductive, flame retardant, and lightweight.
Despite the exceptional properties, the epoxies lack fire resistance. The problem of flammability has been overcome by the incorporation of flame retardant (FR) materials via the addition method [5]. The addition route involves physical mixing, and the reaction route involves a chemical reaction between the epoxy/resin and the FR entity. The most commonly used FR materials are magnesium hydroxide (MH), aluminum tri hydroxide (ATH), ammonium polyphosphate (APP), antimony tri hydroxide (ATH), organo-phosphorous, organo-silicone, etc [5–7]. These materials can also be used in various combinations to obtain a synergetic effect to resist or suppress fire [8–10]. In comparison to flame hydroxides, aluminum hydroxide has a lower decomposition temperature than magnesium hydroxide, and therefore the latter is more stable at higher temperatures [6, 11], and [13]. The foremost goal is to delay the ignition process and burning of material, which allows easy evacuation of humans from the affected zone [14]. Furthermore, it prevents structural and property damage [15–19].
Normally, epoxy is a non-conductor, but it can be made intrinsically conductive by using different conducting polymers (CPs). The conductive materials gained popularity because of their lightweight, corrosion resistance, and easy processability. These materials include polyaniline (PANI), polypyrrole (PPy), graphene oxide (GO), CNTs, etc [5–7]. However, these materials have potential to be used as FR in combination with other FR like phosphorous, nitrogen of silicone. But, when used alone and exposed to fire, cannot give high UL94 rating [8]. In this research work, epoxy composites have been prepared for electric conductivity with a distinctive feature of flame retardancy to enhance their performance and to be called dual-functional composites. Therefore, enhancement in performance is the key objective in the preparation of a multi-functional composite. The matrix is developed as flame retardant and electrically conductive simultaneously.
2. Materials and methods
2.1. Materials
Di-glycidyl ether of bis-phenol-A (DGEBA, NPFL-128) epoxy resin was purchased from (Al-Noor Fabric Glass, Pakistan), Aluminum tri-hydroxide (ATH), magnesium hydroxide (MH), Formic acid (96%), Aniline monomer (99.5%), were purchased from Sigma Aldrich, Germany. Ammonium persulfate (APS) (98%) was purchased from DAE JUNG, Korea.
2.2. Polymerization of aniline
The chemical oxidative method was used for the polymerization of aniline [9, 10]. It involves two physically separate solutions; in beaker (1) there was APS (0.5 mol) in formic acid (50 ml) and in beaker (2) there was aniline (0.5 mol) in formic acid (50 ml). These solutions were stirred homogenously at 50 °C. Then both beakers were kept in an ice bath to lower the temperature (0 °C–5 °C) for 4 h with continuous and homogeneous stirring. Afterward, APS solution was added dropwise to the beaker (2) polymerizing aniline mixture. The physical appearance of the mixture changes from brown to a dark greenish color, which indicates the polymerization of aniline. At 100 °C, the excess formic acid evaporated. The solvent evaporation left the powdered form of polyaniline (PANI) at the bottom of the beaker. The PANI precipitates were washed with water and ethanol, then dried in a vacuum oven at 90 °C and 300 bar pressure 12 h. It is shown in figure 1.

Figure 1. Process flow diagram for the composite preparation.
Download figure:
Standard image High-resolution image2.3. Fabrication of epoxy composite
The epoxy composites were prepared by pouring the liquid mixture into the mold, as shown figure 1. Table 1 shows the formulations in weight percent (wt %). E 100 consists of 100 wt% epoxy.
Table 1. Sample details by varying weight percentage concentrations of flame retardant and PANI in epoxy [11, 13–16].
| Sample | Epoxy (wt%) | ATH (wt%) | PANI (wt%) |
|---|---|---|---|
| E 100 | 100 | 0 | 0 |
| E 90 - F | 90 | 10 | 0 |
| E 85 - F | 85 | 15 | 0 |
| E 80 - F | 80 | 20 | 0 |
| E 80 - P | 80 | 0 | 20 |
| E 75 - P | 75 | 0 | 25 |
| E 70 - P | 70 | 0 | 30 |
| E 60 -FP | 60 | 15 | 25 |
The samples E 90-F, E 85-F, and E 80-F were prepared by varying the weight percentages of ATH inorganic flame retardants (FR). The reason behind the percentages of FR is that ATH at lower concentrations doesn't show flame resistance, and high concentrations can lead to deteriorating mechanical performance [11, 12]. ATH is a non-hygroscopic, odorless, and colorless powder. It is nonflammable with an endothermic decomposition temperature of around 201 °C to 353 °C. ATH works as a smoke suppressant FR.
E 80-P, E 75-P, and E 70-P are conductive samples, and these samples were prepared with the addition of polyaniline in epoxy (physical mixing).
The sample E 60-FP is a dual-functional epoxy composite because it consists of both flame retardants and polyaniline. These samples were characterized for electrical conductivity, flame retardancy, and mechanical analysis.
3. Characterization
3.1. UL 94 burning test
The flammability of samples was checked by the UL94 burning test. The sample dimensions were kept according to the standard 100 × 13 × 3 mm. The test was performed in vertical mode. The UL 94 identifies the sample in three categories: V-0, V-1, and V-2. V-0 denotes flame-retardant material; V-1 denotes material that burns but self-extinguishes after a short period of time without dripping; and V-2 denotes the material that burns with dripping.
3.2. Thermogravimetric analysis (TGA)
Thermogravimetric analysis of the crosslinked epoxy with PANI and flame-retardant specimens was performed on a TGA-50 instrument (Shimadzu, Kyoto, Japan). The heating rate was 10 °C min−1 in a nitrogen atmosphere with a flow rate of 20 ml min−1, from room temperature to 700 °C.
3.3. Electrical conductivity
The electrical conductivity of epoxy composite was measured using a Keithley 2450 four-probe meter at room temperature. It consists of tungsten metal probes with a 26-mm long, 45-degree cone angle, and a 25-micron tip radius. Each of the probes is placed 1 mm from the other. An electric current (I) is applied between the two internal terminals, and voltage (V) is measured. The dimensions of the samples were 2.1 × 5.6 × 0.1 cm.


Where;
- V = Voltage,
- I = Current,
- R = Resistance,
- L =Length,
- A =Area,
- σ = DC conductivity.
3.4. Mechanical properties
The tensile test was performed on the universal testing machine (UTM) Zwick-Roell (Z100) for the tensile properties of the composite as per ASTM D 638. The flexural properties of the epoxy composite were tested as per ASTM D 7264. The dimensions of each specimen were 150 × 13 × 4 mm.
4. Results and discussion
4.1. Flammability test
The flammability of epoxy composite was investigated by the UL 94 vertical burning test [17–20]. For this test, a vertically positioned clamp held the sample while it was subjected to bottom-facing flames. The flammability is measured on the scale of ratings V-0, V-1, V-2. E 100, started burning without pause and continued to burn for the 90 s. It was observed that E 100 underwent excessive dripping; hence, it was given no rating. The E 90-F had ATH (10 wt%), brought good resistance to fire. It got self-extinguished within 15 s and, upon second time exposure to fire, it continued burning from one side until it self-extinguished at 240 s without dripping. The burning pattern was different from E 100 because of the presence of FR ATH. E 90-F was given a V-1 rating. E 85-F had ATH (15 wt%) more than in E 90-F. This is the reason that better results were observed. It self-extinguished within 7 s and continued burning for 310 s without dripping during second time exposure to fire. The burning pattern resembled E 90–F. However, extent of burning time was observed to be different which was due to the high concentration of ATH. Therefore, E-85-F was given a V-0 rating. E 80-F had ATH (20 wt%). It self-extinguished within 4 s and continued burning for 345 s without dripping after second exposure. The main reason for improved results was the higher concentration. E 80-F was given a V-0 rating. It was seen that half the sample was burnt by fire. The results are shown in figures 2 and 4(a). The ATH decomposition temperature is 180 °C. It functions by releasing H2O molecules upon heating and reducing the heat flow, which lowers the temperature.
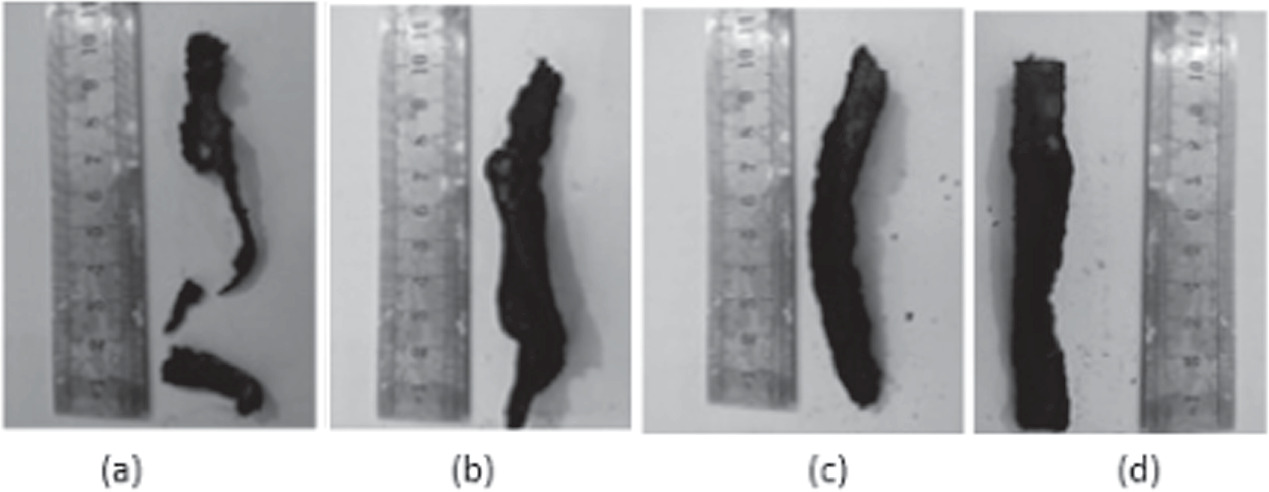
Figure 2. Brunt samples (a) E 100 (b) E 90-F (c) E 85-F (d) E 80-F.
Download figure:
Standard image High-resolution imageE 80-P was prepared by the addition of 20 wt% of PANI. When it was exposed to fire, it started burning for 86 s without any pause. It was also seen that PANI was producing char but not enough to protect the epoxy. However, the epoxy continued to burn, and dripping was observed. The same case was observed in the E 75-P and E 70-P samples. The results are shown in figure 2(a) and the rating is shown in figure 4(b).
E 60 -FP had ATH (15 wt%) and PANI (20 wt%), exposed to fire. It showed results near E 85-F because of the same percentage of FR material. However, a slightly different pattern was observed, as shown in figure 3. This was because of PANI. It showed flame retardant properties by producing char when used in combination with FR. The structure of PANI consists of a nitrogen-containing aromatic chain. One may imagine PANI as a potential polymeric FR, when used with other strong FR along with fascinating electroactive properties. Therefore, E 60–FP self-extinguished within 10 s, and upon exposure to fire again, it continued burning till 320 s without dripping. Hence, it was given a V-0 rating, as shown in figure 4(c). The reason behind the FR results is endothermic decomposition in metal hydroxide flame retardants that normally function by releasing H2O molecules upon heating, thus reducing the heat flow and lowering the temperature of the substrate.
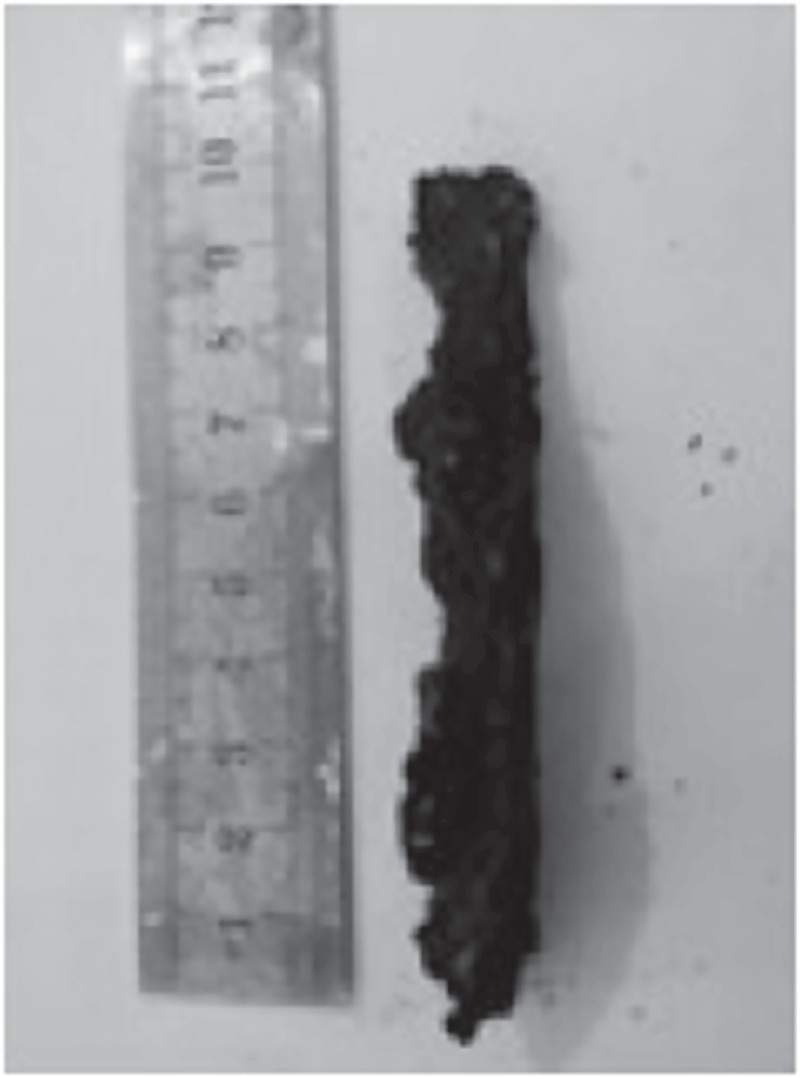
Figure 3. Brunt sample E 60-FP.
Download figure:
Standard image High-resolution image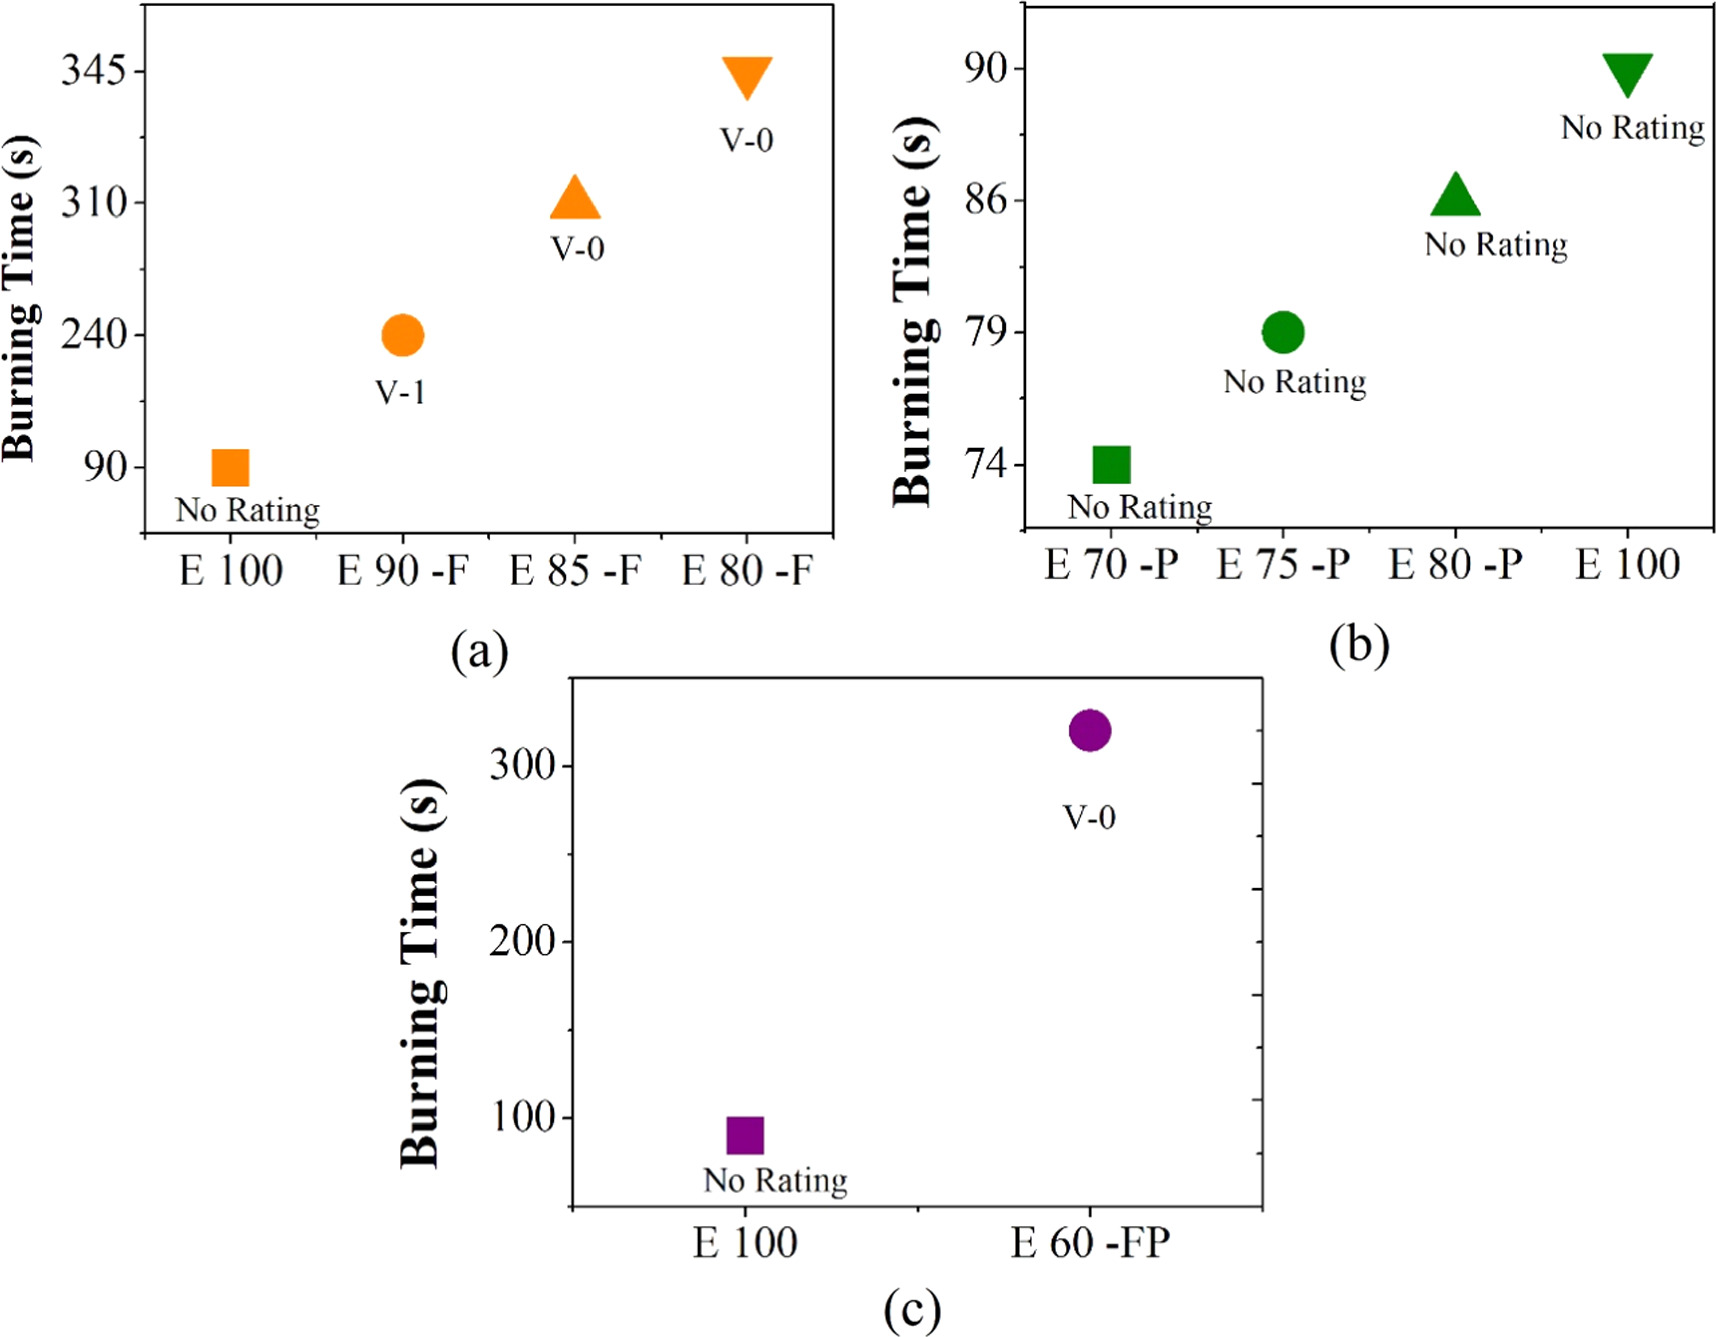
Figure 4. Comparison of burning time of (a) Pure epoxy with flame retardant incorporated epoxy, (b) Pure epoxy and epoxy PANI composites, and (c) Pure epoxy with epoxy incorporated flame retardant & PANI composites.
Download figure:
Standard image High-resolution image4.2. Thermogravimetric analysis (TGA)
The thermal degradation of three categories of composite; first flame retardant ATH reinforced modified epoxy resin, second PANI-reinforced epoxy resin, third PANI & ATH reinforced epoxy resin composite was done. The results are shown in figures 5–9 respectively.

Figure 5. Thermogravimetric curves of E 100, E 90 -F, E 85 -F, E 80 -F; E, epoxy; F, flame retardant ATH.
Download figure:
Standard image High-resolution imageFigure 5, shows the thermal analysis of ATH reinforced epoxy. The higher concentration loadings of FR gradually increase the mass residue percentage of epoxy. As evidence, it can be seen from the figure 5 that composite E 100 at 600 °C shows 16.5% mass residue, while E 80-F at 600 °C shows 51.5% mass residue. Because of lower FR concentration loadings in sample E 90-F and E 85-F, both show 42.0% and 43.0% mass residues, respectively. Table 1 shows concentrations of FR. ATH at 10% ≥ shows the same results [21], but higher loading of ATH protects the sample from weight loss. The FR belongs to the metal hydroxide group, which shows endothermic degradation and releases water at elevated temperatures, thus reducing the heat in the system. Figure 5 shows the Tmax of E 100 is 270 °C, E 90-F is 232 °C, E 85-F is 227 °C, and E 80-F is 214 °C. The gradual decrease in Tmax is evidence of endothermic degradation. The higher loadings increase the water release, and sudden weight loss is observed from 3% to 14% at 281 °C.
Figure 6 shows the thermal analysis of PANI-reinforced epoxy resin. The PANI undergoes three weight loss steps. Usually, it can be a loss of moisture. Further decomposition can involve the loss of dopants, i.e. HCL and in the third step, it can be chain scission of the bone chain. The mass residue would be referred as carbon residue. The PANI starts decomposition prior to epoxy, as epoxy is thermally stable. However, the mass residue of PANI is greater than epoxy. Therefore, figure 6, shows the mass residual % of epoxy rises progressively with increasing PANI concentration [22]. E 100 at 600 °C shows 16.5% mass residue while E 70-P at 600 °C shows 22% mass residue. E 80-P and E 75-P have mass residues of 12% and 19%, respectively. Thermal stability is because of the decomposition pattern of PANI. Figure 6 shows the Tmax of E 100 is 270 oC, E 80-P is 262 oC, E80-F is 256, and E80-F is 241 °C. This may be attributed to the loss of moisture and oligomers and is characteristic of the PANI phase. Hence, it may be concluded that there is no significant effect of PANI on the thermal degradation characteristics of the epoxy system [12, 13].
Figure 7 shows the FR and PANI-reinforced epoxy composite. The E 60-FP formulation is mentioned in table 1. At 600 °C, the E 100 has 16.5% mass residue, and the E 60-FP has 42% mass residue. The behavior is close to E80-F. It is due to the FR's endothermic degradation and PANI's ability to produce char. Figure 8, DTG curve shows a sharp peak between 350-400 °C. It indicates the sudden decomposition of pure epoxy. Figure 9, DTG curve shows a broad peak between 350-400 °C. It indicates the gradual decomposition of E 60-FP.
4.3. Electrical conductivity test
The conductivity of E 80-P, E 75-P, and E 70-P (as shown in table 2) composites increased gradually as we increased the wt% of PANI [13, 23]. Figure 10 depicts a graph of PANI wt% versus log of conductivity values. The graphs displayed the insulating behavior of sample E 100. The sample E 80-P with 20 wt % of PANI, exhibits conductivity value of 9.74 × 10⁻⁶ Scm−1. Below 20 wt% PANI shows low conductivity because of lower levels of protonation in chains, and it is prone to form more semi crystalline regions. By increasing the wt% of PANI in the epoxy composite, the electrical conductivity was also increased. It was because there were more charge carriers and strong conducting networks made when PANI particles and epoxy came into better contact with each other. The sample E 75-P showed conductivity of 4.5 × 10⁻⁵ Scm−1. The increased concentration of PANI in epoxy increases the chance of strong interparticle connections. Thus, increased conductivity. The sample E 70-P showed the highest value of conductivity among all samples because it contained 30 wt% of PANI content in epoxy.
Table 2. Electrical conductivity value of PANI incorporated epoxy composites.
| Samples | Conductivity (S/cm) | Log of conductivity (S/cm) |
|---|---|---|
| PANI | 1.50 | 0.17 |
| E 100 | 2.94 × 10⁻¹⁶ | −7.49 |
| E 80 - P | 9.74 × 10⁻⁶ | −5.93 |
| E 75 - P | 4.50 × 10⁻⁵ | −3.2 |
| E 70 - P | 3.41 × 10⁻⁴ | −2.13 |
| E 60 -FP | 6.1 × 10⁻⁶ | −4.21 |
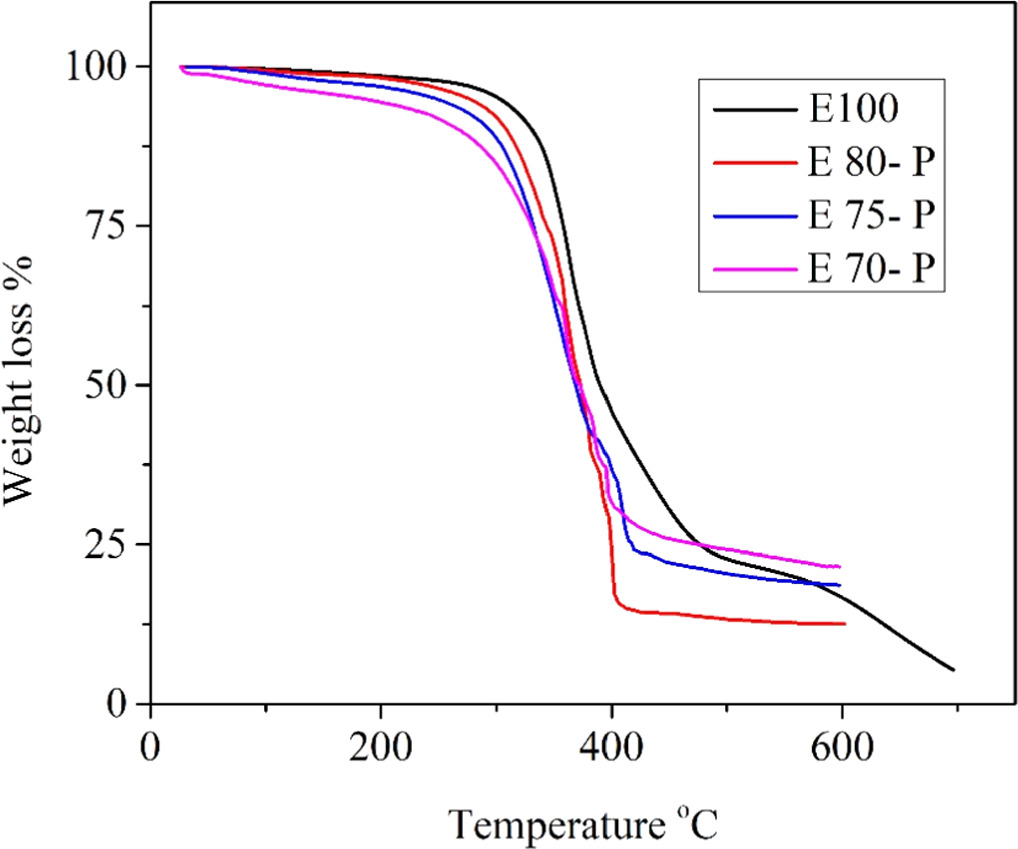
Figure 6. Thermogravimetric curves of E 100, E80 -P, E 75 -P, E 70 -P; E, epoxy; P, PANI.
Download figure:
Standard image High-resolution image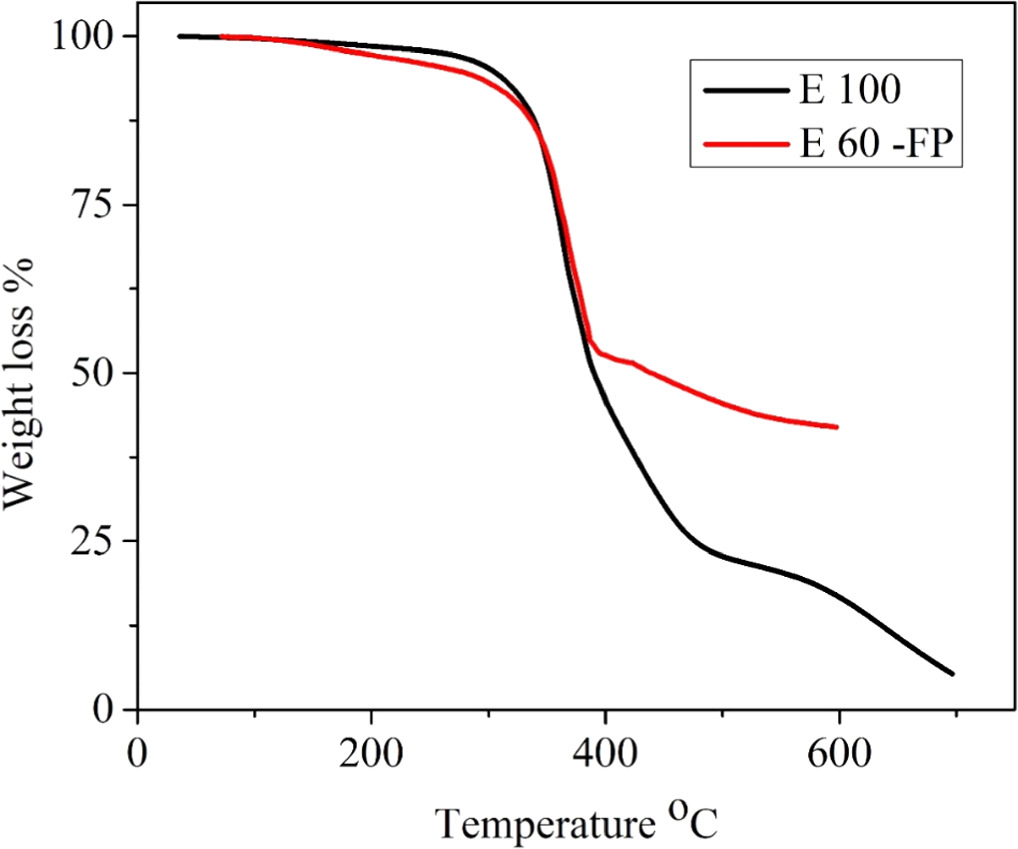
Figure 7. Thermogravimetric curves of E 100, E 60 -FP; E, epoxy; F, flame retardant ATH & MH; P, PANI.
Download figure:
Standard image High-resolution imageThe ATH/PANI was added in E 60 - FP in wt % of 15/25. It can be seen from figure 8, that the addition of FR to Epoxy-PANI slightly decreased the conductivity of the composite. It is due to the ATH particles being an obstacle in the charge transferring process. Therefore, the sample E 60-FP exhibited conductivity of 6.1 × 10⁻⁶.

Figure 8. DTG curves of E 100.
Download figure:
Standard image High-resolution image
Figure 9. DTG curves of E 60-FP.
Download figure:
Standard image High-resolution image4.4. Mechanical testing
4.4.1. Tensile property
Table 3 shows the tensile properties of the composites. The data shows the tensile modulus and tensile strength of the samples. It can be observed that there is a decrease in the tensile modulus and strength when FR is added to epoxy [21]. From table 3, E 100 exhibits modulus of 2850 MPa and a tensile strength 20.5 MPa. When 10 wt% of ATH was added to sample E 90-F, the value of modulus and strength decreased. E 90-F shows a modulus 2332 MPa and a tensile strength 18.1 MPa. A further increase in ATH concentration in sample E 85-F decreased the modulus to 2031 MPa and strength to 12.2 MPa. The decrease in modulus and strength is related to the compatibility issue between different types of bonding in ATH compound and epoxy. ATH is an inorganic compound, and it is bonded by ionic bond while epoxy have covalent bonding and van der Waals forces. Hence, a homogeneous phase could not be formed. An increase in ATH concentration 20 wt% in epoxy further reduces the modulus and strength. E 80-F shows a modulus 1250 MPa and strength 9.5 MPa. The ATH particles distribution reduces the van der Waals forces in epoxy chains, and high concentrations lead to cracks. Another factor that can further reduce the tensile properties is the uneven distribution of inorganic ATH in epoxy. If ATH is accumulated and forms clusters, then the cluster would act as stress concentrating point.
Table 3. Tensile modulus (E) and tensile strength of composite samples.
| Sample | Tensile modulus (E) (MPa) | Tensile strength (MPa) |
|---|---|---|
| E 100 | 2850 | 20.2 |
| E 90 - F | 2332 | 18.1 |
| E 85 - F | 2031 | 12.2 |
| E 80 - F | 1250 | 9.5 |
| E 80 - P | 392.5 | 4.5 |
| E 75 - P | 257 | 2.7 |
| E 70 - P | 230 | 1.8 |
| E 60 -FP | 1117.6 | 7.2 |

Figure 10. Electrical conductivity of epoxy-PANI composite.
Download figure:
Standard image High-resolution image
The PANI is mixed with epoxy, the modulus and tensile strength are both reduced [13]. The modulus of E 80-P is 392.5 MPa, while its strength is 4.5 MPa. A higher PANI concentration in E 75-P results in a lower modulus compared to E 80-P. The modulus of E 75-P is 257 MPa and its strength is 2.7 MPa. The modulus and strength continue to drop very dramatically at 230 MPa and 1.8 MPa, respectively. The modulus of E 60-FP is 1117.6 MPa and the strength is 7.2 MPa, as shown in table 3. The modulus is seen to increase with the addition of ATH because of the macromolecular chain movement of the matrix, that can be locked to a certain extent when the resin is filled with inorganic particles, leading to an increase in the stiffness of polymer composites under general conditions. Even though adding PANI makes the modulus decline, it also makes the chains more flexible.
4.4.2. Flexural analysis
Table 4 shows the flexural modulus and flexural strength of the samples. From the data, it can be concluded that the flexural modulus and strength of sample E 100 are higher than the other samples that have the FR & PANI. In PANI composition samples, the flexural properties got better; however, adding high concentration of FR had the opposite effect.
Table 4. Flexural modulus and flexural strength of composite samples.
| Sample | Flexural modulus (Ef ) (MPa) | Flexural strength (σ) (MPa) |
|---|---|---|
| E 100 | 2939 | 59.3 |
| E 90 - F | 2810.1 | 31 |
| E 85 - F | 2854.2 | 29 |
| E 80 - F | 2571.5 | 23 |
| E 80 - P | 2437.3 | 38.3 |
| E 75 - P | 1642.8 | 41 |
| E 70 - P | 1662.6 | 45.3 |
| E 60 -FP | 2800.2 | 30.2 |
The E 90-F shows a flexural modulus of 2810.1 MPa and a strength of 31 MPa. E 85-F with the increased amount of FR shows a lower modulus than E 90-F. The modulus of E 85-F is 2854.2 MPa and 29 MPa. E 80-F shows a further decrease in modulus and strength of 2571.5 MPa and strength of 23 MPa, respectively. The inorganic ATH increase the stiffness of the epoxy [24]. The ATH is an inorganic compound and has ionic bonds, which tend to be hard and brittle. Therefore, the flexural properties decline with increasing concentrations of FR in composites.
The modulus of E 80-P with PANI is 2437.3 MPa and its strength is 38.3 MPa. Adding more PANI to E 75-P causes its modulus to decrease, making it less durable than E 80-P. The flexural strength of E 75-P is 41 MPa, whereas the modulus is 1642.8 MPa. The modulus of E 70-F decreases to 1662.6 MPa and the flexural strength increases to 45.3 MPa. The trend shows decreasing flexural properties with increasing PANI concentrations. PANI shows imparting stiffness in epoxy [25]. The flexural modulus 2800 MPa and flexural strength 31.2 MPa of FR and PANI-modified E 55-FP.
5. Conclusion
The effect of flame retardants and electrical conductivity on the mechanical and thermal properties of DGEBA epoxy resin was determined. The results have shown that the addition of flame retardants decreases mechanical properties and enhances flame retardancy. The UL-94 test shows the V-0 rating of the E 60-FP as the combination of ATH & PANI makes the samples highly flame retardant in nature. The addition of PANI made the DGEBA epoxy conductive. Electrical conductivity results showed an electrical conductivity of 6.1 × 10⁻⁶ S/cm for E 60-FP. The composition E 60–FP has shown the optimum mechanical properties; flexural strength of 30.2 MPa, a flexural modulus of 2800.2 MPa, a tensile strength of 7.2 MPa, and a tensile modulus of 1117.5 MPa. These findings highlight the potential of DGEBA epoxy composites containing PANI and ATH as promising materials for applications requiring fire resistance and electrical conductivity properties.
Acknowledgments
The authors are thankful to the Deanship of Scientific Research at Najran University for funding this work under the Research Groups Funding Program grant code (NU/RG/SERC/12/4).
Data availability statement
This is a small part of a funded project, and data could be shared after the completion of the whole project. The data that support the findings of this study are available upon reasonable request from the authors.