
Abstract
The bismuth ferrite/ZnMgAl-LDH (BFO/LDH) nanocomposite was successfully synthesized in the in situ co-precipitation method as an enhanced adsorbent of methylene blue dye under sonication interference. The synthetic structure was deeply characterized by different structural, chemical, textural, and physical techniques, including XRD, FT-IR, Raman analysis, BET surface area TEM, and XPS. The charterization findings describe the formation of the composite as magnetic spherical-like nanoparticles with a grain size less than 100 nm, a surface area of 13.4 m2 g–1, and multifunctional active chemical groups. The composite was applied to adsorb methylene blue (MB) via adsorption from an aqueous solution. MB adsorption experiments were conducted in an ultrasonic bath, and the effect of various adsorption parameters such as composite dosage, pH, time, and initial dye concentration has been briefly studied. The result indicated that pH 12 is more optimal for MB adsorption. The adsorption kinetics of the composite are determined to be pseudo-second-order. Furthermore, BFO/LDH composites exhibit a higher adsorption capacity (244.49 mg g−1) under optimal conditions. The equilibrium adsorption isotherm follows the Langmuir isotherm model. The results indicate that the prepared BFO/LDH composite provides a novel effective adsorbent for MB from aqueous media and could be applied for actual wastewater purification.

Original content from this work may be used under the terms of the Creative Commons Attribution 4.0 licence. Any further distribution of this work must maintain attribution to the author(s) and the title of the work, journal citation and DOI.
Nomenclature
| MB | Methylene blue |
| BFO | Bismuth ferrite |
| BFO/LDH | bismuth ferrite/ZnMgAl-LDH |
| Ci | initial concentrations of MB dye |
| Cf | final concentrations of MB dye |
| Ce | Equilibrium concentration of MB dye in solution (mg.l−1) |
| V | Total volume of the solution (ml) |
| W | adsorbent amount (mg) |
| qe | Amounts of dye adsorbed at equilibrium time (mg.g−1) |
| qt | Amounts of dye adsorbed at time t (mg.g−1) |
| k1 | pseudo first order rate constant (min−1) |
| k2 | pseudo-second order rate constant (g.mg−1.min−1) |
| qmax | quantity of solute adsorbed per weight of adsorbent in producing a uniform monolayer on the surface (mg.g−1) |
| kL | The rate of adsorption (L.mg−1) |
| kf | Freundlich constant (mg.g−1) |
| 1/n | Heterogeneity factor |
| R | Universal gas constant (8.314 J.mol.−1K−1) |
| T | Absolute temperature (K) |
| B | Tempkin constant (J. mg−1) |
1. Introduction
Organic dyes are broadly applied in industries, including pharmaceuticals, paper, leather, textiles, makeup, and plastics, as a colorant agent [1–6]. Up to 20% of total dye output is wasted during industrial processing, causing pollution and eutrophication and disturbing aquatic habitats [7–9]. Methylene blue C16H18ClN3S (MB) is a heterocyclic, cationic dye with a positive charge and is extensively utilized in chemical indicators, dyes, biostains, and pharmaceuticals [10–12]. Methylene blue is a major threat to the biological system and drinking water when discharged into water [13, 14]. Several techniques have been employed to eliminate dyes from wastewater, such as chemical oxidation [15], adsorption, photodegradation [16], and biological degradation [17]. However, some of these techniques have drawbacks, such as inadequate removal, high energy demands, and the creation of poisonous sludge or waste products that must be disposed of [15]. Removing dye from colored wastewater using an adsorbent is interesting because specific compounds are transported from the liquid to the solid surface [18]. Adsorption is a popular separation method for removing some contaminants from wastewater [19, 20]. The adsorption approach is also ideal for developing countries due to its relatively low cost, simplicity of design, and high efficiency [21]. Numerous adsorbing materials were used for the removal of methylene blue MB [22], such as MOF [23], MCM-41 [24], zeolites [25], graphene [26], activated carbon [27], mesopore silica [28], and clay [29]. Amongst these adsorbents, LDH nanoparticles were widely recommended as highly effective structures with economic and environmentally friendly values, in addition to their high recyulbale properties in comparison with other investigated adsorbents.
LDH is a two-dimensional material containing cationic layers and anion interlayers in between. LDH is represented in the common formula [M2+ 1−x M3+ x (OH)2]x+ (An−)x/n•mH2O, where M2+ and M3+ are divalent and trivalent metal cations, and An− is an exchangeable anion [30, 31]. In recent years, layered double hydroxide LDH has gained great research interest for removing dyes from wastewater owing to its fantastic properties such as low toxicity, ultra-stability, earth abundance, adsorption capacity, and ease of preparation using low-cost raw materials [32–34]. Separation of LDH from the aquatic system is difficult. Therefore, its application is more effective when supported by magnetic particles that enhance adsorption capacity and are magnetically separated [35]. Numerous magnetic and magnetic supporting materials have been applied to treat dye-contaminated wastewater [36]. Ferrites are an important class of conventional oxides that are magnetic. Also, they have attracted more attention owing to their non-cytotoxic properties, accessible preparation, rapid adsorption kinetics, moderate saturation magnetization, and high BET. Therefore, several ferrite materials and their composites were established as adsorbents to eliminate MB from wastewater solutions. These include cobalt ferrite/mesoporous graphitic carbon nitride [37], silica@magnesium ferrite composite (MgFe2O4@SiO2) [38] and Zn-substituted cobalt ferrite nanoparticles [39]. BiFeO3 is an extraordinary multiferroic material that shows ferroelectricity and anti-ferromagnetism at room temperature [40]. Also, BiFeO3 resolves the trouble of separating LDH from an aqueous solution.
Herein, we report the BiFeO3/ZnMgAl-LDH composite fabrication using the co-precipitation method; that method provides better crystallinity, control of particle size, and high purity of the prepared composite. The synthesized materials have been characterized by various techniques such as TEM, SEM, IR, XRD, XPS, BET surface, and Raman analysis. The composite exhibits excellent adsorption capacity toward the elimination of methylene blue. Moreover, adsorption kinetics and adsorption isotherms were studied.
2. Methodology
2.1. Materials
The following chemicals were applied without extra purification: For the preparation of BFO, Fe(NO3)3.9H2O (99%), Bi(NO3)2.5H2O (99%), ethylene glycol (C2H6O2), and nitric acid (HNO3, 68 wt%) were purchased from Sigma Aldrich. For the fabrication of LDH, Zn(NO3)2.6H2O (98%), Al(NO3)3.9H2O (98%), Mg(NO3)2.6H2O (98%), potassium carbonate, and KOH (98%) were supplied by Loba Chemi Co. The pollutant solution of MB was prepared by dissolving a proper weight in deionized water.
2.2. Preparation of BFO
BFO was prepared according to Safizade et al [41]. The details of the preparation method are as follows: firstly, solution A was formed by liquefying 16 mmol of ferric nitrate in ethylene glycol. Solution B was created by liquefying 16 mmol of bismuth nitrate in nitric acid. Afterward, solution B is gradually added to A, evolving brown bubbles of nitrogen oxide, indicating a redox reaction between NO3 and O–H of ethylene glycol. The precipitate was drying at 130 °C and annealed in air at 600 °C for 60 min. The sample was washed with acetic acid and deionized water and then dried at 70 °C to remove the impurities.
2.3. Preparation of ZnMgAl-LDH
ZnMgAl LDH was synthesized by the co-precipitation method. The metal salts (0.326 gm zinc nitrate hexahydrate, 1.95 gm magnesium nitrate hexahydrate, and 1.08 gm aluminum nitrate nonahydrate) were liquified in 30 ml D.I.W. to form solution A (based on cations). Solution B (1.8 g potassium carbonate, 1.7 g potassium hydroxide) in 40 ml deionized water Solution A was dropped by solution B under continuous stirring while maintaining a pH of 10. The resulting slurry was stirred vigorously for 18 h at 80 °C. The precipitated LDH was harvested with a centrifuge and washed several times with a mixture of distilled water and ethanol to remove excess ions. Then dried at 70 °C for a day.
2.4. Fabrication of BFO/LDH nanocatalyst
BFO/LDH nanocomposite was fabricated via the in situ co-precipitation method using similar initial procedures as LDH. About 0.5 g of BFO was weighed into 50 ml of D.I.W. and sonicated for 30 min. After adjusting the pH of the LDH suspension, BFO solution was slowly added to it and kept for 18 h with vigorous stirring at 80 °C. The obtained brick-colored product was filtrated. Subsequently, the product was cleaned numerous times with D.I.W. and dried at 70 °C. The exact percent of BFO loading is 12%.
2.5. Instrumentation
The structure and composition of the prepared nanoparticles were studied by x-ray diffraction (XRD) using a Philips diffractometer in the range 10°–80° 2θ by Cu Ka radiation. The surface area (BET) and related results were determined by N2 sorption using a NOVA 3200 S unit. Fourier transform infrared (FT-IR) spectra were achieved using Nicolet IS-10 in the range of 4000–500 cm−1. The Raman analysis was measured by a Bruker-Senterra spectrometer. The TEM of the prepared composites was captured using a JEOL-JEM-2100 working at 200 kV. XPS analysis was verified by XPS SPECS GmbH, Germany.
2.6. Adsorption studies
The ultrasound effect of factors such as ultrasonic time (3–40 min), adsorbent dose (0.3–2 g l−1), pH−1 (4–12), and initial dye concentration (20–200 mg l−1) on MB dye removal was investigated. The optimal experimental conditions were determined. Typically, adsorption experiments are carried out using an ultrasonic bath (Model UC-30A, Frequency: 40 KHz, Capacity: 6 l, Power: 400 W, Input: AC 250 V, 50 Hz). The adsorption process was carried out in a double-jacket beaker to keep the temperature constant during the adsorption process. After the adsorption process, magnetically, the catalyst separated by centrifugation at adjusted speed of 5000 rpm for 10 min and the remaining dye was examined using a UV–vis spectrophotometer. The kinetics and isotherm adsorption were evaluated by measuring the dye's adsorptive removal at varied initial dye concentrations and time intervals under optimal parameters. The MB adsorption removal and the adsorption capacity (A.C.) under various experimental settings were measured by equations (1) and (2).


Where Ci and Cf denote the initial and final concentrations of the MB dye at time t, respectively; qt represents the amount of dye adsorbed at time t; V is the dye solution volume used in the test, and w means the adsorbent amount.
2.7. Statistical optimization
The optimization of the removal processes of MB dye by BFO/LDH was assessed based on statistical design, considering the impact of time interval, pH, and BFO/LDH dosage as the essential inputs or variables using Design-Expert Software (Version 6.0.5). The design was built considering the properties of the central composite statistical design (CCD), which is associated with Response Surface Methodology (RSM). The upper and lower levels of the affecting variables were added based on the previously addressed experimental results and listed in table 1 in their coded and actual values. The impact of the evaluated input, as well as the interaction between them, was illustrated based on the second-order polynomial equation considering the removal percentages of MB as the target response (equation (3)). The inserted Y, Xi, and Xj, β0, βi, βii, βij, and K symbols donate the target response (removal of MB., %), input variables, constant, linear coefficient term, quadratic coefficient term, cross-product coefficient term, and the number of variables, respectively.

Table 1. The upper and lower values of the inputs in their actual and coded values.
| Factor | Name | Low actual | Medium actual | High actual | Low coded | Medium coded | High coded |
|---|---|---|---|---|---|---|---|
| A | Time interval (min) | 5 | 10 | 15 | −1 | 0 | 1 |
| B | pH | 8 | 10 | 12 | −1 | 0 | 1 |
| C | Dosage (g l–1) | 0.5 | 0.75 | 1 | −1 | 0 | 1 |
3. Material characterization
3.1. XRD analysis
Figure 1 illustrates the XRD pattern of MgZnAl-LDH, BFO, and BFO/ZnMgAl-LDH nanocomposite. The XRD of LDH demoinstarte its characteristic peaks at 2θ values of 11.47° (003), 22.99° (006), 34.71° (012), 39.2° (015), 46.9° (018), and 62.05° (113). The strong diffraction peaks at 11.47 demonstrate the high purity of prepared LDH [42, 43]. XRD results revealed that the prepared LDH presented good crystallinity. The sharp and powerful peaks of ZnMgAl-LDH are attributable to LDH produced under a high pH environment, enhancing crystallinity. This result is in agreement with the previous study [44].

Figure 1. XRD of ZnMgAcfFO, and BFO/LDH nanocomposite.
Download figure:
Standard image High-resolution imageThe XRD of BFO at 600 °C sintering temperature shows typical diffraction peaks at 2θ values (22.3° (102), 31.7° (104), 31.9o (110), 38.3o (006), 39.5o (202), 45.5o (024), 51.4o (116), 51.9o (122), 56.3o (018), 56.9o (214)) that are ascribed to the phases of BiFeO3 [45], and one peak attributable to Bi2Fe4O9 (2θ = 27.8o). The secondary phase (Bi25FeO40) was eliminated by nitric acid (HNO3) [46]. It is reported that most BiFeO3 is accomplished by secondary phases such as Bi2Fe4O9 and Bi25FeO29. The impurity phases were attributed to the volatilization of Bi3+ ions, resulting from the excess addition of bismuth. The high pressure of the bismuth atom tends to facilitate the easy evaporation of the Bi+3 ion during synthesis conditions such as drying and calcination. A similar trend was observed in the previous study [47–49].
When comparing pure BFO to BFO/LDH composite, the overall peaks move to the right, the strength of twin peaks of planes (104) and (110) was reduced, and the dual peaks were somewhat split and shifted to a higher angle (2θ = 32.7o and 33.6o) compared to pure BFO. The peak intensity of plane (003) at 2θ = 11.4o was reduced and marginally shifted to the right, revealing that composite formation reduced the crystallinity of LDH.
3.2. FT-IR analysis
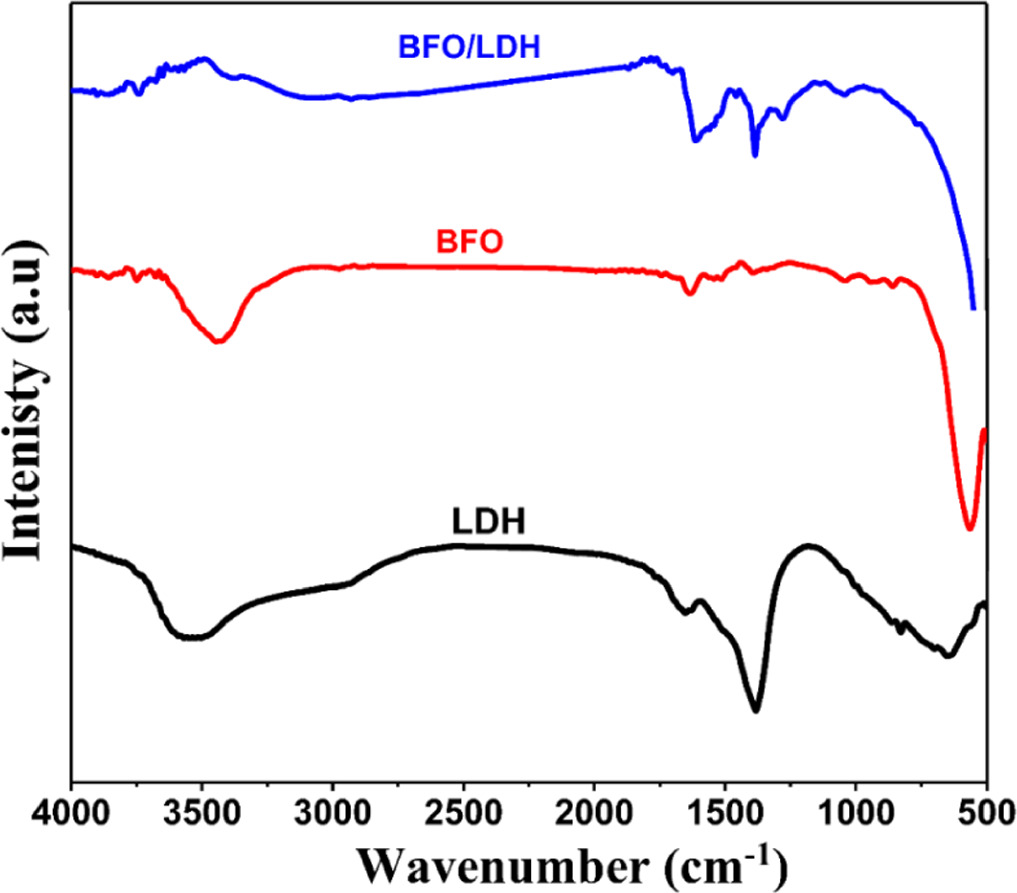
The FT-IR spectra of synthesized materials are presented in figure 2. At the LDH spectra, a broad peak at 3000–3600 cm−1 is assigned to the stretching vibration of the hydroxyl group (O–H), while a peak at 1620–1640 cm−1 is attributed to the bending vibration of the interlayer water molecule. The band at 1362–1375 cm−1 may be ascribed to the stretching vibration of the interlayer carbonate anion [44]. The peak at 1010–1015 cm−1 is related to the deformation mode of Al–OH. Moreover, the adsorption band at 732–532 cm−1 is associated with M–OH vibration. Bands at 432–558 cm−1 can be related to M–O and M–O–M stretching vibrations [50, 51]. The broad band of BFO located at 3000–3500 cm−1 is attributed to stretching O–H, but at 1650 cm−1 corresponds to O–H bending vibration. The bands at 400–650 cm−1 were related to Fe–O stretching and O–Fe–O bending vibrations of the FeO6 species in BFO nanoparticles [52]. The FT-IR spectrum of the composite matches well with the peaks of BFO and LDH. It indicates the coexistence of BiFeO3 and ZnMgAl LDH phases in the BFO/LDH composite.

Figure 2. FTIR spectra of ZnMgAl LDH, BFO, and BFO/LDH nanocomposite.
Download figure:
Standard image High-resolution image3.3. Raman analysis
Raman analysis is a valuable technique that gives information about the material structure. Figure 3 shows the Raman analysis for LDH, BFO, and BFO/LDH composites. BFO should have active Raman modes (A1 and E) representing lattice distortions of prepared BFO. Where A1 is the longitudinal optical mode and E is the transverse optical mode (TO). The E modes are located at the higher cm−1 (212, 316, 380, 450, and 537 cm−1) and can be ascribed to vibration modes of octahedral Fe O6. But the modes related to Bi-O are located below 200, at 97 and 120. The position of Raman peaks is in good agreement with the previous study [53–55], and the results are consistent with XRD results.

Figure 3. Raman of ZnMgAl LDH, BFO, and BFO/LDH nanocomposite.
Download figure:
Standard image High-resolution imageRaman spectra of LDH show a sharp band at approximately 1056, which was ascribed to the symmetric vibration of carbonate CO3 −2 that bonded to surface OH, but the lower intensity band at 1079 cm−1 is related to the symmetric vibration of CO3 −2 bonded to interlayer water [56, 57]. The composite's Raman spectra also demonstrated a band at 1324 cm−1 that corresponded to the carbonate anion on the external surface of LDH [58], which is similar to the prepared LDH, as well as vibration modes at 534, 446, 316, 218, 177, and 135 cm−1 that corresponded to BFO, confirming that the BFO/LDH composite was successfully synthesized.
3.4. BET surface area
The BET isotherm was carried out to characterize the surface area, pore diameter, and total pore volume. According to the IUPAC classification, the LDH isotherm belonged to type IV isotherms with an H3 hysteresis loop, as described in figure 4 [59]. Pore size distribution of LDH suggests that LDH is made up of mesopores with a BET of 36 m2 g–1, an average pore diameter of 24 nm, and a pore volume of 0.22 cc/g. The BFO isotherm follows the type IV isotherm with a specific surface area of 11.9 m2 g–1. These results agree with those described in previous literature [60]. When BFO nanoparticles were incorporated into LDH, the surface area, pore volume, and average pore diameter of the composite decreased compared to those of LDH. This might be due to blockage of LDH pores in the nanocomposite, as seen in table 2.

Figure 4. Surface area and pore size distribution of ZnMgAl LDH, BFO, and BFO/LDH nanocomposite.
Download figure:
Standard image High-resolution imageTable 2. Textural properties of the prepared materials.
| LDH | BFO | BFO/LDH | |
|---|---|---|---|
| Surface area(m2 g–1) | 36.1 | 11.9 | 13.4 |
| Pore volume (cc/g ) | 0.22 | 0.042 | 0.003 |
| Average pore diameter (nm) | 24 | 14 | 8.9 |
3.5. TEM
The structure of the prepared materials was confirmed by transmission electron microscopy (TEM) and scanning electron microscopy (SEM), as shown in figure 5. A TEM image of LDH demonstrated that LDH has hexagonal plate-like particles (the typical morphology of co-precipitated LDH), confirming the successful synthesis of LDH nanosheets with lateral size. The TEM image of BFO reveals irregular spherical and rectangular-shaped nanoparticles with particle sizes ranging from 38 nm to 105 nm. Also, there is an accumulation of BFO nanoparticles due to the high temperature of calcination. For comparison, the TEM image of the composite exhibits morphological change where the presence of BFO is visible on the layered structure of LDH and represented by dark spots randomly dispersed over the light gray plate-like LDH. The SEM of the BFO/LDH composite is shown in figure 5(d) and exhibits the aggregation of uneven sheet-like nanoparticles. The homogenous distribution of Mg, Al, Bi, Fe, Zn, and O that constitute BFO/LDH was validated by nanocomposite mapping and EDX. The SEM, mapping, and EDX confirmed the formation of the prepared composite.

Figure 5. TEM of ZnMgAl LDH (a); BFO (b); and BFO/LDH nanocomposite (c). SEM of the composite (d); EDX (e) and mapping of the prepared composite.
Download figure:
Standard image High-resolution image3.6. XPS analysis
XPS was used to explore the chemical state of component elements and the BFO/LDH composite catalyst composition. The XPS profile of prepared materials is shown in figures 6(a)–(f). The BFO/LDH comprises O, C, Al, Mg, Zn, and Bi components. O 1s of BFO has one peak at 532.01 eV, corresponding to binding energy in O-M. C1s have three peaks at 284.9 eV for the C–C bond, 286.2 eV for the C–O bond, and 288.9 eV for the C-OO bond. The profile of Al 2p has a peak at 74.6 eV related to Al-O. The Mg 1s have two peaks at 1305.04 and 1303.8 eV, corresponding to Mg-O and Mg metal, respectively. Zn 2p has two binding energies at 1045.27 and 1022.15 eV, attributed to Zn 2p1/2 and Zn 2p3/2, respectively. The profile of Bi4F exhibits two peaks at 159.1 and 164.4 eV that are attributed to Bi 4F7/2 and Bi 4F5/2, respectively, and this confirms that Bi is in the Bi+3 oxidation state [61]. This result indicates that BFO is successfully supported on LDH.

Figure 6. XPS of BFO/LDH nanocomposite.
Download figure:
Standard image High-resolution image4. MB removal studies
4.1. Impact of ultrasonic time
Figure 7(a) shows the ultrasonic time effect on the percentage of MB adsorption. For both LDH and BFO/LDH, the percent MB adsorption removal increases dramatically within the first 10 min, with a slight change in dye removal. Shortening the time to reach adsorption equilibrium is due to the effect of ultrasound waves. The first reason is that the high pressure produced by ultrasound wave radiation in water creates bubble cavitation. Then bubbles collapse violently on the catalyst surface. Consequently, the boundary layer thickness on the catalyst solid surface has been reduced, and mass transfer has improved [62, 63]. The second reason is that ultrasound wave radiation enhances MB molecules diffusion to the adsorption sites available at this point [67, 68]. As a result, a higher number of dyes binding to the surface occurs. Within 20 min, 57.3 and 77.5% of removal were obtained for LDH and BFO/LDH, respectively. It can be shown that the modification of LDH with BFO increases the percentage of MB removal due to the many functional groups on the composite surface compared to LDH. In the current study, 15 min is considered the optimum contact time since the difference in percent removal of methylene blue using a longer time (20 min) is just 2%.

Figure 7. (a) Effects of ultrasonic time on the MB adsorption removal onto LDH and BFO/LDH; adsorbent weight = 0.5 g l–1, pH = 9, initial concentration of MB = 50 mg l–1, 30 °C); (b) Effects of adsorbent weight on the MB removal onto LDH and BFO/LDH, ultrasonic time = 15 min, pH = 9, initial concentration of MB = 50 mg l–1, 30 °C; (c) and (d) pH Effects of the MB removal and adsorption capacity onto LDH and BFO/LDH, ultrasonic time = 15 min, adsorbent doses = 1 g l–1, initial concentration of MB = 50 mg l–1, 30 °C).
Download figure:
Standard image High-resolution image4.2. The impact of adsorbent dose
The adsorbent amount is a significant parameter that disturbs the adsorption process. A series of experiments are tested with doses in the range of 0.3–2 g l−1 of MB (50 mg. l−1). As shown in figure 7(b), the removal of MB increases for LDH and BFO/LDH as the adsorbent dosage increases from 0.3 g l−1 to 1.0 g l−1 . However, after 1.0 g l–1 adsorbent weight, the MB dye molecules in the medium were insufficient to fully connect with all adsorption active sites on the composite surface, resulting in an equilibrium state.
4.3. Impact of PH
The influence of pH on percent MB removal and adsorption capacity A.C. was investigated throughout a pH range of 4 to 12. As shown in figures 7(c) and (d), increasing the pH value improved both the percent of MB removal rate and A.C. The significant adsorption rise with pH increase can be correlated to the surface charge and the accessibility of binding sites on the surface of the LDH composites [32]. The above results indicate that the highest MB adsorption by LDH or BFO/LDH was achieved at pH 12.
5. The impact of initial MB concentration and the adsorption isotherms
The initial MB concentration effects of LDH and BFO/LDH were examined. The results are shown in figure 8. The data in figure 8(a) indicates that the removal efficiency of MB molecules by LDH and BFO/LDH increases as the initial concentration of MB reduces because of the higher mobility of MB molecules at the lower initial concentration [64]. At 20 mg l−1, LDH and BFO/LDH achieved the highest elimination efficiency (94.7 and 98.9%, respectively). The MB adsorption onto the LDH and BFO/LDH increased when the initial MB concentration was raised, as shown in figure 8(b). The MB adsorption capacity onto LDH and BFO/LDH improved from 18 to 169 mg g−1 and 19 to 189 mg g−1, respectively. The rise in the quantity of MB adsorbed for both catalysts might be attributed to ultrasonic wave radiation that enhances contact between the active sites of the LDH and BFO/LDH and the MB molecules.

Figure 8. (a) Effects of initial concentration of MB on LDH and BFO/LDH, (b) adsorption capacity; ultrasonic time = 15 min, adsorbent doses = 1 g l–1, pH, 30 °C).
Download figure:
Standard image High-resolution imageThree isotherm models, including Langmuir, Freundlich, and Temkin, were examined to explain MB adsorption on the adsorbent surfaces of LDH and BFO/LDH (figure 9). The relative adsorption parameters evaluated by the Langmuir, Freundlich, and Temkin isotherms are listed in table 3. According to the Langmuir model, adsorption happens on a monolayer, and all active sites on the adsorbent are homogenous and have the equivalent A.C. The equation (4) denotes the Langmuir isotherm equation.

Where the equilibrium concentration (E.C.) was denoted as Ce (mgl−1), Qe is the quantity of the dye removed at equilibrium (mg g−1), the Langmuir constants qmax (mg.g−1) concerning A.C., and K.L. (L.mg−1) is the rate of adsorption. The Freundlich isotherm model implies that the adsorbent surface is heterogeneous and that the adsorbate favorably occupies the stronger binding sites. Its linear form is given as an equation (5).

Where the Freundlich constant is Kf linked to A.C. and 1/n is the heterogeneity factor correlated to adsorption intensity. The 1/n value is between 0.1 and 1.0, indicating a good adsorption process. The index value in this work was within the range, representing a favorable adsorption process.

Figure 9. Isotherm model plot of Langmuir (a), Freundlich (b), and Temkin (c) for MB adsorption by LDH and BFO/LDH : ultrasonic time = 15 min, adsorbent doses = 1 g l–1, pH =12, initial concentration of MB = 50 mg l–1, 30 °C.
Download figure:
Standard image High-resolution imageTable 3. LDH and BFO/LDH composite isotherm parameters for MB adsorption.
| Absorption isotherm | Isotherm parameters | LDH | BFO/LDH |
|---|---|---|---|
| Langmuir | qmax(mg·g−1) | 239.2344 | 244.4988 |
| KL | 0.082397 | 0.40495 | |
| RL | 0.195318 | 0.047064 | |
| R2 | 0.99802 | 0.99908 | |
| Freundlich | Kf(mg·g−1) | 21.44865 | 57.78033 |
| n | 1.580553 | 1.764197 | |
| R2 | 0.96124 | 0.93716 | |
| Temkin | BT (J·mol−1) | 45.52776 | 45.61691 |
| KT (L·mg−1) | 1.140621 | 5.661685 | |
| R2 | 0.95587 | 0.9754 |
The Temkin isotherm model studies adsorbent-adsorbate interactions and may be linearized as equation (6) [65].

Where R represents the universal gas constant (8.314 J.mol.−1K−1) and T is the absolute temperature in Kelvin. B is the Tempkin constant linked to sorption heat (J. mg−1).
The coefficients (R2) values obtained by the Langmuir model for LDH and BFO/LDH were 0.998 and 0.999, respectively, higher than those produced by other models. As a result, the adsorption of LDH and BFO/LDH for MB was homogeneous, uniform monolayer adsorption. The R.L. values obtained are in the (0 < 1) range, indicating that MB adsorption was favorable, with the formation of a monolayer on the surface of the adsorbent. The Langmuir maximum A.C. (qm) for the absorption of MB molecules by LDH and BFO/LDH was 239 and 244 mg g−1, respectively, which were similar to other adsorbents employed in recent years (table 4). The Temkin model showed that the adsorption reaction is endothermic since the B value (Tempkin constant) is positive.
Table 4. The comparison of maximum MB adsorption of different adsorbents.
| Adsorbents | Maximum adsorbtion capacity (mg g–1) | Reference |
|---|---|---|
| MgAl-LDH/Biochar | 406.47 | [32] |
| BFO/LDH | 244.49 | This work |
| ZnAl/DS LDH | 113 | [66] |
| MgAl/DS LDH-iron oxide | 110 | [67] |
| MMT@NiFe LDH | 99.18 | [68] |
| Fe/SCD-LDH | 83.40 | [69] |
| NiAl LDH/Biochar | 61.72 | [70] |
| MgAl LDH | 43.48 | [71] |
| CaAl LDH- biochar | 32.53 | [72] |
| LDH-bacteria aggregates | 5.23 | [73] |
| (MLG-BNCs)Cross-linked | 64.5 | [74] |
| Intercalated MgCr-LDH | 8.741 | [75] |
| CoZnAl-LDH/GO | 169.49 | [76] |
Table 4 compares the removal capabilities of several adsorbent materials for MB. The A.C. (qm) of MB on LDH and BFO/LDH was higher than that of many adsorbents but lower than that of MgAl-LDH/Biochar [32]. The MB adsorption by LDH composites was more rapid than that of MgAl-LDH/Biochar, indicating that it may be used in cost-effective wastewater treatment. Furthermore, LDH and BFO/LDH are low-cost during MB adsorption, and adsorption occurs at lower adsorbent doses and temperatures. Consequently, LDH and BFO/LDH show potential as novel, compatible adsorbents for treating organic dye-polluted wastewater. The lower capacity of the composite than MgAl-LDH/Biochar might be apparently assigned to the affinity of the surface groups (the organic functional group seems to be higher affinities for organic dyes as compared to inorganic functional groups of the composite), hydrophilic surface of the composite as compared to biochar, and finally the higher surface area of biochar.
6. Kinetics study
For further clarifications on BFO/LDH composite adsorption behavior, kinetics models are used to assess the rate and mechanism of MB mass transfer (M.T.) from the liquid phase to the LDH and BFO/LDH surfaces. The pseudo-first and second-order kinetics models were studied in this work. Lagergren presented the pseudo-first-order model in a linear form, as shown in equation (7), while Ho and McKay summarized the linear form of the pseudo-second-order model, as shown in equation (8).


Where qe and qt are the A.C. (mg.g−1) of MBat equilibrium and time t, respectively, k1 (min−1) and k2 (g.mg−1.min−1) are the rate constants. Figure 10 shows the linear curves drawn using pseudo-first and second-order kinetic models, with the values of qe, k1, k2, and R2 itemized in table 5. The correlation coefficient (CC) of the pseudo-second-order model for both LDH and BFO/LDH is significantly greater than the correlation value of the pseudo-first-order model. Furthermore, the measured qe values for 'the pseudo-second-order' closely matched the experimental data. As a result, MB dye adsorption by LDH and BFO/LDH follows a pseudo-second-order model, implying that the chemisorption process dominates MB adsorption. As shown in figure 11, the MB dye will be adsorbed on the surface of the prepared composite by a physical bond. Earlier studies have revealed that electrostatic interactions with organic molecules control the adsorption mechanism of LDH for cationic dyes. Hence, electrostatic attractions between the negative surface charge of the adsorbents and the cationic dye are effective.

Figure 10. Kinetics curves of pseudo-first and second order for MB adsorption onto LDH and BFO/LDH: ultrasonic time = 15 min, adsorbent doses = 1 g l–1, pH = 12, initial concentration of MB = 50 mg l–1, 30 °C.
Download figure:
Standard image High-resolution imageTable 5. The kinetic model parameters for methylene blue adsorption.
| Adsorption Kinetics | Parameters | LDH | BFO/LDH |
|---|---|---|---|
| Pseudo-first order | qe (mg g–1) | 15.03 | 28.70 |
| K1 (min–1) | 2.7*10–3 | 4.1*0–3 | |
| R2 | 0.88 | 0.88 | |
| Pseudo-second order | qe (mg g–1) | 31.03 | 40.70 |
| K2(g mg-1 min-1) | 0.015 | 0.019 | |
| R2 | 0.99 | 0.99 |

Figure 11. Proposed mechanism of MB adsorption.
Download figure:
Standard image High-resolution image7. Statistical optimization
7.1. Validation of the statistical model
The validation and significance properties of the design and its descriptive model (the second-order quadratic polynomial model) were assessed based on the dep inspection of the variance function (ANOVA). The statistical design suggests 16 suggested random tests considering the number of studied variables (three variables (A. time, B. pH, and C. dosage) (table 6).
Table 6. The suggested experimental runs and the determined response (removal of MB (%)).
| Std | Run | Time (min) (A) | pH (B) | Dosage (g l–1) (C) | Removal of MB (%) (Y) |
|---|---|---|---|---|---|
| 13 | 1 | 10.00 | 10.00 | 0.50 | 79.3 |
| 4 | 2 | 15.00 | 12.00 | 0.50 | 88.7 |
| 10 | 3 | 15.00 | 10.00 | 0.75 | 86.3 |
| 15 | 4 | 10.00 | 10.00 | 0.75 | 84.2 |
| 16 | 5 | 10.00 | 10.00 | 0.75 | 84.2 |
| 12 | 6 | 10.00 | 12.00 | 0.75 | 93.6 |
| 2 | 7 | 15.00 | 8.00 | 0.50 | 75 |
| 14 | 8 | 10.00 | 10.00 | 1.00 | 91.2 |
| 1 | 9 | 5.00 | 8.00 | 0.50 | 67.3 |
| 11 | 10 | 10.00 | 8.00 | 0.75 | 80.3 |
| 7 | 11 | 5.00 | 12.00 | 1.00 | 88.3 |
| 5 | 12 | 5.00 | 8.00 | 1.00 | 77.7 |
| 8 | 13 | 15.00 | 12.00 | 1.00 | 99.6 |
| 6 | 14 | 15.00 | 8.00 | 1.00 | 89 |
| 3 | 15 | 5.00 | 12.00 | 0.50 | 75.3 |
| 9 | 16 | 5.00 | 10.00 | 0.75 | 77.4 |
The fitting degree of the linear regression relationship between the theoretically predicted removal percentages of MB and the experimentally detected values demonstrates significant agreement between them, with a determination coefficient (R2) higher than 0.98 (figure 12(A)). Therefore, the suggested experiments, according to the statistical assumption of the quadratic polynomial model, exhibit significant properties and can be addressed to describe the effect of the experimental factors on the removal of MB dye as well as the expected interaction effects between these variables. Moreover, the recognized prediction deviation curve of the 16 experiments reveals the remarkable regular distribution of the plotted points above and below the reference line within the range from −1.34 up to 1.5 (figure 12(B)). Additionally, the presented linear regression relation of the studentized residuals reflects the high accuracy and normality properties of the selected model during the prediction processes for the effects of the studied variables (figure S2).

Figure12. The correlation between the experimentally detected removal percentages of MB and the predicted results (A) and the standard deviation of the MB removal percentages for the suggested 16 tests.
Download figure:
Standard image High-resolution imageThe analysis of ANOVA functions considering the values of model-F, model-Prob > F, lack of fit, and the sum of squares gives significant indications about the validation of the studied models and the assessed variables as inputs (table 7). The observed values of model F are 56.5, demonstrating the high significance of the applied polynomial model during the prediction processes with less than 0.01% chance of the presence of noise effects (table 7). The recognized model-Prob-F values of the three assessed variables are lower than 0.05%, which validates their significant properties as experimental factors. Moreover, this reveals the nonlinear relations between the studied variables as inputs and the determined removal percentages of MB as a response (table 7). Additionally, the considerable agreement between the estimated values of Pred R-Squared (0.84), Adj R-Squared (0.96), and Adeq Precision (30.49) reflects the adequate signal of the removal processes of MB by BFO/LDH and the significance of the applied polynomial model to navigate the space of the statistical design (table 7).
Table 7. Analysis of variance (ANOVA) for the studied design (CCRD) considering the effective parameters.
| Source | Sum of Squares | DF | Mean Square | F-Value | Prob > F | Significantly |
|---|---|---|---|---|---|---|
| Model | 985.91 | 9 | 109.55 | 56.53 | <0.0001 | Significant |
| A | 272.48 | 1 | 272.48 | 140.60 | <0.0001 | |
| B | 311.36 | 1 | 311.36 | 160.67 | <0.0001 | |
| C | 357.60 | 1 | 357.60 | 184.53 | <0.0001 | |
| A2 | 34.69 | 1 | 34.69 | 17.90 | 0.0055 | |
| B2 | 5.72 | 1 | 5.72 | 2.95 | 0.01367 | |
| C2 | 0.14 | 1 | 0.14 | 0.070 | 0.03799 | |
| AB | 3.51 | 1 | 3.51 | 1.81 | 0.02269 | |
| AC | 0.15 | 1 | 0.15 | 0.078 | 0.03789 | |
| BC | 0.10 | 1 | 0.10 | 0.052 | 0.0268 | |
| Residual | 11.63 | 6 | 1.94 | |||
| Lack of Fit | 11.63 | 5 | 2.33 | |||
| Pure Error | 0.000 | 1 | 0.000 | |||
| Cor Total | 997.54 | 15 | ||||
| Std. Dev. | 1.39 | R-Squared | 0.9883 | |||
| Mean | 83.56 | Adj R-Squared | 0.9709 | |||
| C.V. | 1.67 | Pred R-Squared | 0.8420 | |||
| PRESS | 157.59 | Adeq Precision | 30.494 |
By Considering the results of the variances analysis of the approaches and the validation of the studied model, the obtained relations between the studied variables as inputs and the determined removal percentages of MB as response can be described according to the polynomial regression equation (equation (9).


7.2. Interaction effect of the essential factors
7.2.1. The time interval and pH
The effect of the adsorption time interval of MB (50 mg l−1) as a function of the adjusted pH of the solutions was studied considering the applied dosage of BFO/LDH at the intermediate value (0.75 g l−1). The interaction relationship between the solution pH and the adsorption interval as well as their impacts on the removal percentages of MB were assessed based on the obtained 3D regression curve (figure 13(A)). The detectable trends demonstrate a significant enhancement in the effect of the adsorption intervals on the removal percentages of MB with a regular increase in the solution pH from pH 8 up to pH 12. At pH 8, the increase in the time intervals by 5 min, 10 min, and 15 min resulted in an increment in the MB removal percentages by 72.7%, 80.3%, and 81.8%, respectively. By adjusting the solution pH to pH 10, the removal percentages enhanced to 77.4% (5 min), 84.2% (10 min), and 86.3% (15 min). At the upper level of the studied pH (pH 12), the MB removal percentages enhanced significantly up to 82.5% (5 min), 93.6% (10 min), and 95.3% (15 min). This behavior was previously assigned to the impact of the high alkaline conditions on inducing the electrostatic attraction of the dissolved MB molecules on the deprotonated surface of BFO/LDH.

Figure 13. 3D regression curves for the interaction between time interval and pH (A), time intervals and adsorbent dosages (B), and the adsorbent dosages and the solutions pH (C) on the removal percentages of MB dye.
Download figure:
Standard image High-resolution image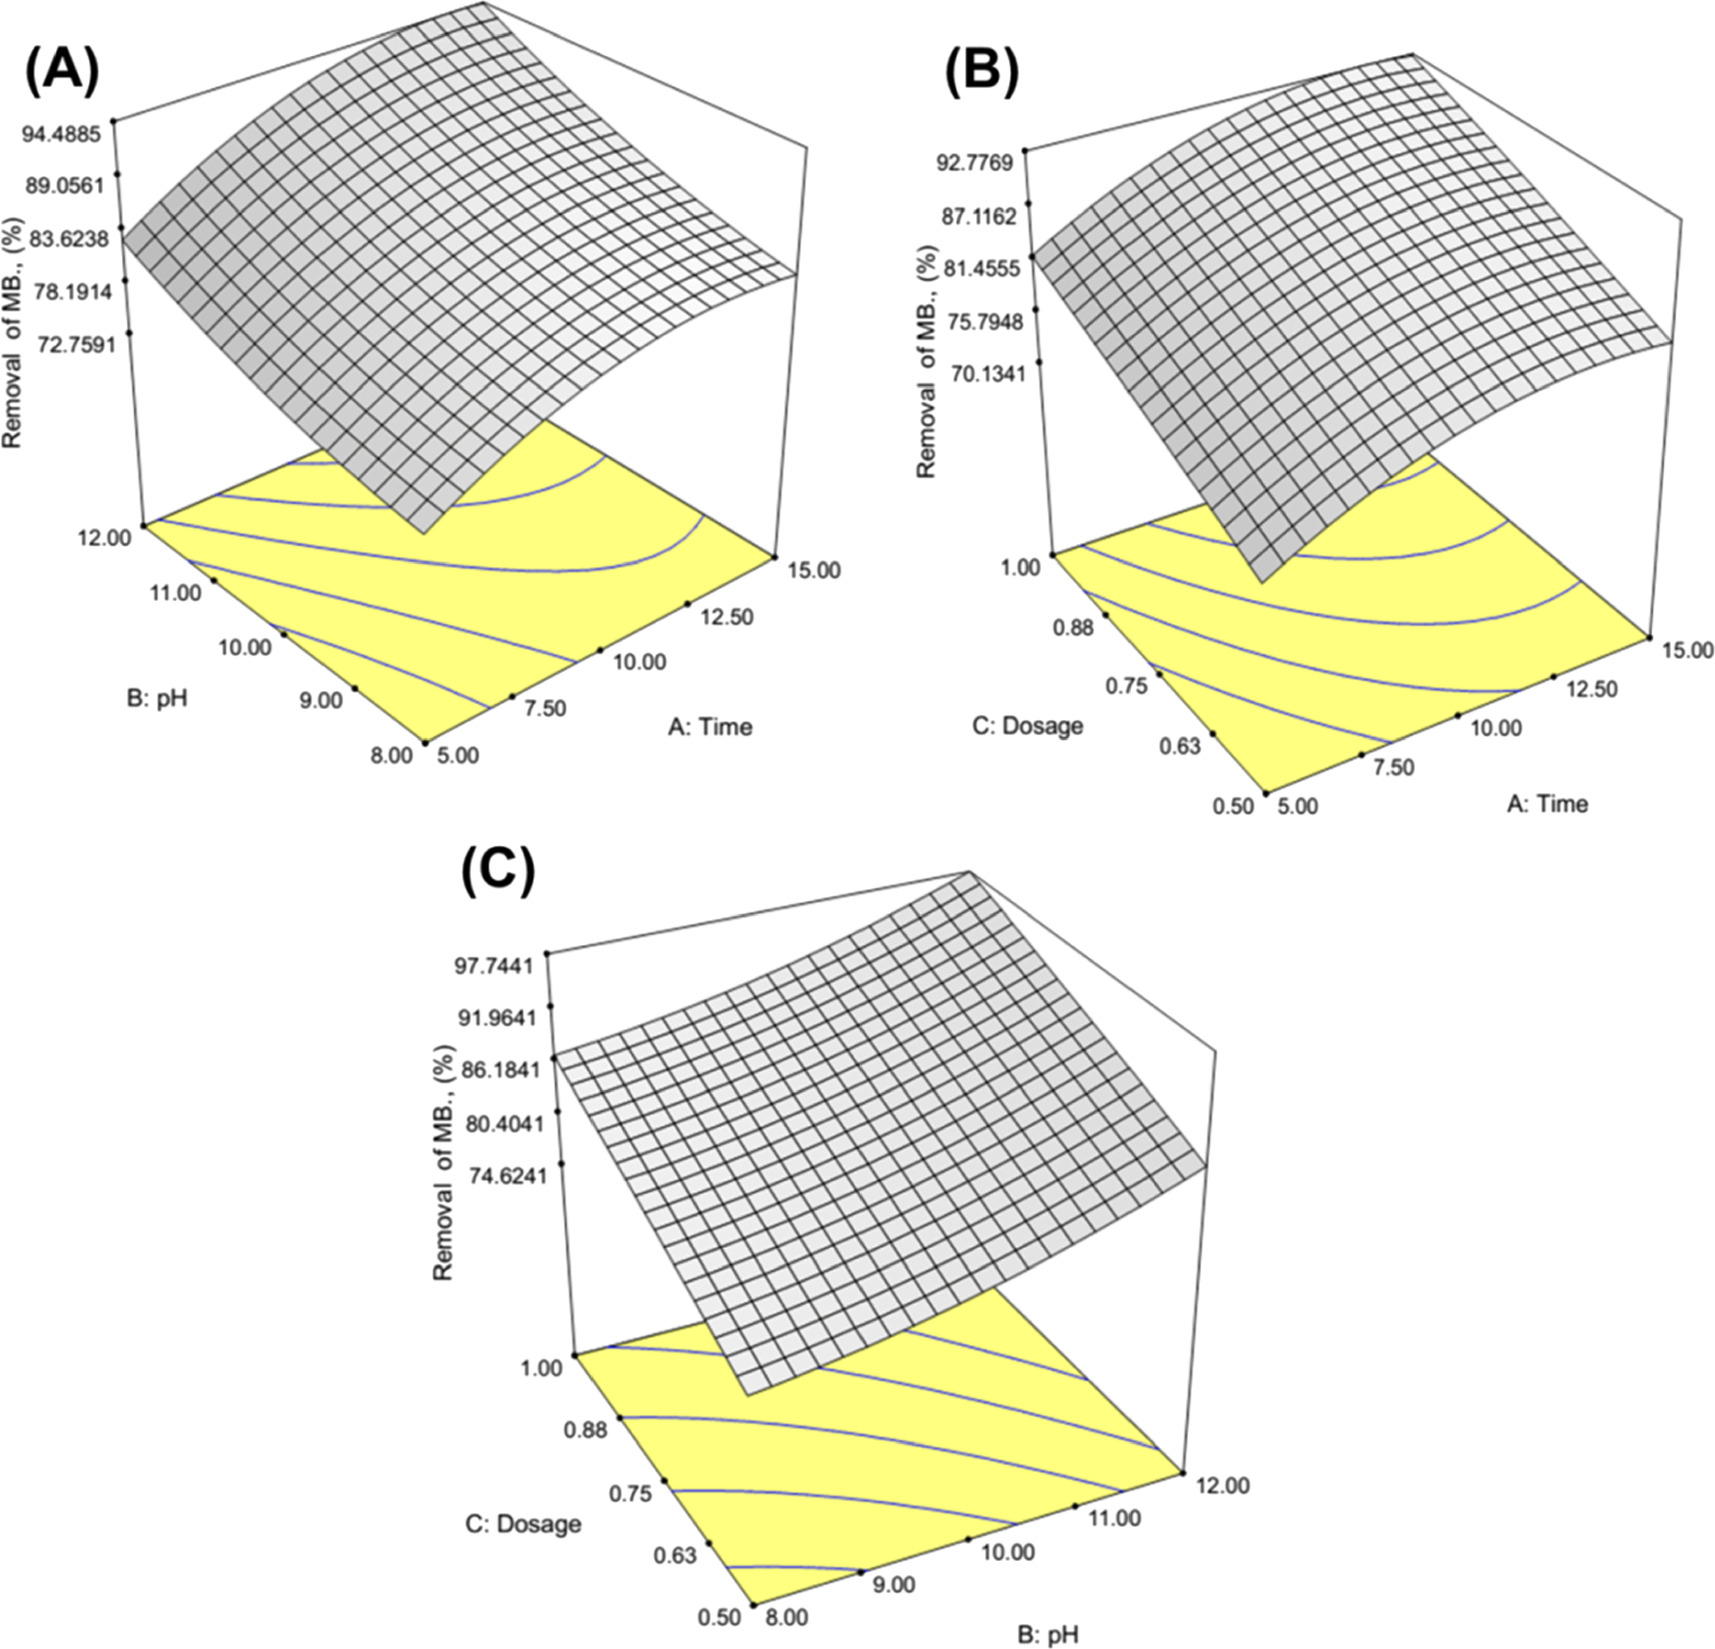
7.2.2. The time interval and BFO/LDH dosage
The effect of the adsorption time interval of MB (50 mg l−1) as a function of the BFO/LDH dosage was studied, considering the solution pH at its upper-level value (pH 12). The interaction relationship between the applied dosage of BFO/LDH and the adsorption interval, as well as their impacts on the removal percentages of MB, were assessed based on the obtained 3D regression curve (figure 13(B)). In the presence of the BFO/LDH particles at the lower level of the studied dosages (0.5 g l−1), the increase in the time intervals from 5 min up to 15 min resulted in an increment in the MB removal percentages from 75.3% up to 88.7%, respectively. At the studied dosage of 0.75 g l−1, the removal percentages enhanced to 82.5% (5 min) and 95.3% (15 min). The incorporation of BFO/LDH as an adsorbent at its highest dosage (1 g l−1) induces the removal percentages of MB strongly to 88.3% (5 min) and 99.6% (15 min).
7.2.3. The solution pH and BFO/LDH dosage
The effect of the applied BFO/LDH dosage on the adsorption removal of MB (50 mg l−1) as a function of the adjusted pH was assessed considering the adsorption contact time at its high level (15 min). The interaction relationship between doses and pH as well as their impacts on the removal percentages of MB were assessed based on the obtained 3D regression curve (figure 13(C)). At the lower level of pH (pH 8), the increase in the incorporated BFO/LDH dosages from 0.5 g l−1 up to 1 g l−1 resulted in an enhancement of the MB removal percentages from 75% up to 89%, respectively. At pH 10, the determined MB removal percentages increased to 80.3% (0.5 g l−1) and 92.5% (1 g l−1). At the upper level of the experimental pH (pH 12), the removal of MB enhanced significantly up to 88.7% (0.5 g l−1) and 99.6% (1 g l−1).
7.3. Statistical optimization
Based on the optimization function of the used software (Design-Expert software) as well as the prediction option according to quadratic polynomial programming, the suggested or predicted solutions to optimize or enhance the removal percentages of MB by BFO/LDH are presented in table 8. The suggested experimental conditions and their related MB removal percentages were estimated considering the upper and lower levels of the three test variables. The suggested solution as well as the determined removal percentages are similar to the experimentally detected optimum conditions (15 min contact time, 1 g l−1 dosage, and pH 12). The predicted condition suggested a neglected reduction in the time interval, used dosage, and solution pH. Additionally, the suggested enhancement in the removal percentage is of neglected value and cannot be considered a remarkable enhancement. This can reflect the successful detection of the best conditions experimentally.
Table 8. The suggested best solutions for removal of MB dye using BFO/LDH as adsorbent.
| Solution number | Time (min) | pH | Dosage (g l–1) | Removal of MB (%) | Desirability |
|---|---|---|---|---|---|
| 1 | 14.3 | 11.94 | 0.99 | 99.7 | 1.000 |
| 2 | 13.7 | 11.9 | 1 | 99.8 | 1.000 |
| 3 | 14.4 | 12 | 0.97 | 99.49 | 1.000 |
| 4 | 13.58 | 11.96 | 0.97 | 99.46 | 1.000 |
8. Conclusion
The modification of ZnMgAl LDH with BFO by the in situ co-precipitation method is a simple way of fabricating BFO/LDH nanocomposite for cationic dye MB sorption from an aqueous medium. Adsorption experiments were carried out to investigate the impact of process factors on adsorption efficiency and identify the optimal parameters that resulted in the maximum elimination of MB. The parameters studied were initial dye concentration, adsorbent dose, pH, temperature, and contact duration. The results showed that MB adsorption by LDHs was highly rapid, with the adsorption process reaching a steady state within 15 min. The adsorption of MB on the adsorbents was strongly dependent on solution pH and temperature, with MB adsorption preferred at high solution pH and low temperature. Langmuir, Freundlich, and Temkin models were used to match the adsorption data. The Langmuir isotherm provided a better description of the adsorption data, with the maximum adsorption capacity of MB on BFO/LDH estimated to be 244.49 mg g−1. The kinetics of adsorption followed the pseudo-second-order reaction model. BFO and LDH have the potential to be efficient adsorbents for the removal of MB from aqueous solutions.
Acknowledgments
The authors extend their appreciation to King Saud University for funding this work through Researchers Supporting Project number (RSP2023R133), King Saud University, Riyadh, Saudi Arabia
Data availability statement
All data that support the findings of this study are included within the article (and any supplementary files).
Recommensation
Further studies will be conducted to determine the impact of the used substarte on the adsorptive properties of LDH composites based on experimental and theoretical mechanistic studies considering different species of synthetic basic and acidic dyes.