
Abstract
Peat (Mekong River Delta, Vietnam) was naturally dried, and then mixed with coal slag in the ratio of 70:30 by weight to use as adsorbent to treat wastewater from Pangasius catfish ponds in batches. The adsorbent was used in a specific designed system to treat Pangasius pond wastewater in a continuous flow model at a speed of 0.3 m3.h−1. The treatment system has operated for 9 consecutive hours in each experiment batch. The results show that the system can treat a large amount of wastewater (64.8 m3) with the efficiency (%) of BOD5 of 95.78%, COD of 95.3%, total phosphorous of 73% and total nitrogen of 89.79%. After treatment, the quality of wastewater has met the standards to be discharged into the environment.
Export citation and abstract BibTeX RIS

Original content from this work may be used under the terms of the Creative Commons Attribution 4.0 licence. Any further distribution of this work must maintain attribution to the author(s) and the title of the work, journal citation and DOI.
1. Introduction
Pangasianodon hypophthalmus (Pangasium) farming in Vietnam has come out as one of the most impressive aquaculture developments in the world, with a rapid grow in production and export volumes, contributing significantly to Vietnamese economy [1]. Pangasius farming also becomes the main source of livelihood for many households in the country, especially in the Mekong Delta. At present Vietnamese pangasius products were exported to more than 149 countries in the world, accounting to a total value of US$ 2.2 billion [2]. However, this rapid development comes along with a challenging environmental issue caused by a large amount of wastewater discharge from this industry. Infact, the area of Pangasius farms in Vietnam is projected to reach over 13 000 hectares [3], implying that the amount of water supply and wastewater for this activity is extremely large. It was reported that an increasing amount of wastewater has been released into the environment, from 15,000 to 25,000 m3.hec−1.crop−1 in average. Anh et al [4] also reported that 1 tonne of frozen fillets discharges around 740 kg BOD, 1020 kg COD, 2050 kg TSS, 106 kg nitrogen and 27 kg phosphorus, of which wastewater from fish ponds makes up up to 60%–90% and sludge from fish ponds and wastewater from processing facilities contributes 3%–27% of the total discharge. Generally, the combined waste discharges from Pangasius production and processing account for around 1% of the total suspended solid (TSS), nitrogen and phosphorus loads in the Mekong Delta. Phan et al [5] reported that most of the wastewater was directly released to the main river and canals (82%) while only a small part of the effluent was screened (7.8%) and treated with chlorine and lime (11.2%). Without effective and reasonable treatment methods, water pollution will become more and more serious. Fortunately, solutions to address this issue are available considering developing low-cost treatment method and reusing the effluent streams. The implement of wastewater treatment plants at low operational cost could potentially minimize water pollution from pangasius farming. Several techniques have been reported for this purposes, e.g. Bacillus subtilis/poly (acrylic acid)/sodium bentonite was used to treate sludge from Pangasius fish ponds [6] or a batch surface-constructed wetland system cultivated with Hymenachne acutigluma grass was employed to treat wastewate from catfish ponds [7]. However, a low-cost technological solution to reduce water pollution problems for Pangasius production and processing is still challenge.
Adsorption is an effective and environmentally friendly treatment method, especially for absorbing heavy metal ions and pollutants in industrial and agricultural wastewater. There have been some studies that used peat-derived materials to adsorb heavy metal ions, textile dyes in wastewater with high efficiency [8]. However, with a large amount of wastewater from aquaculture, it is necessary to find a more efficient adsorbent that can be easily manufactured in bulk quantity form available raw materials. Efficient adsorbents usually consist of two components including adsorbent material and foaming agent. The dispersion of adsorbent material onto the foaming agent can not only increase surface area but also create porous structure. The adsorbent used in a continuous adsorption tank needs to satisfy a number of requirements including the suitability of pore size, as small pore might block the flow while large pore might reduce the adsorption efficiency because of fast flow rate through the pores; high mechanical strength to ensure the stability of porous structure, avoiding collapsing, and therefore flow blockage throughout the operation of the system.
A study in 1976 by the Geological Survey Agency of Vietnam has documented peatland area of 12,400 ha in U Minh Thuong and 20,200 ha in U Minh Ha [9]. Peatland reserve in U Minh, Mekong River Delta, Vietnam offers one of the country's largest resources of peat (about 456 million m3). This peat is in good quality due to high humic acid (30%–31%) and humus (46%–55%) content, low ash content and high water holding capacity. Peat is considered as a material for plant nutrients and humic substances and an adsorbent for heavy metals [8].
Fired clay brick and tile productions are popular in the Mekong Delta due to increasing construction demand. The entire region has 3,857 establishments producing fired clay bricks and tiles with a capacity of 3,303 million bricks, of which there are only 30 tunnel kilns with a capacity of more than 15 million bricks per year each, with an output of 692 million bricks that discharge the huge amount of coal-slag. The coal-slag discharge has led to serious environmental problems. Fortunately, this waste can be transformed into a potential adsorbent material in bulk quantity, yet at low cost, which is practically significant. The combination of peat with abundant active sites for adsorption and coal-slag with porous structures is expected to generate a novel adsorbent with synergistic effect from the individual components.
To the best of our knowledge, few articles report on the use the peat coal slag composite as an adsorbent to treat wastewater from Pangasius catfish ponds in the continuous flow adsorption. In this study, we develop an adsorbent from peat and coal slag which are locally available to treat wastewater from catfish pond in a continuous flow system to meet the needs of bulk volume wastewater treatment.
2. Experimental
2.1. Materials
Peat (U Minh, Mekong River Delta, Vietnam) was exploited at a depth of 1.5–4.0 m. It was then thinly spread on corrugated iron sheets and dried directly under the sun (average temperature 55 °C) for 4 h a day, from 10:30 a.m. to 2:30 p.m for 5 consecutive days. The obtain material was sifted through a sieve (Ø = 1 mm) to remove sand, rocks, and other debris. Coal slag was collected from local brick kilns and mixed with dried peat in a simple approach. Briefly, pretreated peat and coal-slag were mixed thoroughly in small batches to a desired ratio of peat/coal slag. The mixture was washed in tap water with stiring for several times and then dried for many days. This process was repeated for several times to obtained an evenly dried material. The adsorption capacity of the three materials at peat/coal slag weight ratio of 70:30; 80:20; 90:10 was preliminarily tested in a foam container. The material at weight ratio of 70:30 was chosen for further studied as it exhibited highest adsorption capacity as well as maintain smooth flow in the tested system
2.2. Chemical analysis
In the present work, the environmental criteria are measured according to the Vietnam Standards for water and waster water. Input and output wastewater were evaluated for the following properties: pH; the dissolved oxygen (DO); the chemical oxygen demand (COD); the 5-day biological oxygen demand (BOD5); N-NH4; N-NO3; Total nitorogen (Total-N) and Totoal phosphorus (Total-P). The sampling, preservation and analysis of the samples were performed according to Vietnam standards (TCVN 6001-1:2008 for BOD5 analysis; SMEWW 5220 C:2012 for COD analysis; TCVN 6638:2000 for N-Total analysis; EPA 350.2 for N-NH4 analysis; TCVN 6202:2008 for P-Total analysis; and TCVN 6180:1996 for N-NO3 analysis) (See supplementary information, Part I).
2.2.1. Batch adsorption
Adsortion kinetics was studied to estimate the equilibrium time and the adsorption capacity of the material for nutrients in wastewater of catfish ponds. In a typical experiment, 2.0 grams of the material was suspensed in 1000 ml of wastewater by stirring with a magnetic stirrer. After certain time intervals (30, 60, 90, 120, 150, 200 and 240 min.), 10 ml of sample were taken and centrifuged to remove the solid. The pH, DO, BOD5, total phosphorus (Total-P), N-NH4, N-NO3, and total nitrogen (Total-N) in the supernatant were determined following TCVN (Vietnamese standards). The details are decribed in the supplementatry information (See part I).
In this study, the adsorption capacity qe (mg/g) for each adsorbate in Pangasium catfish pond wastewater was calculated according to the formula:
where Co, Ce are the initial concentration and equilibrium concentration of each nutrient in catfish pond wastewater, respectively (mg.l−1). V is the volume of solution (L), m is the mass of the adsorbent (g).
The pseudo-first/second order kinetic models are emplyed to expose the kinetics of the adsorption process. The pseudo-first/second order kinetic model of is expressed in nonlinear form as equation (1) and (2), respectively [10]


where k1 (min−1), k2 (gmg−1.min−1) are the rate constant of the pseudo-first and pseudo-second-order kinetic model, respectively. The others parameters are describle above. The parameters of models are determined by the least-square fit method.
2.2.2. Treatment of wastewater from Pangasius catfish pond in a continuous fluid flow system
The tanks are arranged to ensure that the wastewater can flow completely from Tank 1 to Tank 2 through Faucet 1 (F1), from Tank 2 to Tank 3 through Faucet 2 (F2) as shown in figure 1. Faucet 1 and Faucet 2 were used to adjust the flow rate of the wastewater (figure 1). A filter was attached to Faucet 2 to prevent the adsorbent from passing through Tank 3. Wastewater from Pangasius catfish pond (Tank 1) flows continuously to the treatment tank (Tank 2) at a rate of 0.3 m3.h−1. The volume of wastewater in Tank 2 was maintained at 0.9 m3. The total amount of treated wastewater is 1.8 m3, flowing continuously in 06 h. The amount of adsorbent was 4.5 kg (∼2.5 kg m−3). Two circulating pumps were used in Tank 2 instead of agitators. After 3.0 h (180 min, 0.9 m3), the wastewater was allowed to flow out of Tank 2 through Faucet 2. After certain intervals, water samples were taken at Faucet 2 outlet and in Tank 3 to assess the quality of wastewater after treatment.
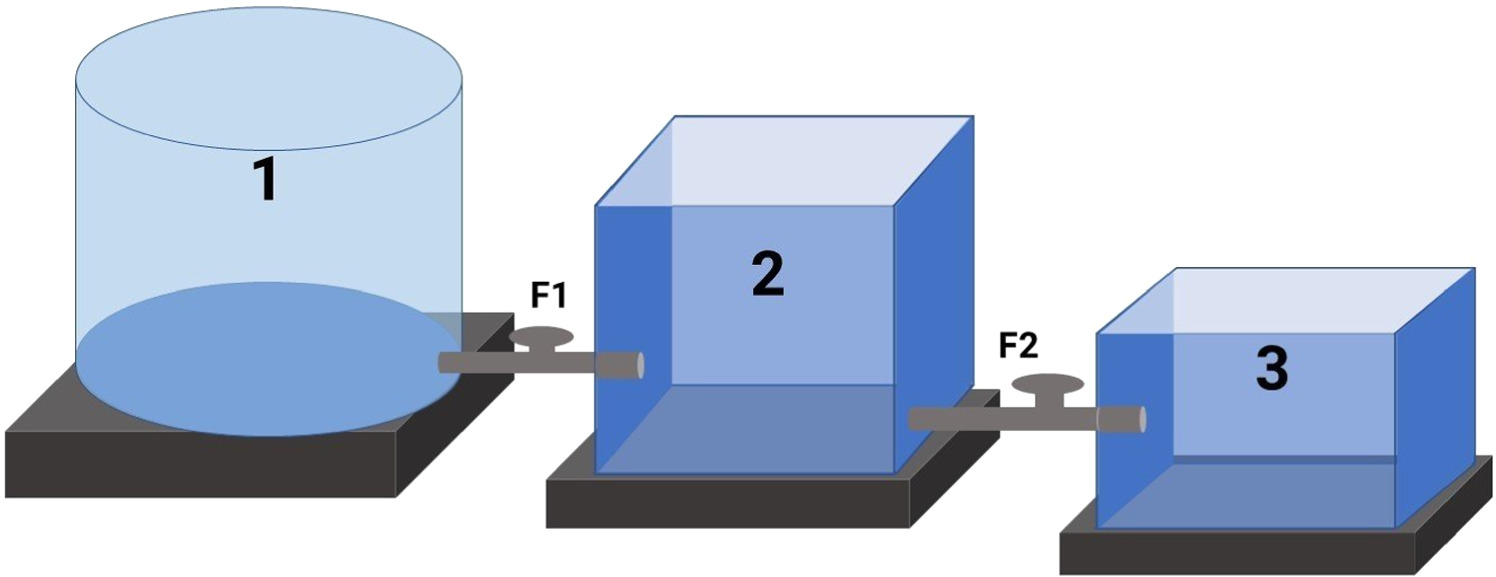
Figure 1. Model of wastewater treatment system for Pangasium catfish ponds (a) Pangasius catfish farming tank 1 with volume of 2.0 m3; (b) Treatment tank 2 with volume of 1.5 m3 (1.2 × 2.5 × 0.5 m); (c) Water tank 3 after treatment with volume of 1.8 m3 (1.2 × 1.5 × 1.0 m).
Download figure:
Standard image High-resolution image2.2.3. Treatment of wastewater from pangasius catfish pond in a continuous-flowing system with adding solid phase in Tank 2
In this treatment (figure 2), the adsorbent system was filled to 60% of the volume of Tank 2 including: 0.5 m3, equivalent to 625 kg of material and 0.4 m3 of gravel (size 1–2 cm, mainly positioned at Faucet 1 and Faucet 2 to circulate the flow in the system). Coal slag was added to the system to increase porosity and ensure unobstructed flow. Wastewater was designed to flow from Tank 1 to Tank 2 at a rate of 0.3 m3.h−1 for one hour to fully cover the adsorbent in Tank 2 (equivalent to 0.3 m3 of wastewater). Then the wastewater begins to flow through Tank 3 through Faucet 2.

Figure 2. Model of wastewater treatment system for Pangasium catfish ponds.
Download figure:
Standard image High-resolution imageThe treatment system was operated for 36 times, continuously in 24 weeks (06 months), in line with the periodic water change for pangasius ponds (in the first 3 months, water was changed weekly, i.e. 12 times, in the next 3 months, water was changed twice a week, 24 times). The system was operated for 9 consecutive hours, of which wastewater flew from Tank 1 to Tank 2 for 6 h at a flow rate of 0.3 m3.h−1, equivalent to the flowing of 90% of the water in the catfish pond (1.8 m3). Wasterwater was let to flow from Tank 2 to Tank 3 after 3 h and for another 3 h. Wastewater samples were analysed in the pond and in Tank 3 to evaluate the wastewater treatment capacity of the system. The analysis was done for 07 times at week 1, 2, week 12, week 16, week 20, week 22 and week 24. The treatment system was cleaned with domestic wastewater 03 times in 6 h each before carrying out the process of treating catfish pond wastewater. The cleaning process also helped to regulate the flow rate of 0.3 m3.h−1 and stabilize the adsorbent material in the system.
The research system was set next to the pangasius pond, with an area of 1200 m2 to be proactive in terms of breed, food and water sources. The experiments in this system was designed to run continuously for about 18 months, including testing in Styrofoam containers and building the system in which fish farming and experimenting in the system over 12 months including rainy and dry seasons. Therfore, this system was covered under a mobile awning to prevent the dilution of samples by rainwater or rapid evaporation by sunlight irradiation, distorting the analysis. When applied in practice, an overhead cover may not be needed.
3. Results and discussion
3.1. Characterization of the adsorbent
The XRD patterns of peat, coal slag and peat/coal slag composite are presented in figure 3(a). The XRD patterns of individual peat and coal slag material show characteristic peaks of crystalline SiO2 (quartz) at 2 θ of 20.8, 26.6, 36.5, 39.5 and 42.4 corresponding to (100), (001), (110), (310) and (012) planes (JCPDS 01-079-1910) indicating that quartz is the major component while the other components might exist in amorphous forms. It is notable that these peaks appear at lower intensity in the XRD pattern of peat/coal slag composite which is consistent with lower Si content in the composite (7.9%) compared to that in peat (31.81) (table 1). This result is evidence of composite formation between peat and coal slag. The adsorption–desorption isotherm of the material is presented in figure 3(b) showing that the hysteresis curve has a clear condensation step, and the capillary system is opened up. The specific surface area of the peat and coal/slag-peak composite were calculated to be 15.7 and 14.2 m2.g−1, respectively. The surface area of coal slag with solid structure is too small to be measured by nitrogen adsorption/desorption isotherms. Therfore, the surface area obtained from nitrogen adsorption/desorption isotherms can be mainly attributed to that of peat. Although the amount of coal slag accounts for 30% of the composite weight, the specific surface areas of peat and its composite are almost the same indicating that although coal slag could not contribute directly to increasing surface area, it can act as a matrix for the dispersion of the peat to create the porous structure so that the obtained surface area are not significantly reduced. Figure 3(c) presents the FITR spectrum of composite. The spectrum exhibits various peaks at 3372 cm−1, 2921 cm−1, 1618 cm−1, 1422 cm−1, 1035 cm−1, corresponding to -O-H, C-H, C=O, C-OH (phenol), Si–O–Si vibrations, respectively. Adsorption peaks in the range from 1200 to 800 cm−1 can be assigned to other functional groups in humic acid. Meanwhile, the peak at 797 cm−1 is characteristic for Si- C vibration and that at 471 cm−1 is typical for sulfur functional group such as S-H, C-S. The functional groups including hydroxyl or carboxylate act as adsorptive sites towards electron acceptors (ammonium salt or metal ions). Furthermore, aromatic rings in peat also attract the organic compounds containing aromatic rings via π–π interactions. These interactions are expected to create high adsorption and exchange capacity of the material. The mophorlogy of peat and coal/slag composite consists of irregular layers with meso-microporous structures that is preferable for the adsorption (figure 3(d)).
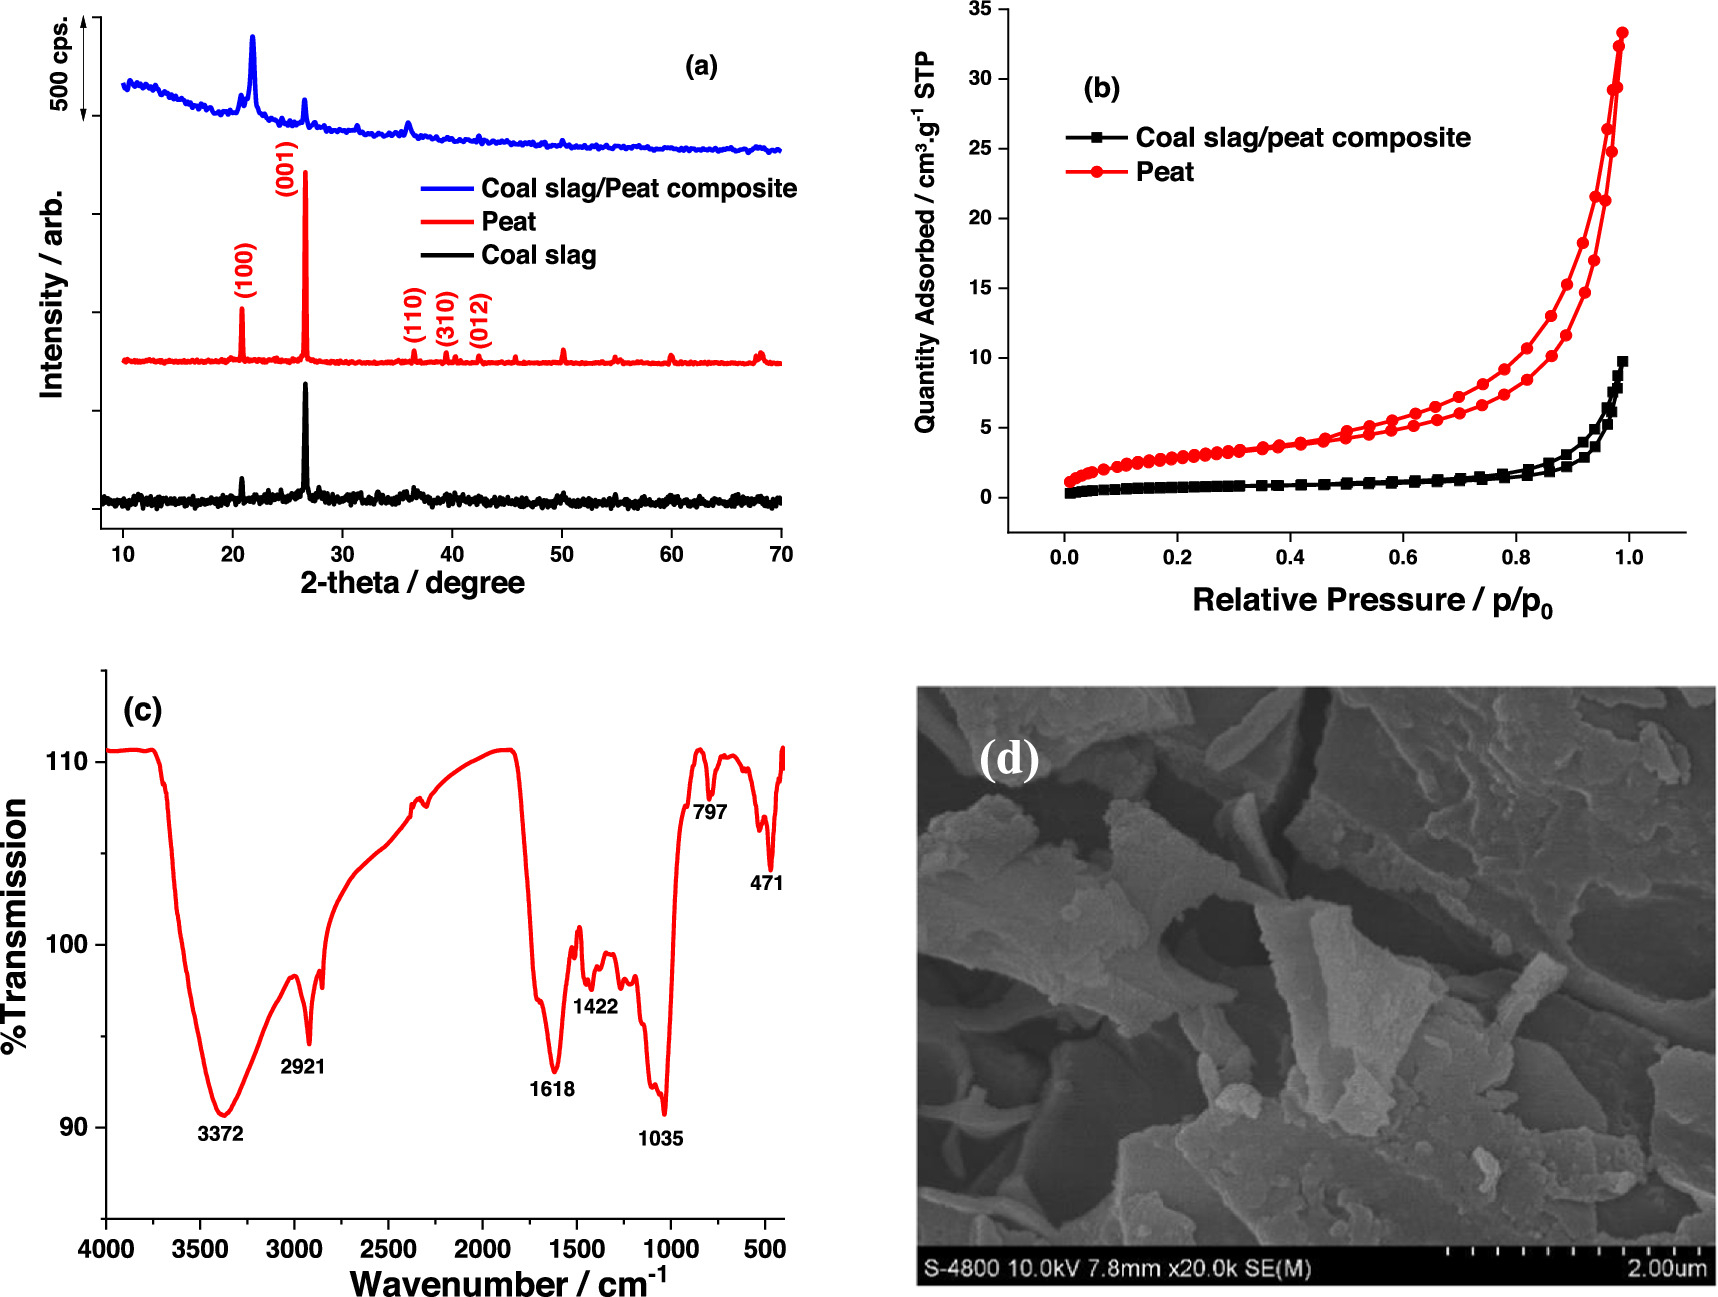
Figure 3. (a) XRD patterns of peat, coal slag and coal slag/peat composite, (b) nitrogen adsorption/desorption isotherms of peat and coal slag/peat composite; (c) FITR of coal slag/peat composite and (d) SEM observation of coal slag/peat composite.
Download figure:
Standard image High-resolution imageTable 1. Elementaty composition in materials prepared from peat (% weight).
| C | O | Al | Si | S | Total | |
|---|---|---|---|---|---|---|
| Composite | 42.64 | 45.45 | 3.22 | 7.90 | 0.79 | 100 |
| Peat | 18.10 | 48.29 | 1.80 | 31.81 | — | 100 |
3.2. The wastewater treatment of Pangasius ponds using peat/coal slag composites
During the course of 18 months of the designed experiments, some difficulties have arouse challenging the experiemental analysis. Firstly, as sample size was large, it is time-consuming to promply analyse the samples. Secondly, it was challenging to maintain an equal input and output flow rate by keeping simultaneously adjusting the faucets throughout the experiment. It also required the adjusting the height gap between the wastewater tank and the outlet faucet, otherwise the flow will be slowed down with time. Therefore, there must be an auxiliary tank with a large cross-section to limit this change, which took 3–4 weeks. Furthermore, the mixing ratio of peat and coal slag needed to studied carefully to find the appropriate one, ensuring continuous flowand high adsorption. The step of mixing peat and coal slag, washing and drying was time-consuming to ensure the uniformity. Finally, the system was online to take samples for analysis over time, regardless of day or night time.
The parameters such as biochemical oxygen demand (BOD), chemical oxygen demand (COD), total suspended solids (TSS), nitrogen total, and phosphorus total are widely used to estimate the water quality. BOD is an indicative measure of the amount of oxygen consumed by bacteria and other microorganisms at a specified temperature. COD represents the amount of oxygen that can be consumed by chemical reactions in the measured solution. Total Nitrogen presents the sum of nitrate (NO3), nitrite (NO2), organic nitrogen and ammonia. The discharge of nitrogen from Pangasius farming can end up in surface water and groundwater. The total phosphorus amount indicates how much phosphorus exists in a given wastewater sample. The amount of phosphorus is considered as a critical parameter to estimate the water quality. The slightest increment in phosphorus can activate algal blooms causing low dissolved oxygen content, which can damage certain aquatic species. The direct discharge of phosphorus and nitrogen species into waterpaths connected to the Mekong River causes eutrophication [4].
3.2.1. Adsorption kinetics
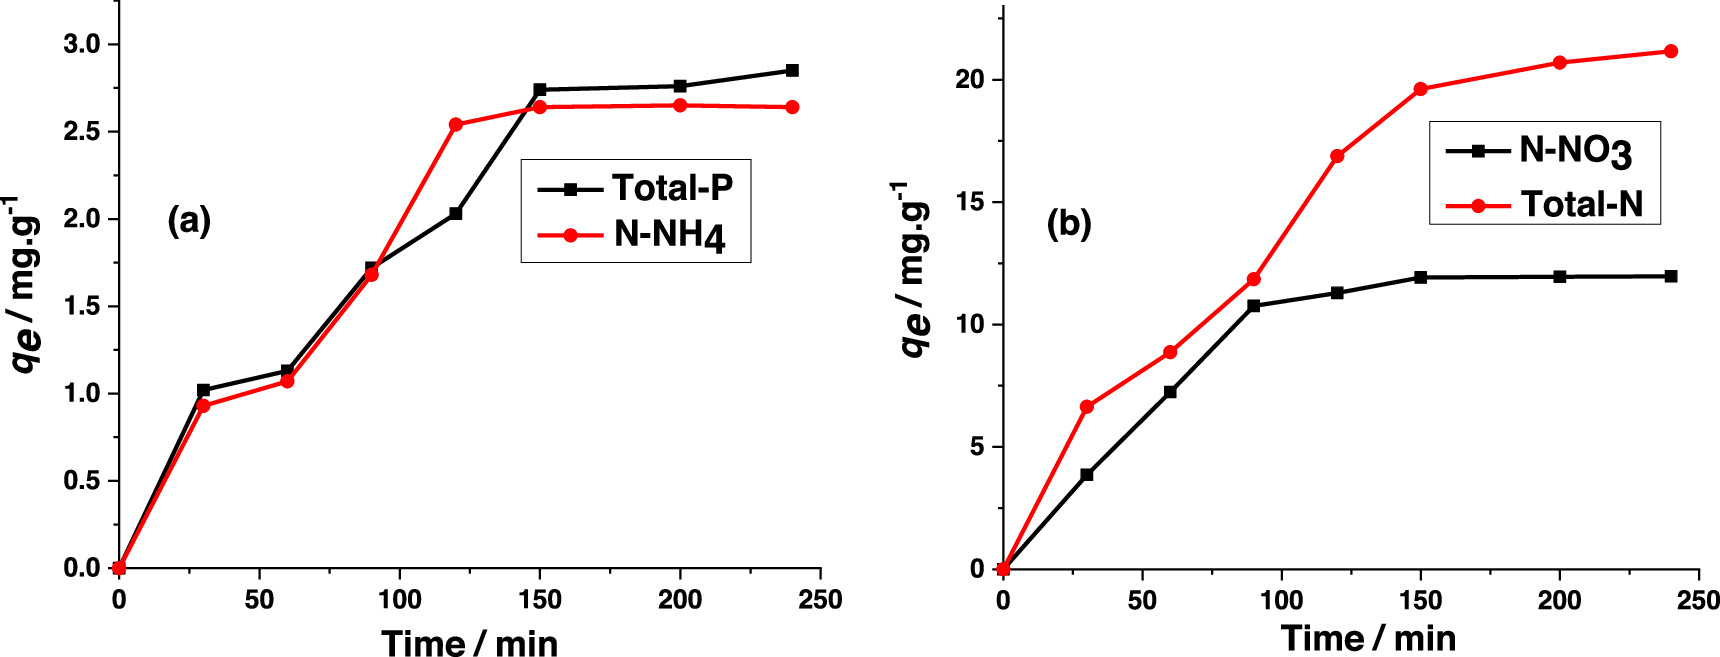
Adsorption kinetics for the Total-P, N-NH4, N-NO3 and Total -N are presented in figure 4. The kinetic parameters based on the pseudo first/second order kinetics are listed in table 2. It is clear that the determination coefficients, R2, obtained from the pseudo first-order kinetic model are higher than those obtained from the second-order kinetic model. Furthermore, the equilibirim adsorption capacity obtained from the first-order kinetic model is closed to the corresponding experimental value. Therefore, the pseudo-first order kinetic model was considered to better describe the adsorption kinetics of these parameters on the composite. The adsorption capacity toward Total-P and N-NH4 was not high, 2.85 and 2.64 mg l−1 respectively. However, for the adsorption of N-NO3 and Total N, adsorption capacity qe reached 11.97 and 21.16 mg l−1, respectively, equivalent to the published results of dye adsorption on peat [11].
Figure 4. Time dependence of adsorption capacity for total-P, ammonium (N-NH4) (a) and nitrate (N-NO3), total-N) (b).
Download figure:
Standard image High-resolution image
Table 2. The parameters of adsorption kinetic models for peat and coal/slag composite.
| The pseudo-first order kinetic model | The pseudo-second order kinetic model | ||||||
|---|---|---|---|---|---|---|---|
| qe,ex (mg.g−1) | qe (mg.g−1) | k1 (min−1) | R2 | qe (mg.g−1) | k2 (mg.g−1) | R2 | |
| Total-P | 2.85 | 3.38 | 0.0084 | 0.933 | 4.87 | 0.0013 | 0.931 |
| N-NH4 | 2.64 | 3.07 | 0.0103 | 0.897 | 4.32 | 0.0019 | 0.881 |
| Total-N | 21.16 | 25.45 | 0.0082 | 0.960 | 37.12 | 0.0001 | 0.977 |
| N-NO3 | 11.97 | 12.79 | 0.0016 | 0.948 | 16.51 | 0.0002 | 0.909 |
It was found that the adsorption equilibrium was reached after 150 min for Total-P, N-NH4, N-NO3 and Total - N (figures 4(a), (b)). The adsorption capacity of various nutrients increases sharply within 30 to 120 min of adsorption. Beyond 150 min, the adsorption capacity stays almost unchanged. Selected characteristics of wastewater in Pangasius farming before and after adsorption treament compared with Vietnamese standards for industrial wastewater and surface water quality (TCVN 5942–1995) are listed in table 3.
Table 3. Data of environmental parameters before and after adsorption treatment.
| Parameters | Co (mg/L) | Ce (mg/L) | A a | B a | A b | B b | qe (mg/g) | H (%) |
|---|---|---|---|---|---|---|---|---|
| pH | 7.81 | 6.92 | 6–9 | 5.5–9 | 6–8.5 | 5.5–9 | — | — |
| DO | 4.21 | 5.83 | — | — | ≥ 5 | ≥ 2 | — | — |
| BOD5 | 90.30 | 37.04 | 30 | 50 | 4–6 | 15–25 | — | 58.98 |
| COD | 135.47 | 73.07 | 75 | 150 | 10–15 | 30–50 | — | 46.06 |
| Total-P | 8.72 | 3.25 | 4 | 6 | — | — | 2.74 | 62.73 |
| N-NH4 | 10.53 | 5.24 | 5 | 10 | 0.3 | 0.9 | 2.65 | 50.24 |
| N-NO3 | 32.02 | 8.19 | — | — | 2–5 | 10–15 | 11.92 | 74.42 |
| Total-N | 56.15 | 16.92 | 20 | 40 | — | — | 19.62 | 69.87 |
a type: Vietnam standard of industrial wastewater when it is discharged into water sources according to QCVN 40:2011/BTNMT (Vietnamese standard 40:2011/BTNMT Ministry of natural resources and envirommental). b type: Vietnam standard of quality for surface water (QCVN 08-MT:2015/BTNMT).A and B apply to each different usage purpose.
Most of the measured parameters in the wastewater of Pangasius ponds exceed that in Vietnamese standard (QCVN) for discharged wastewater as shown in table 3, especially Total-N (56.15 mg.l−1) and chemical oxygen demand (COD: 135.47 mg.l−1). After adsorption treatment with the studied adsorbent in 150 min (at the dosage of 2.0 g.l−1), most of potential polluting substances in wastewater basically met the standards for discharged wastewater to tap water supply. Although the parameter of BOD5 and NH4 + are still higher than the requirement for tap water supply, they are acceptable for industrial discharged wastewater (B* type). Comparing with QCVN 08-MT:2015/BTNMT on the quality of surface water and wastewater, after adsorption, some criteria such as pH, DO, N-NO3 meet the requirements.
The efficiency of the treatment process for various pollutants in wastewater from Pangasius cat fish ponds ranges from 50 to 74% (table 3). Couillard et al [12] reported that the treatment capacity toward various nutrients in wastewater such as COD, BOD5, N and P depends on the peat origin, its manufacturing method, and treatment process. The treatment efficiency was reported in many works to reach over 90%, proving that peat material is a potential adsorbent in for wastewater treatment. In this study, after 150 min of adsorption treatment, the values of COD, total-P, total-N meet the type A* of QCVN 40:2011/BTNMT. This result shows that peat-base adsorbents are able to remove these pollutants from wastewater.
3.3. The treatment capacity of the adsorbent toward Pangasius catfish pond wastewater
With high adsorption capacity of nutrients and organic matter, the material was tested for bulk wastewater treatment in a continuous flow system as shown in figure 1. Because the maximum amount of wastewater flowing from Tank 1 through the Tank is 1.8 m3, the flow speed is 0.3 m3.h−1, so the continuous flow time is 06 h. The flow time to reach a volume of 0.9 m3 in Tank 2 is 180 min, 30 min longer than the reaction time to reach equilibrium to ensure contact time between nutrients and adsorbent materials due to the continuous flow of wastewater additional. The analysis of BOD5, COD, Total P, Total N parameters at the outlet of Faucet 2 are presented in table 4. The analysis of N-NH4, N-NO3 and other parameters was not done as a change in Total P, Total N implies a proportional change in those parameters.
Table 4. Concentrations (mg.l−1) of different parameters at Faucet 2 outlet at different flow times.
| Time (min) | Co | C (60) | C (90) | C (120) | C (150) | C (180) |
|---|---|---|---|---|---|---|
| BOD5 (mg.l−1) | 95.46 | 9.58 | 19.07 | 28.98 | 35.53 | 42.16 |
| COD (mg.l−1) | 143.92 | 16.79 | 34.03 | 50.92 | 65.22 | 78.59 |
| Total P (mg.l−1) | 10.15 | 2.98 | 3.41 | 3.99 | 4.54 | 5.82 |
| Total N (mg.l−1) | 61.23 | 8.02 | 15.08 | 21.36 | 27.85 | 32.91 |
Co: initial concentration of untreated wastewater, measured in Tank 1. Ct : concentration at Faucet 2 outlet at time t.
The continuous flow design of the treatment system leads to an increase in the ratio of wastewater volume to adsorbent amount with treatment duration. Therefore, the treatment efficiency drops upon increasing treatment duration. Therefore, to evaluate the wastewater treatment efficiency of the system, water samples must be analyzed at 02 locations. The results of the analysis of indicators BOD5, COD, Total-P, Total-N in Tank 3 are presented in table 5.
Table 5. Concentration of subtances in wasterwaters at Tank 3 at different times.
| Time (min.) | Co | C (60) | C (90) | C (120) | C (150) | C (180) | A** | B** |
|---|---|---|---|---|---|---|---|---|
| BOD5 (mg.l−1) | 95.46 | 9.25 | 15.53 | 21.96 | 26.04 | 31.45 | 4–6 | 15–25 |
| COD (mg.l−1) | 143.92 | 15.37 | 27.78 | 40.08 | 53.22 | 65.66 | 10–15 | 30–50 |
| Total P (mg.l−1) | 10.15 | 2.78 | 3.02 | 3.41 | 3.70 | 3.92 | — | — |
| Total N (mg.l−1) | 61.23 | 7.80 | 10.20 | 13.45 | 16.92 | 20.31 | — | — |
Co: initial concentration of subtances in untreated wastewater in Tank 1; C: concentration of subtances at location and analysis time . A** and B** were decribed in table 3.
It is clear from table 5 that because of the continuous flow system design, the concentration of the studied parameters is lower in Tank 3 compared to that at the outlet of Tank 2 as it was mixed with lower concentration treated wastewater that was already in Tank 3. Comparing with QCVN 08-MT:2015/BTNMT on the quality of surface water and wastewater, after 120 min of adsorption in continuous flow system, the concentration of BOD5 and COD in wastewater meets quality requirements (type B*). However, the longer the flow time, the more wastewater flows through the system, i.e. the adsorption capacity of the material decreases. Therefore, from 120 min onwards, the wastewater quality only meets the requirements for discharge into the environment according to QCVN 40:2015 which can not be used for domestic purposes and irrigation according to QCVN 08-MT:2015.
The treatment efficiency of the system is assessed by the amount of nutrients and organic matter in the treated wastewater compared to the wasterwater input (table 6).
Table 6. Adsorption capacity (q, mg.g−1) and treatment efficicency (H%) in in Tank 3 at 180 min.
| Time (min) | Co (mg.l−1) | C (180) | A | B | q (mg.g−1) | H (%) |
|---|---|---|---|---|---|---|
| BOD5 (mg.l−1) | 95.46 | 31.45 | 30 | 50 | — | 67.05 |
| COD (mg.l−1) | 143.92 | 65.66 | 75 | 150 | — | 54.38 |
| Total P (mg.l−1) | 10.15 | 3.92 | 4 | 6 | 2.49 | 61.34 |
| Total N (mg.l−1) | 61.23 | 20.31 | 20 | 40 | 16.37 | 66.83 |
The results in table 6 show that the treatment efficiency (H%) ranges from 54 to 67% for different parameters. Furthermore, the concentration of all studied parameters in treated wastewater is lower than that stated in column *A in QCVN, ensuring discharge standards. Interestingly, the adsorption capacity for Total-P (2.49 mg.g−1) was significantly lower than that of Total-N (16.37 mg.g−1). It is understandable as the concentration of Total-P in the wastewater is low, leading to modest adsorption capacity. The treatment capacity (q, mg.g−1) and efficiency (H %) at the time t for wastewater samples collected from Tank 3 are presented in table 7.
Table 7. Treament efficiency (H%) and adsorption capacity (q) at different times for four parameters.
| Time (min) | Parameters | BOD5 | COD | Total-P | Total-N |
|---|---|---|---|---|---|
| 60 min | q (mg.g−1) | — | — | 1.97 | 14.25 |
| H (%) | 90.31 | 89.32 | 72.61 | 87.26 | |
| 90 min | q (mg.g−1) | — | — | 2.14 | 15.31 |
| H (%) | 83.73 | 80.69 | 70.25 | 83.34 | |
| 120 min | q (mg.g−1) | — | — | 2.25 | 15.93 |
| H (%) | 76.99 | 72.15 | 66.40 | 78.03 | |
| 150 min | q (mg.g−1) | — | — | 2.37 | 16.25 |
| H (%) | 72.72 | 63.02 | 63.55 | 72.37 |
From 60 to 150 min of treatment, the adsorption capacity q (mg.g−1) gradually increased, while the treatment efficiency (H%) gradually decreased as shown in table 6. The shorter the flow time, the lower the concentration of substances in catfish pond wastewater, the higher the treatment efficiency. And depending on the requirements on quality of the wastewater, the treatment process can be designed to terminate before or after 180 min. In this study, the termination time at 180 min is appropriate, because the concentration of substances in treated wastewater is of the standard for discharge according to QCVN 40:2011/BTNMT.
In order to increase the efficiency of wastewater treatment of the designed system, moving towards practical application, in this study, 60% of Tank 2 is filled with adsorbent and gravel (figure 2). The results in table 6 show that, with the adsorbent dosage of 2.5 g.l−1, in 180 min, the treated wastewater meets the discharge standard. The efficiency (H%) of wastewater treatment in the first week is shown in table 8. The adsorption capacity is not used to evaluate the treatment capacity because the amount of adsorbent used is too large.
Table 8. Initial wastewater concentration and treatment efficiency (H%) of the system in 1st week.
| Parameters | BOD5 | COD | Total-P | Total-N | |
|---|---|---|---|---|---|
| 1st Week | Co (mg.l−1) | 95.12 | 140.29 | 10.50 | 57.61 |
| C (mg.l−1) | 8.14 | 12.34 | 2.56 | 6.37 | |
| H (%) | 91.44 | 91.20 | 75.62 | 88.94 |
Co: initial concentration, C: concentration of substances in wastewater after treatment for 1 week.
The results in table 8 show that the initial concentration (Co) of various parameters in Pangasius catfish pond wastewater is substantially high, overexceeding the regulations and not being eligible to discharge directly into the environment. However, after the 1st week of treatment (week 1), the wastewater quality is significantly improved, indicating by low concentration of studied parameters. This result shows that this designed treatment method and system possess good treatment ability of the adsorbent as well as the treatment method. The treatment efficiency is from 75 to 91% with the highest values for BOD5 and COD treatment, the concentration decreases very deeply, from 140.29 to 12.34 mg.l−1. This observation is in good agreement with kinetic study in which the adoption process occurred quickly at the earlier adsorption stage.
In the course of this experiment, it was found that the initial concentration (C0) at different weeks measured in Tank 1, the catfish pond, did not vary significantly and was equivalent to week 1 due to good control of feed intake and regular water changes. However, at the 2nd week, the concentration of substances in treated wastewater decreased sharply, especially BOD5 value, which decreased from 95.12 to 4.68 mg.l−1 and COD which decreased from 140.29 to 7.25 mg.l−1 as shown in table 8. It is also noteworthy that BOD5, COD values in the first week is significantly higher than those in the following week. Morever, the difference between these value with the average one of the next 04 weeks is large, 8.14 compared to 4.09 mg.l−1 for BOD5, and 12.34 compared to 6.53 mg.l−1 for COD. This can be explained by the fact that peat was obtained from natural source, and was only dried under the sun at 55 °C. Therefore, some of the oily substances that adhere to the material have not yet evaporated. In the first week of treatment, they were washed away by wastewater, causing BOD5 and COD values to increase. Similarly, at week 2, the BOD5 and COD values were also higher than the mean values. From the 12th week onwards, once the oils were mostly washed away, the BOD5, COD values were stable around the average value. This effect can be negligible in small scale experiments, yet with the use of 625 kg of adsorbent, the huge influence is unavoidable.
Total P, Total N values at weeks 1, 2, 12, 16, 20 in table 9 are low and almost stay unchanged. The values of BOD5, COD at weeks 12, 16, and 20 are also low and approximately the same, showing that the adsorbent in the system is effective in treating specific pollutants in wastewater.
Table 9. Contents of subtances in the wastewater after treatment at 2nd, 12th, 16th and 20th weeks.
| BOD5 | COD | Total P | Total N | ||
|---|---|---|---|---|---|
| C (mg/l) | 2nd week | 4.68 | 7.25 | 2.24 | 6.05 |
| 12th week | 3.86 | 6.34 | 2.45 | 6.14 | |
| 16th week | 3.98 | 6.47 | 2.56 | 5.96 | |
| 20th week | 3.87 | 6.05 | 2.46 | 5.80 | |
| The mean of 4 weeks: | 4.09 | 6.53 | 2.43 | 5.99 |
Initial concentrations and concentrations of substances in the treated wastewater at week 22 and week 24 are presented in tables 10, 11.
Table 10. Contents of subtances in the wastewater before and after treatment at 22th week.
| BOD5 | COD | Total P | Total N | ||
|---|---|---|---|---|---|
| 22nd | Co (mg.l−1) | 96.78 | 148.20 | 10.57 | 58.78 |
| C (mg.l−1) | 4.14 | 6.78 | 2.62 | 6.10 | |
| H (%) | 95.72 | 95.42 | 75.21 | 88.94 |
Co : intial concentration of parameters, C: concentration of paramenters after treatment at 22nd week.
Table 11. Contents of subtances in the wastewater before and after treatment at 24th week.
| BOD5 | COD | Total-P | Total-N | ||
|---|---|---|---|---|---|
| 24th week | Co (mg.l−1) | 97.60 | 148.71 | 10.63 | 60.92 |
| C (mg.l−1) | 4.12 | 6.99 | 2.87 | 6.22 | |
| H (%) | 95.78 | 95.30 | 73.0 | 89.79 |
Co : intial concentration of parameters, C: concentration of parameters after treatment at 24th week.
The concentration of these parameters at the 22nd week (table 10) and the 24th week (table 11) does not differ much from the previous weeks, showing that the adsorption capacity of these substances in wastewater onto peat material remained stable. The treatment efficiency increases from 75.21% to 95.72% in the 22nd week, from 73% to 95.78% in the 24th week showing high efficiency of the wastewater treatment system.
The study of adsorption saturation (qe ) is important for the evaluation of adsorbent performance. The saturation adsorption capacity of Total-P and Total-N were perfomed when wastewater flew through the system (containing 2.0 kg of adsorbent) at the rate of 0.3 m3.h−1. After a certain period of time, the concentration of the parameters of the input wastewater and the output treated one is equal which means that the material has no additional adsorption capacity (the details see the supplemanrary information). The qe value for Total P and Total N was found to be 2.93 mg.g−1 and 21.53 mg.g−1, respectively.
According to calculations, with the use of a dosage of 2.5 g.l−1, 625 kg of adsorbent can treat 250 m3 of wastewater to a satisfactory standard, corresponding to nearly 140 operations. Besides, with a long treatment time (06 months) in water or humid environment, the pollutants in wastewater can also be naturally decomposed by microorganisms, so the treatment efficiency of the system can be higher.
It is notable that after 24 weeks, the environmental indicators remained stable, showing that the adsorption capacity of the adsorbents has not yet reached saturation. Because the pangasius farming cycle has completed (in 6 months), the experiment has also terminated. Furthermore, the operating cost for 1 week is very large.
The limitation of this method is that the adsorption capacity of the material decreases after an extended use. Because, the adsorption capacity was not as high as in static adsorption, the treatment process was prolonged, releasing a large amount of adsorbent. Some further recommendations to overcome the cons of this approach include researching into material regeneration; optimizing adsorbent materials using available adsorbent sources such as activated carbon and gravel; directly growing plants into the adsorbent as it is considered a source of nutrients in the soil, stimulating plant growth due to the presence of humic subtances; recycling adsorbed materials to make organic fertilizer.
4. Conclusions
The peat-derived adsorbent material, which can be simply obtained in large quantities, has been studied to adsorb nutrients and organic substances in Pangasius catfish pond wastewater. The material has high porosity and good adsorption capacity.
A continuous flow treatment system was designed to employ peat adsorbent in liquid and solid form to operate in 06 months. The results showed that the concentration of specific parameters in the wastewater decreased significantly after the treatment process, from 97.60 mg.l−1 to 4.12 mg.l−1 with treatment efficiency (H%) of 95.78% for BOD5, and from 148.71 mg l−1 to 6.99 mg.l−1 with treatment efficiency of 95.30% for COD, from 10.63 mg.l−1 to 2.87 mg.L−1 with the treatment efficiency (H%) of 73.0% for Total P and from 60.92 mg.l−1 to 6.22 mg.l−1 with the treatment efficiency (H%) of 89.79% for Total N. These results magnifest that the proposed system with peat/coal slag is promising in treating wastewater of Pangasius ponds.
Acknowledgments
This article is funded by the Ministry of Education and Training under the project with Code number: B2020.SPD.02.
Data availability statement
All data that support the findings of this study are included within the article (and any supplementary files).
Supplementary data (0.1 MB DOCX)