
Abstract
Bio-based silica gel is having many commercial significances in various sectors, such as medical, cleansing agents in industries, laboratory analysis, cosmetics, food additives, and so forth. In view of crucial requirements, this study aimed to synthesize and characterize the silica gel from Ethiopia's primary post-harvest biomass residue, known as teff straw. The present study has been emphasized to investigate on the influence of calcination time for teff straw ash [Joshi et al 2022 Investigation of bamboo leaves as an alternative source of silica: extraction, characterization and its application as an adsorbent for methylene blue sequestration Chem. Select.7, e202200011] preparation between 2 to 5 h. Further, the specific surface area of the resultant TSA samples was examined for preliminary understandings of processing time. By adopting the standard procedures through template-mediated sol–gel process, acquired TSA samples were subjected to treatment with NaOH to result sodium silicate solution and the amorphous silica. From the findings, it was apparent that the yield of silica gel has significantly influenced by calcination time. Accordingly, the maximum yield (90.0%) was attained at the calcination time of 4 h at 900 °C. Further, physiochemical and morphological characteristics of acquired silica gels were ascertained using sophisticated instrumental techniques such as BET, FTIR, XRD, SEM, and EDX. The XRD analysis of the crystallographic characteristics showed that the silica extracted from TSA at 900 °C for 2, 3, 4, and 5 h was found to be in amorphous state. The surface morphological studies of silica gel samples have been carried out using SEM studied. the EDX spectra showed the negligible amount of other impurities, nevertheless a larger amount of silica was found with highest purity of 99.77% e silica gel was obtained in TSA calcinated at 3 h. FTIR spectrum confirmed the presence of siloxane (Si–O–Si) vibrations of amorphous silica that are responsible for the strong bend observed at 1070 cm−1. It was found that the silica gel prepared at 3 h of calcination time had the largest specific surface area of 739.242 m2 g−1, pore volume of 0.32 cm3 g−1, and a pore diameter of 1.68 nm.
Export citation and abstract BibTeX RIS

Original content from this work may be used under the terms of the Creative Commons Attribution 4.0 licence. Any further distribution of this work must maintain attribution to the author(s) and the title of the work, journal citation and DOI.
1. Introduction
Silica gel is One of the significant value-added products, which has a wide range of applications, such as in cleaning, cosmetics, drug delivery, polymer preparation, strengthening, anti-caking, and other areas. Due to its numerous excellent characteristics, including chemical inertness, non-toxicity, good adsorption, and high surface area, silica gel gains increasing interest, hence being used in water filtration and waste-water treatments [1, 2]. Silica can be prepared from inorganic and amorphous polymer of silicic acid with tetrahedrally organized SiO4 units that makes up the typical silica gel molecule. Further, oxygen is bonded to this polymer to form silane bonds (Si–O–Si) [3]. Based on its preparation methods, silica gel can be classified into three types, such as aqua gel [4], xerogel [5] and aerogel [6]. Characteristically, the aqua gel type of silica gel that has frequent water-filled holes. whereas the xerogel has an aqueous phase in which the pores are eliminated through vaporization. In the case of aerogel, supercritical extraction is executed to get rid of the solvent. Among them, the use of xerogels is quite significant for preparing dense ceramics. The high surface area and porosity of xerogel have led to its potential application in filler for chromatographic columns, ultra-filters, and catalytic substrates [4, 7], removal of heavy metals [8] as well as the elimination of organic contaminants from waste waters [9].
In general, a costly raw material like silica is used to prepare the silica particles, such as polyethlydiorthosilicate, tetramethylorthosilicate, tetraethylortothosilicate. For the industrial production of silica particles, sodium silicate is frequently utilized [10, 11]. Recent studies point out during the production of silica particles, the employees are affected by occupational health problems such as silicosis, which has been associated with lung cancer, emphysema, and pulmonary tuberculosis while they have been exposed to long period in production environment. Moreover, during processing, because of its flammability, dangerous antecedents, high cost, difficulties with handling (shipping and storage), and energy-intensive process, it could not be a promising method for [12]. Therefore, it is an essential to look for a feasible and affordable method to produce silica gel. In this line, as a substitute in this case, preparation of silica gel using leftover biomass, such as rice husk ash [13], sugarcane leaf [14], palm tree [15], rice straw [16], oat husk [17], sugarcane bagasse [14], coffee husk [18], corn cob [19, 20], wheat straw [21], maize leaves [22], bamboo leaf [23], and teff straw [24] are gaining more interest because of this approach addresses simple manufacturing procedure and economically affordable , can be a better option.
In this context, for bio-based silica (biosilica) production, different methods have been used up by exploiting the various agricultural leftovers as a feedstock. Among them, the hydrothermal technique [25], sol–gel processing [26], plasma and combustion method [27], and chemical vapor deposition (CVD) [28] are the most extensive techniques. In this application, silica is most commonly produced commercially via the CVD process [1]. However, the disadvantage of CVD is that it needs high processing temperatures to cause precursors to silica to disintegrate [29] which makes it difficult to control phase composition, particle size, and morphology [29]. Although the hydrothermal process is quick and easy [30], while creating smaller silica particles, certain problems have varied unfavorable repercussions compared to silica compounds of a bigger size [30]. Besides, it requires high energy and high-pressure autoclaving to achieve the better crystalline nature of the silica [31]. The simple solution method, which is one of these techniques and is a component of sol–gel, offers the advantages of low processing costs and convenience in managing the SiO2 characteristics, purity, homogeneity, or alteration of material composition [32]. Additionally, it has been demonstrated to have the ability to manufacture silica gel. Sol–gel provides several advantages over other techniques, including the ability to control the size, texture, and surface characteristics of materials, a low cost, great quality, and the capacity to create bigger surface areas [33]. Using the sol–gel method, silica gel can be extracted from the ash of agricultural wastes through acid treatment to transform into gel. From the ash of agricultural wastes, silica gel can be extracted using the sol–gel technique through acid treatment to transform into gel [34]. Studies revealed that the sol–gel method can yield the highest silica gel, up to 96%, from rice husk ash [13]. In studies elsewhere, it has been proven that the TSA can yield approximately more than 91% silica gel via the sol–gel method [35, 36] and followed by rice straw (90.56%) [21] and 84.60% [37].
A well-known cereal crop called teff (Eragrostis tef), is a specific food enjoyed in Ethiopia. Teff comes in 54 varieties worldwide, 14 of which are exclusive to Ethiopia. Teff may grow in a variety of conditions, even on poor soils [38]. Standard Agency of Ethiopia [39] has defined four main types of tef grain colors. These categories include extremely white (magna), white (nech), mixed (sergegna), and brown (key) teff [40]. After the teff grains have been removed, teff straw (TS) [38] is the leftover agricultural waste after harvest [7]. The TS is traditionally used for building dwellings in rural places by combining it with mud and feeding animals as fodder [41]. Usually, as an agro-residual byproduct, more than two million tons of TS are produced annually in Ethiopia. Recently, there have been several experiments underway for the commercial utilization of TS to produce biomethane [42], heavy metal removal and biochar production [43], reinforcement for polymeric composites, reinforced concrete, and epoxy resins [39]. However, in the present study, TS has been considered as primary feedstock since it regarded as a capable and affordable bio precursor for the production of silica gel.
In study elsewhere, have been investigated to prepare bio-based silica from sergegna (white and brown mixed) TS varieties via the sol–gel method [35, 36]. In the present study, an investigation has been carried out aiming to synthesis a silica gel with improvised characteristics from TS obtained from the filagot variety (accession code: Dz-Cr-442 RIL77C) using the sol–gel technique. This research would be a considerable approach in producing silica materials from TS because there are very few existences of published reports on exploiting TS, besides their high silica content. Up to now, no studies have been reported on the effect of various calcination time while preparing the TS ash which is the decisive raw material for silica gel preparation. In addition, the effect of calcination time during TSA production on the characteristics of silica gel was analyzed through BET, FT-IR, XRD, and SEM/EDX characterizations.
2. Materials and methods
2.1. Raw materials and pretreatment
A sample of TS was collected from the Debre Zeit Agricultural Research Center (DZARC), situated in Bishoftu, Ethiopia (filagot spp., accession code: Dz-Cr-442 RIL77C). The sample's contaminants, including sand, dirt, and soil particles, were removed using pure tap water. After being sun-dried for fifteen days, the sample was pulverized into smaller particle sizes with the aid of a grinder. The grounded TS particles were activated using a reflux condenser with HCl acid with a 2.5 N concentration for 1 h at 90 ± 5 °C. The acid-activated sample was additionally cooled to room temperature. Once the pH value reached 7, it was repeatedly cleaned with distilled water. An air-forced drying oven was used to dry the pretreatment sample for 12 h at 100 ± 5 °C. The biosilica samples, at 500, 700, and 900 °C with a 2 h calcination time, made from the ash of teff straw, have single-point BET surface areas of 52, 61, and 81 m2 g−1, respectively. As more carbon residue breaks down at high temperatures, the surface area of biosilica rises with an increase in ash temperature from 500 to 900 °C. As a result, the maximum surface area is reached after two hours at 900 °C. This increased the number of holes on the surface of the biosilica, increasing its surface area [36]. 'According to the study by E Rafiee, S Shahebrahimi [44]', for 2 h at higher combustion temperatures of 1,000 °C, silica crystallization increased. The section of the pores that were damaged throughout the procedure also caused the specific surface area to decrease as the temperature increased. A programmed muffle furnace (Model: FE-37-FA-013) was used to calcinate a dried sample of TS at various calcination times (2, 3, 4, and 5 h) at 900 °C with a 10 °C min−1 heating rate. The obtained TSA samples were collected after calcination and to prevent absorbing moisture, left to cool in a desiccator.
2.2. Silica gel synthesis
By following the process, silica gel was produced from TSA using the sol–gel technique reported by S P Ramasamy, D Veeraswamy [21]. As a result, 10 g of TSA samples were combined with 80 ml of 2.5 M NaOH and heated on a hot plate for 1 h at 90 ± 5 °C. Additionally, it was continuously agitated to create a sodium silicate solution by dissolving the silica from the TSA. Filtration via Whatman No. 41 filter paper was used to purge the solutions of any remaining, undissolved ash particles. The obtained filtrate was cooled, titrated with 2.5 M HCl to a pH of 7.0, and continuously stirred on a hot plate at a temperature of 90 ± 5 °C for 1 h. In order to break down the silica in the ash and create the sodium silicate solution, the mixture was continually agitated (reaction can be seen in (equation (1)). The residual, undissolved ash particles were filtered out of the mixture using filter paper (Whatman No. 41). Using reaction equation (2) as a guide, the resulting filtrate was chilled and titrated with HCl (2.5 M) until the pH reached 7.0 while being continuously stirred. As a result, silica particles may have formed [45, 46]. Then, it was fostered for 20 h to encourage gel development. After ageing, the gel was cleaned using Whatman No. 1 filter paper, 110 mm, and boiled double-distilled water. After draining the supernatant, the aqua gels were dried for 15 h at 90 °C in a hot air oven in order to create silica gel. The acquired materials were stored for later analysis in cool, sealed plastic bags, dry environment. The conceptual process for silica gel synthesis using the sol–gel method is shown in figure 1.


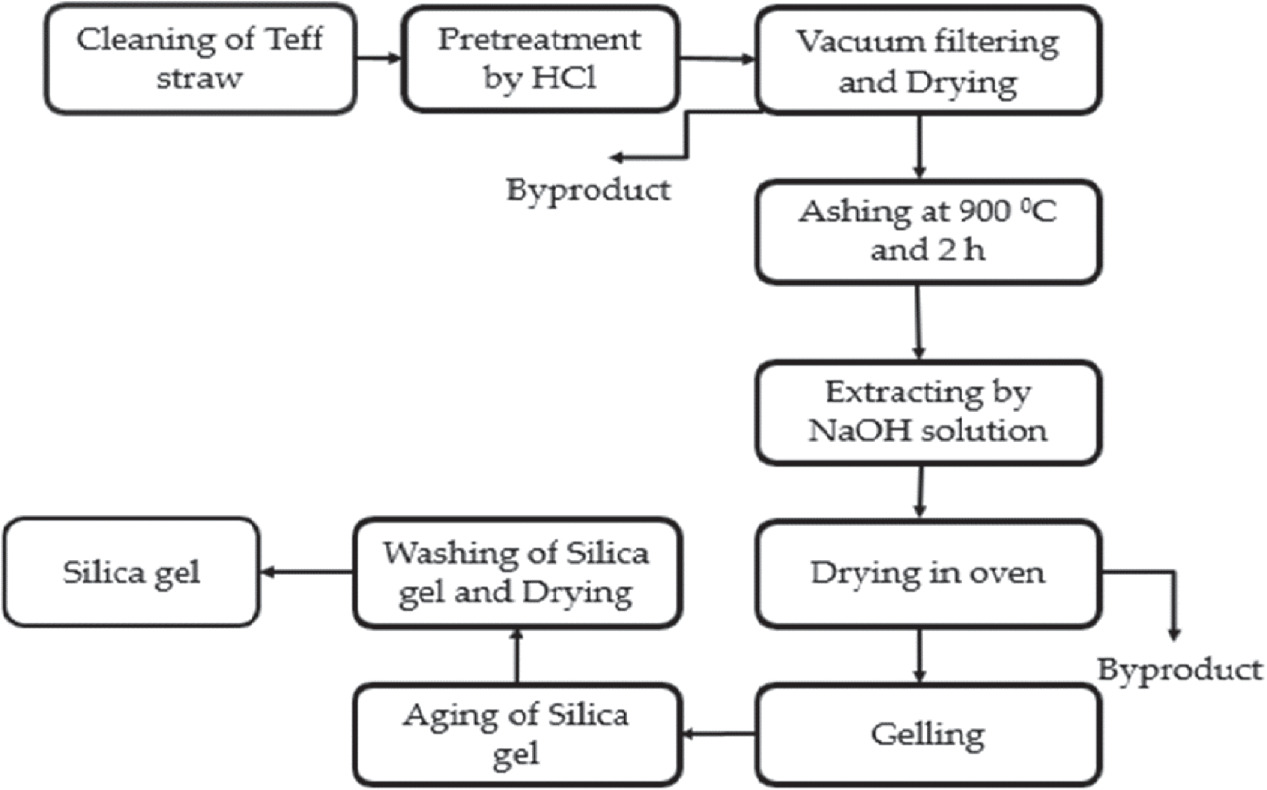
Figure 1. The conceptual flow for the production of silica gel using the sol–gel method from TSA.
Download figure:
Standard image High-resolution image2.3. Material characterization
The TSA samples' surface area was calculated using the Brunauer–Emmett–Teller formula (SA-9600 series, HORIBA, USA). Non-Local Density Functional Theory (NLDFT) techniques of the (Nova 4000e, Quantachrome, USA) analyzer were used to measure the specific surface area, pore volume, and pore diameter using BET and Barrett-Jyner-Halenda (BJH) methods. The sample was degassed for 8 h at 300 °C in a vacuum after making sure all moisture and impurities had been removed. By infusing nitrogen at 77.35 K while adjusting the relative pressure (P/Po) from 0.057 to 0.305, the Langmuir adsorption isotherm mechanism was taken into consideration. The BJH pore diameter was calculated using the equation (3).

where SBET is the BET surface area, Vp is the pore volume, and dp is the pore diameter.
To record the spectrum data for TSA, FT-IR spectroscopy (Thermo Scientific FTIR, IS50, USA) was used., which produced silica gels. The scanning range was from 3 to 800 at 2 for a speed of 10.0 degree min−1 using an XRD (RIGAKU-Model: Ultima-IV, USA) with a CuK emission of acceleration voltage of 40 kV and current of 44 mA. A scanning electron microscope (JEOL-Model: JSM-6390, USA) and an EDX at Secondary Electron Image with the same model and a range of 0–15 accelerating voltage were used to analyze the silica gel's surface morphology.
3. Results and discussion
3.1. Brunauer–Emmett–Teller surface area
Adsorption is the process by which gas molecules attach to any solid surface. In this way, the exposed active surface area, gas pressure, temperature, and level of solid-gas interaction can all affect how much gas is adsorbed. Due to its great purity and strong interactions with all materials, N2 gas is often used to assess BET surface area . In the current work, the specific surface area was measured using the BET technique in the relative pressure range (P/Po) of 0.05 to 0.25. In this case, Po stands for the starting pressure, whereas P stands for the system pressure. The nitrogen adsorption isotherm was utilized to determine the silica nanoparticle's pore volume using a pore size analyzer, which measures the porus size distribution at a relative pressure (P/Po) of 0.3 [47].
Based on the observations, a straightforward comparison of the pore volume, surface area, and pore diameter of silica gel has been shown in table 1. The silica gel obtained from TSA has a BET surface area that is comparable to earlier findings, particularly bamboo leaf ash, which has a surface area of 667.95 m2 g−1 [49], rice husk ash of 653 m2 g−1 [1] and rice husk silica gel of 783 m2 g−1 [50]. As shown in table 1, the TS silica gel was found to have a larger surface area than the acid-leached TSA. The outcomes show that the silica gel's surface area and pore volume are considerably impacted by the acid leaching products. It is clear that the increase in surface area is mostly due to the effect of acid hydrolysis on cellulose and hemicellulose to transform larger molecules into smaller ones that can be broken down more easily during calcination. As a result, increasing pore volume allows for the achievement and confirmation of high porosity. In the current investigation, acid-leached TS silica gel was shown to have an average pore width of 1.647 nm, which was much smaller than that of other silica materials made from various biomass materials. As a result, mesoporous silica gel was discovered to have been acquired from acid-treated TSA. As shown in table 1, it is also evident that activation with HCl solution greatly increased the pore volume and surface area of the silica gel, which may have led to a reduction in pore diameter [51].
Table 1. Ash, silica, and silica gel with a specific surface area obtained from different biomass.
| Biomass sources | Temperature (°C) | Surface area (m2 g) | Total Pore volume (cm3/g) | Pore diameter [48] | References |
|---|---|---|---|---|---|
| 900 @2 h | 30.144 | — | — | Present work | |
| 900 @3 h | 30.993 | — | — | ||
| 900 @4 h | 26.330 | — | — | ||
| 900 @5 h | 10.578 | — | — | ||
| (Filagot variety) silica gel | 900 @2 h | 632.356 | 0.2584 | 1.6345 | |
| 900 @3 h | 739.242 | 0.3098 | 1.6763 | ||
| 900 @4 h | 630.732 | 0.2562 | 1.62478 | ||
| 900 @5 h | 685.103 | 0.2830 | 1.6523 | ||
| Teff straw | 500 @2 h | 52 | — | — | [36] |
| 700 @2 h. | 61 | — | — | ||
| 900 @2 h | 81 | — | — | ||
| Rice husk | 500 @2 h | 47.82 | [44] | ||
| 700 @2 h | 58.72 | ||||
| 56.21 | |||||
| 1000 @2 h | |||||
| Teff straw silica gel | 750 @2 h | 305 | — | — | [35] |
| Bamboo leave ash | 600@4.5 h | 667.95 | 58.4 | 99.97 | [49] |
| Rice husk ash | 700@4 h | 653 | 0.64647 | 1.98 | [1] |
| Rice husk silica gel | 450@5 h | 783 | 0.51 | 3.4 | [50] |
| Sugarcane leaves ash | 500@ 4.5 h | 323 | 0.41 | 5.0 | [22] |
| Maize leaves ash | 182 | 0.34 | 7.0 |
3.2. Analysis of fourier transform infrared spectroscopy
For the purpose of identifying the functional groups present in the sample, Fourier Transform Infrared (FTIR) spectroscopy was executed. The predetermined amount of TSA sample suspension was applied on a copper grid in the current study, and the grid was subsequently darkened to allow ethanol to evaporation. At room temperature, the FTIR spectra of the TSA sample was analyzed between 400 and 4000 cm−1. Figure 2 displays the FT-IR data from the TSA samples that were calculated across calcination times (2, 3, 4, and 5 h). As a result, a band at 436 cm−1 was discovered due to bending vibrations, which was consistent with the current work, and a band at 796 cm−1 was seen due to Si–O–Si bond stretching. The Si–O–Si link's asymmetric vibration was the cause of a strong signal at 1060 cm−1. The band between 3000 and 3500 cm−1 was verified to be caused by the silanol group (Si–OH bonding). At 1600 cm−1, a bending vibration caused by H-O-H was seen. The absence of a peak between 1700 and 2800 cm−1 demonstrated that silica was the only organic compound that was produced [24, 45]. It implied that there was no NaCl present as well. It confirmed that the all alkali, alkaline earth metals, and other pollutants were successfully removed during HCl washing operations.
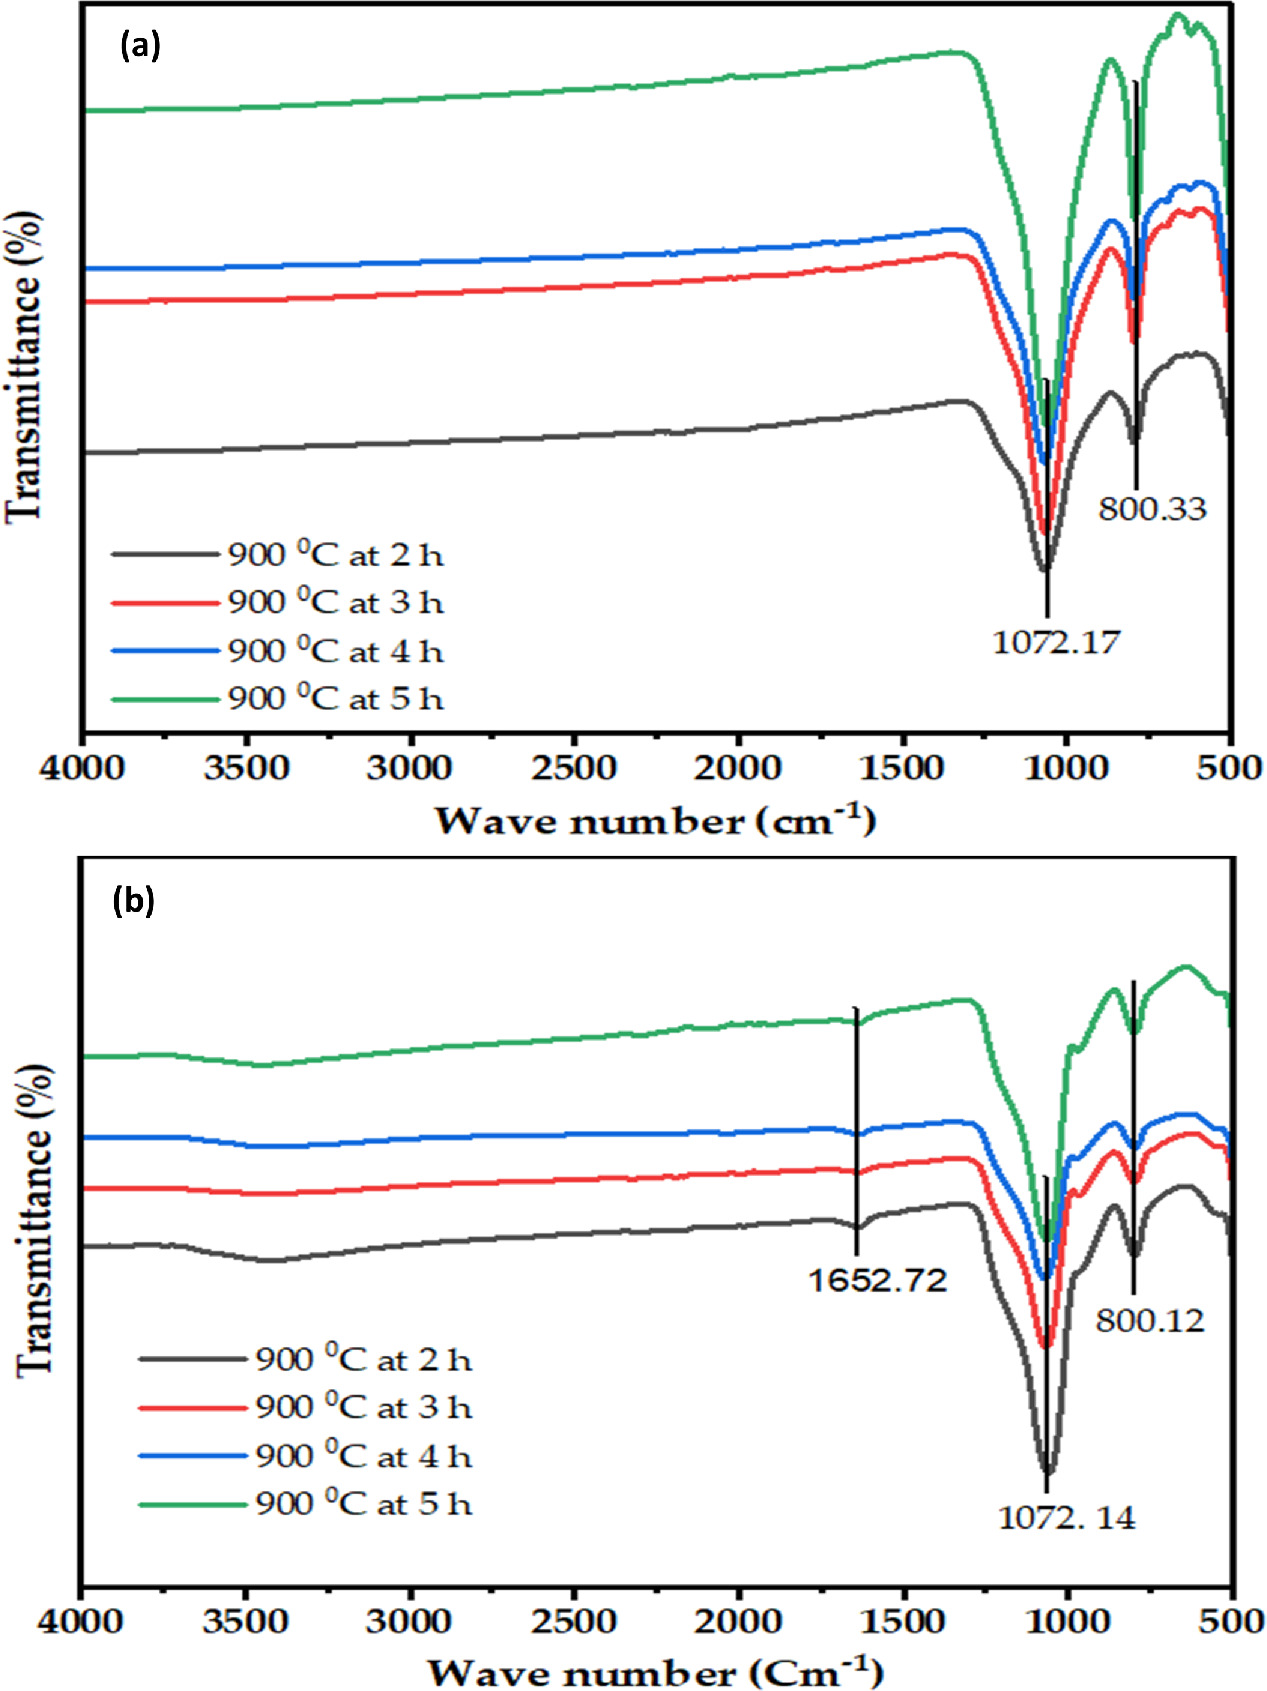
Figure 2. FTIR spectra of (a) TSA and (b) silica gel at different calcination time.
Download figure:
Standard image High-resolution imageThe characteristics of the FT-IR absorption band at 1633 and 1645 cm−1 wave numbers were brought about by the vibration of the O–H bond found in Si-OH silanol groups. The wave numbers 3338 and 3475 cm−1 were caused by the O–H bond stretching vibration from the Si–OH silanol groups and the adsorbed water molecules on the SiO2 surface. The broadband was caused by O–H bond bending vibration at wave numbers of 1633 and 1645 cm−1 [7, 52]. A strong and noticeable absorption peak can be found at wave number 1072 cm−1, which was brought on by the asymmetric stretching of the Si–O–Si (siloxane) bonding. At 795–800 cm−1, the Si–O bending vibrations produced a strong peak. Si-O vibrations that were bent out of plane had a peak at 445–488 cm−1 [24].
3.3. X-ray diffraction
The resulting silica's amorphous nature was confirmed by the wide XRD array at approximately 22.5°, which was characteristically amorphous solid [7]. CuK was operated at 40 kV, 44 mA, and 2θ between 5 and 800 in the current investigation to acquire XRD patterns. Figure 3(a) presents XRD patterns of ashes obtained from TS. In this study, the sharp peak position was around 22.1° and 26.6° centered for the sample calcined at 900 °C [45]. Quartz and tridymite (SiO2) were discovered in the TS at 21.1° and 26.6°, respectively, based on the XRD patterns. Because quartz is a crystalline form of silicon, the ash had a higher crystallinity. The TSA samples, which were proven to be crystalline, showed a strong sharpening band in the current research effort [21, 45].
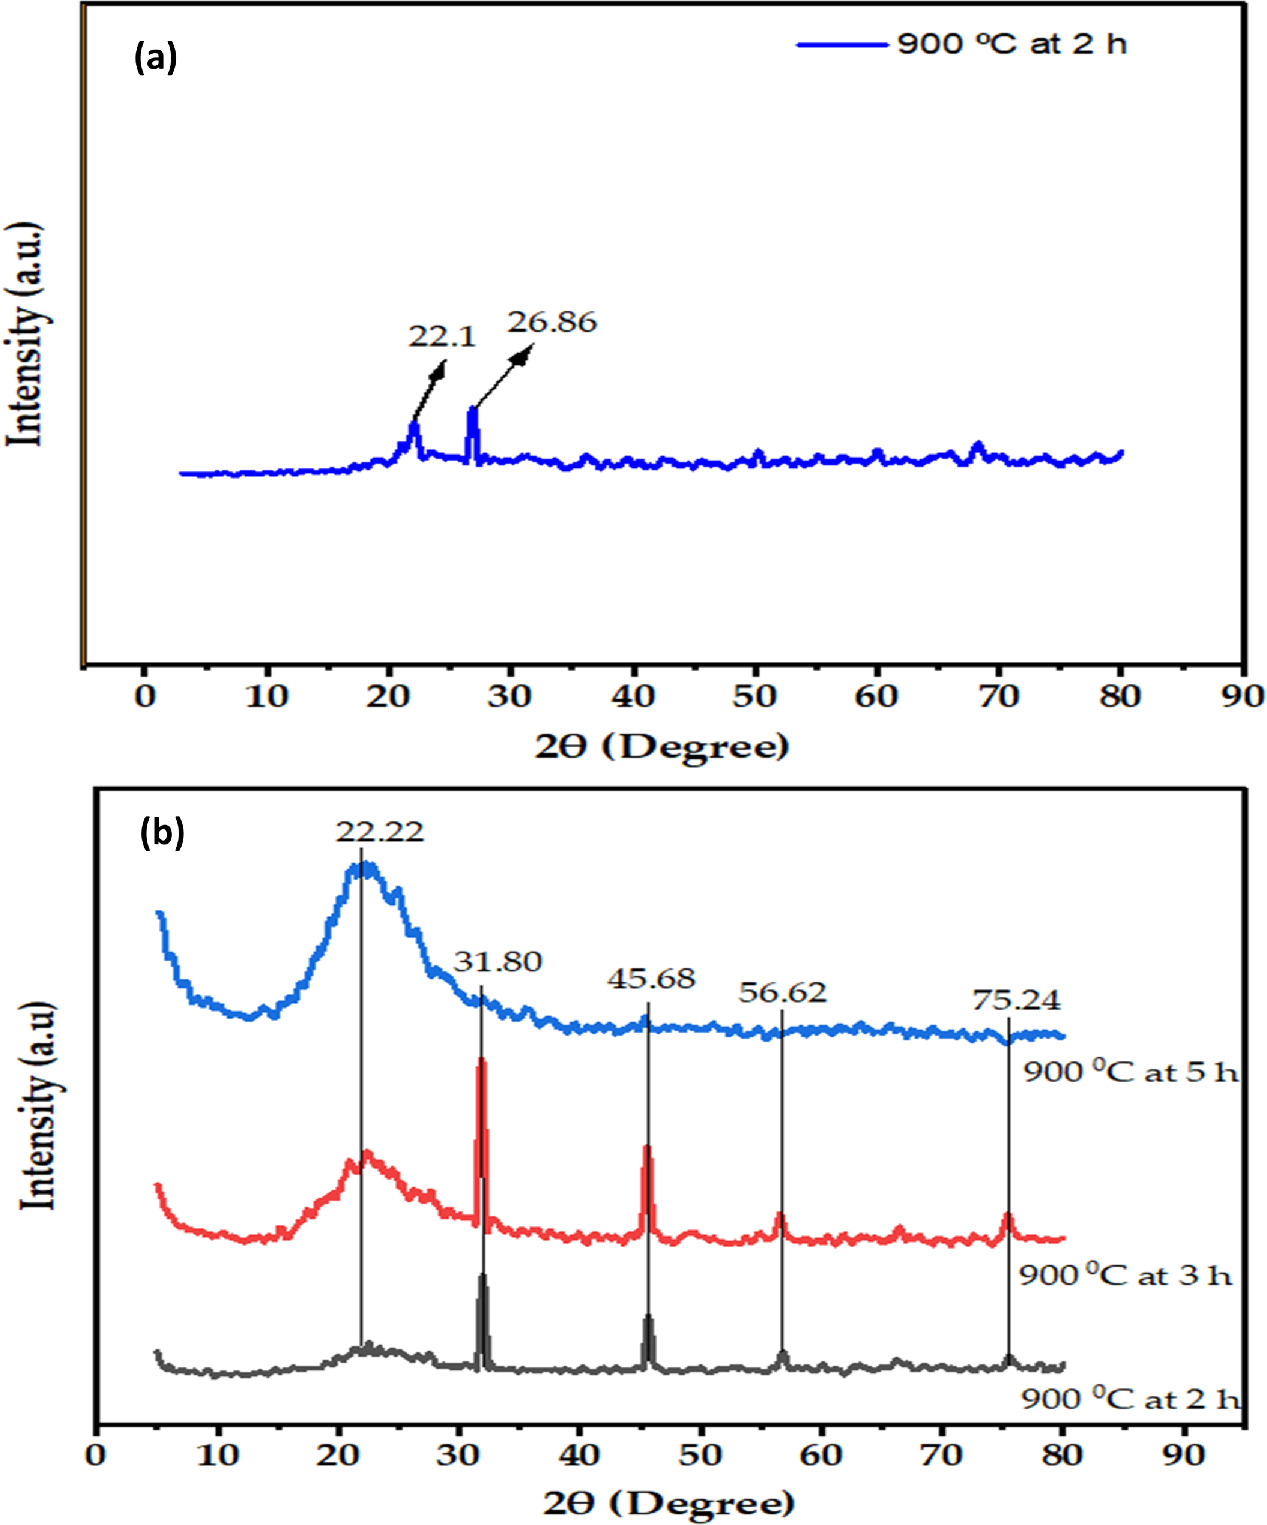
Figure 3. XRD results of (a) TSA and (b) silica gel samples at various calcination tim.
Download figure:
Standard image High-resolution imageThe XRD patterns of several silica gel samples obtained from TSA produced at varying calcination times are shown in figure 3(b). As seen in the picture, the extracted silica gel's XRD pattern at 2θ = 22.22° showed a robust and broad pattern, confirming its amorphous nature. These characteristics made them ideal for adsorption, catalysis, and other chemical processes. Sodium chloride, which was created during the precipitation of silica gel from hydrochloric acid, may be the cause of the small, abrupt, and powerful peaks at 2θ = 31.8°, 45.68°, 56.62°, and 75.24° that were seen in the silica gel at 900 °C [1, 36, 45]. The XRD pattern evident from the sol–gel procedure may eliminate practically all other ingredients and change the crystallin silica to amorphous silica gel. 'According to K Wahyuningsih and S Yuliani [53]', the silica produced from rice husks using extraction methods had XRD patterns with broad peaks at 2θ = 15°–30°, demonstrating the amorphous nature of the produced silica particles. For examine the structural properties of amorphous silica gel, which was prepared using sol–gel techniques by XRD analysis at a calcination time of 2, 3, and 5 h at a calcination temperature of 900 °C.
3.4. Yield of silica gel
Equation (4) was used to calculate the silica gel yield for the effect of calcination time at a constant temperature. In this investigation, 10 grams of TSA were used to determine the synthesis of silica gel. The yield of silica gel recovered from the calcined biomass was calculated using equation (4) [35, 46].

where,  is the mass of
  and
and  is mass of silica gel obtained.
By calculating the silica gel production using the previously mentioned equation (4), it is possible to determine the potential of TSA due to the synthesis of silica gel and the effects of the calcination time at a constant calcination temperature. The silica gel yield, which ranges from 78.1 to 90.0%, is shown in figure 4. When compared to earlier research reported using TS gathered from local farmers, the new precursors collected from DZRC have demonstrated a higher silica gel synthesis. Table 2 presents the silica content in various biomass in terms of mass percent. The percentages ranged from 49.5 to 84.5 [36] and 59.38 to 85.85% [35]. The maximum documented silica gel production for other feedstocks, including palm shell, was lower than the present precursor with the best silica gel yield 92% [54], corn cob 47% [19], bamboo Leaf 79.38% [49], sugarcane leaf 80.50% [55], wheat straw (7.00% [21], and rice straw 76.70% [56]. The highest yield from the TS was, however, only slightly higher than that of sugarcane bagasse and rice husk, both of which have yields greater than 95% [57] and 96% [13, 46], respectively. This demonstrates that one of the potential precursors for producing silica gel can be the TS. In this investigation, the average silica gel yield was reported for each calcination time that was performed in triplicate, and the values were 87.3, 78.1, 90.0, and 79.7% for calcination times ranging from 2, 3, 4, and 5 h at 900 °C, respectively. It is clear from the findings that TS has the potential to be a viable and promising bio-precursor for silica gel.
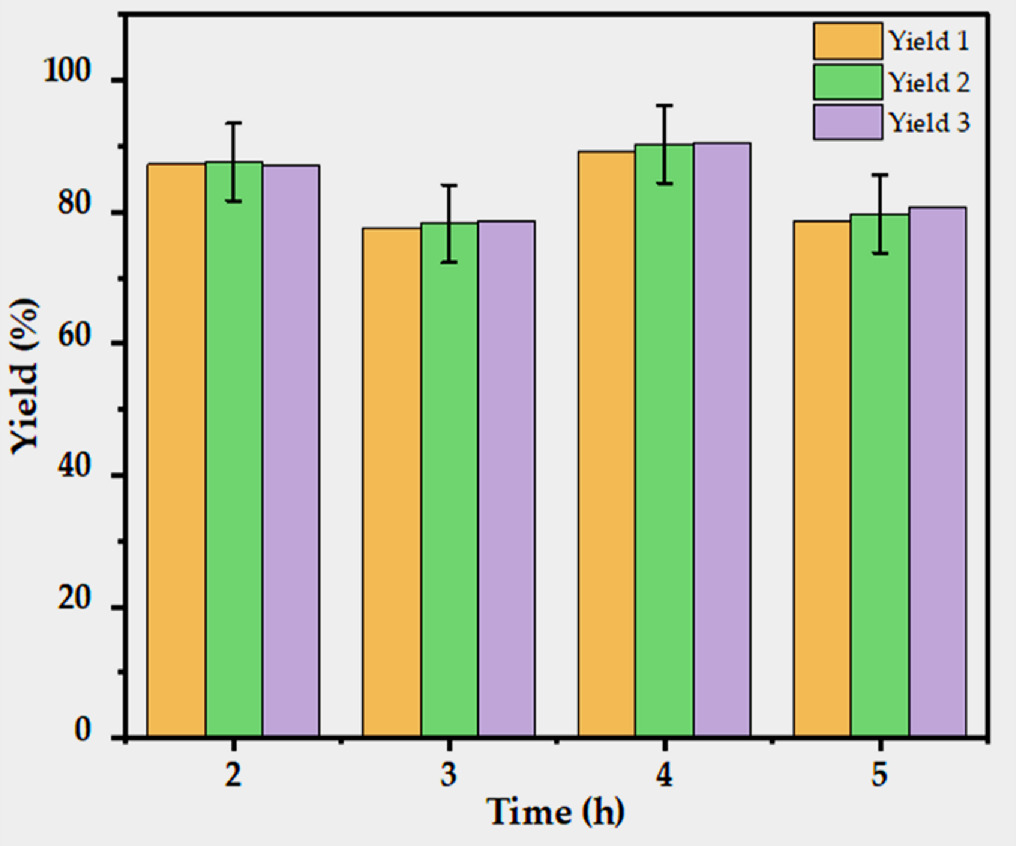
Figure 4. Influence of calcination time on the yield of silica gel at constant temperature.
Download figure:
Standard image High-resolution image3.5. Scanning electron microscopy
The SEM images with different magnifications showed the physical morphology of the silica gel's surface [figures 5(a) and (b)]. The figure revealed that the silica gel had a rough and sticky surface due to the presence of clusters of silica particles, each with a diameter of 5 μm. The surface also exhibited variations in size, smoothness, and color, with some regions being larger, smoother, and darker than others. These characteristics were affected by the alkaline treatment and the manual grinding of the silica gel. The alkaline treatment induced the formation of particle aggregates, while the grinding led to an uneven distribution. One of the recent advances in the field of biomass utilization is the production of amorphous silica from wheat straw, which has various potential applications in industry and agriculture. As stated by S P Ramasamy, D Veeraswamy [21] presents a comprehensive study on the method development and characterization of amorphous silica obtained from wheat straw by hydrothermal treatment. They use SEM to analyze the morphology, size, and distribution of the silica particles, as well as to investigate the effect of different parameters such as temperature, time, and acid concentration on the yield and quality of the silica. They also compare the properties of the silica derived from wheat straw with those of commercial silica and other sources of biomass-derived silica. Their results show that wheat straw is a capable raw material for producing high-purity amorphous silica with a spherical shape and a narrow size range, which can be tailored by adjusting the hydrothermal conditions [21].

Figure 5. SEM analysis of silica gel at calcination time of (a) 2 and (b) 5 h at 900 °C.
Download figure:
Standard image High-resolution imageThe SEM images of the biosilica gel samples calcined at different calcination time and constant calcination temperatures are shown in figures 5(a) and (b). It can be observed that the silica gel samples exhibited more porosity and cavities when they were calcined for 2 and 5 h at 900 °C. This indicates that the organic matter in the teff straw was decomposed and removed during the calcination process, leaving behind a porous structure of silica. The biosilica gel samples remained amorphous in the calcination time range of 2 to 5 h, as confirmed by the SEM analysis, which is consistent with the XRD results shown in figure 3 [58].
3.6. Analysis using energy dispersive x-rays
The silica gel samples produced from TS were examined using energy dispersive x-rays (EDX). The spectra obtained are shown in figure 6. From the results, it was discovered that the TS biomass burnt fully at 900 °C with calcined times of 2, 3, 4, and 5 h because high-temperature calcination produced ash particles with unique aggregation and agglomeration. It was discovered that the samples contained oxygen, silica, sodium, and chlorine. However, traces of the copper, rubidium, tantalum, hafnium, and titanium in the mineral were also present in the silica gels. The elemental composition from the EDS investigation was examined, and the results are displayed in table 3. There were just two distinct, strong Si and O peaks, and silica has been identified as the primary component. This is followed by 80.57, 72.59, and 56.91%, which together account for approximately 99.77% of the entire element. calcination temperature of 900 °C continuously for 2, 4, and 5 h, respectively, as shown in table 1, and the associated extra pollutants were very minimal. Na and other metals were added to the acid-leached TS after the resultant biosilica gel was confirmed to be 99.77% pure. It proved that the used HCl leaching phase removed the other metals well. During the pretreatment stage, the metallic oxides of TS react with HCl to create soluble chloride salts that were leached by the acid [45]. The results were supported by A B Bageru and V Srivastava [41] who worked with TS stated that the TS had been burned at 900 °C while being treated with HCl, generating biosilica samples with corresponding efficiencies of 91.82%. 'According to S P Ramasamy, D Veeraswamy [21]', In addition, the EDX spectrum revealed a higher silica concentration of 70.1% and a low potassium level of 9.96%.

Figure 6. EDX analysis of silica gel at calcination time of (a) 2 and (b) 5 h at 900 °C.
Download figure:
Standard image High-resolution image
Table 3. EDX analysis yields of silica gel synthesis at different time.
| Time (h) | Elements (wt%) | |||||||||
|---|---|---|---|---|---|---|---|---|---|---|
| O | Si | Na | Cl | Ti | Cu | Ru | Hf | Ta | Others | |
| 2 | 56.74 | 23.83 | 12.68 | 7.25 | — | 0.26 | — | — | 0 | |
| 3 | 69.58 | 30.19 | — | 0.34 | — | 0 | — | — | — | 0 |
| 4 | 54.51 | 18.08 | 9.54 | 6.53 | 0.11 | — | 10.83 | 0.50 | — | 0 |
| 5 | 48.85 | 8.06 | 2.90 | 2.00 | — | — | 2.80 | — | 35.40 | 0 |
The SEM-EDS spectrum revealed the presence of some imperfections in the precipitated silica gel, such as small cracks and pores presented in table 3. The analysis also showed that the precipitated silica gel had a low level of contamination from other elements, such as Cl, Ti, Cu, and Na, which could affect its properties and applications. The teff straw, which was used as the raw material for the synthesis of the precipitated silica gel, contained some elements that were not detected in the final product, such as K and Al. These elements might have been removed during the extraction and purification processes [59, 60]. A previous study by P S Utama, R Yamsaengsung [61] investigated the fly ash generated from the palm oil mill and the precipitation process that occurred. They hypothesized that CO2 would react with the silica extract and form a carbonate compound containing the carbon element in the carbonate form. They confirmed the presence of these components in the silica precipitate using various analytical methods [61].
4. Conclusions
The current study focused with the objective to utilize teff straw (TS) as a precursor to produce silica gel using the sol–gel method. From the results, sol–gel method was successfully used to produce amorphous silica gel from teff straw ash. The obtained yields were 87.3, 78.1, 90.0, and 79.7% for the calcination times of 2, 3, 4, and 5 h at 900 °C, respectively. FT-IR data was used to identify the chemical groups present in the TSA (Si–O–Si and Si-O) and TS (Si–O–Si, Si–OH, Si–CH, and Si–O). According to the results of the XRD research, silica was present in both the TSA and the silica gel. SEM micrographs showed pores in the silica particles. TSA had surface areas of 30.144, 30.993, 26.330, and 10.578 m2 g−1 at 2, 3, 4, and 5 h, respectively. For the calcination times listed above, the surface areas were found to be 632.356, 739.242, 630.732, and 685.103 m2 g−1; the pore volumes were 0.2584, 0.3098, 0.2562, and 0.2830 cm3 g−1; and the TS silica gel's pore size was 1.6345, 1.6763, 1.62478, and 1.6523 nm, respectively. It was found that the best results were obtained with a calcination duration of 3 h at a temperature of 700 °C, a surface area of 739.242 m2 g−1, a pore volume of 0.3098 cm3 g−1, and a pore size of 1.6763 nm. SiO2 was found in the samples and was confirmed to be the main, 99.77% pure constituent. The results of this investigation can improve the understanding of how to expoloit of agricultural waste, teff straw to minimize the environmental damage. It enables the profitable production of silica gel, which can be utilised to make a range of innovative materials for high-tech applications.
Acknowledgments
The Addis Ababa Science and Technology University internal research grant (IG 03/2022) provided funding for this project.
Data availability statement
All original data were produced by experimental reseach. The data that support the findings of this study are available upon reasonable request from the authors.