
Abstract
Lead-free (K0.48Na0.48Li0.04)(Nb0.95Sb0.05)O3 (KNLNS) ceramics have been successfully optimized for the calcination and two-step sintering temperatures. The experimental results reveal that the KNLNS powder calcined at 850 or 900 °C presented a pure perovskite phase with an orthorhombic phase. The particle size was in the range of 0.1–0.4 μm. The two-step sintering temperature (range: 950 to 1100 °C) significantly affects the structure, microstructure, and electrical properties of KNLNS ceramics. The presence of a pure perovskite phase with good crystallization is observed in all samples. The microstructure was researched by varying the two-step sintering temperature to obtain a dense microstructure and a clear grain boundary in order to optimize their piezoelectric properties. The best electrical properties of KNLNS ceramics were recorded at the optimized temperature of 1050 °C (density (ρ): 4,35 g cm−3; electromechanical coupling factor (kp): 0.33, kt: 0.35; dielectric constant (εr): 849; dielectric loss (tanδ): 0.073; maximum dielectric constant (εmax at TC): 6659; piezoelectric constant (d33): 195 pC N−1; remanent polarization (Pr): 16.1 μC cm−2; energy storage density (Wrec): 0.36 J cm−3; energy storage efficiency (η): 48.1%; t2 = 4 h), proving the efficacy of the two-step sintering technique.
Export citation and abstract BibTeX RIS

Original content from this work may be used under the terms of the Creative Commons Attribution 4.0 licence. Any further distribution of this work must maintain attribution to the author(s) and the title of the work, journal citation and DOI.
1. Introduction
Pb(Zr, Ti)O3 (PZT)-based ceramics have been extensively researched in the past decades and used to fabricate many devices such as sensor probes and ultrasonic transducers. These materials exhibit good ferroelectric and piezoelectric properties [1]. However, Pb-based materials can cause environmental pollution as PbO is highly toxic and accounts for a large proportion of the initial mixture (60% of PbO) [1, 2]. Therefore, lead-free ceramic systems with good ferroelectric and piezoelectric properties must be developed to replace lead-based ceramic systems. (Nax K1−x )NbO3 (KNN) [3], Bi0.5(Na0.8K0.2)0.5TiO3 (BNKT) [4], BaTiO3, and Ba(Zr0.2Ti0.8)O3—(Ba0.7Ca0.3)TiO3 are some of the recently studied lead-free ceramic systems [5]. It has been previously reported [6, 7] that (Na1/2K1/2)NbO3 prepared following the solid phase reaction method exhibits good piezoelectric properties (d33 = 80 pC N−1, kp = 36%–40%, Qm = 130, and εr = 290). Tu et al [8] reported that K0.41Na0.59NbO3 was characterized by the best physical properties (εr = 470, kp = 0, 32, kt = 0, 5, d33 = 120 pC N−1, Pr = 11, 6 μC cm−2). KNN-based ceramics are characterized by high Curie temperature (TC = 420 °C) and improved piezoelectric response, and these properties can be attributed to the polymorphic phase transition process. These materials outperform other lead-free piezoelectric ceramics [8].
Recently, a novel strategy has been developed to construct the rhombohedral– tetragonal phase boundary (R-T) by adding an ABO3-type component to the system to tailor TR-O (rhombohedral–orthorhombic transition temperature) and TO-T (orthorhombic–tetragonal transition temperature) to room temperature simultaneously. The process helps establish the R-T phase boundary, improving the piezoelectric properties of the KNN-based materials [9]. We believe that the addition of Li+, and Sb5+ decreased the TO-T and increased the TR-O of (K0,5−x/2Na0,5−x/2Lix)(Nb1−ySby)O3. It was also observed that the O–T, R–O–T, and R–T phases coexisted at room temperature. Wu et al [10] reported that the (K0.5−x Lix )Na0.5(Nb1−y Sby )O3 ceramic sintered at 1095 °C exhibited good density and piezoelectric properties (ρ ∼ 4.57 g cm−3, d33 ∼ 150 pC N−1, and kp ∼ 0.39) with x = 0.04, and y = 0.05.
It is well-known about KNN-based ceramic materials that the two-stage sintering method has been successfully used to improve the microstructure at the low sintering temperature reducing the volatilization of alkali metals to obtain high densification leading to their improved electric and piezoelectric properties, moreover, this process does not require any extra equipment. Ji et al [11] suggested that the two-step sintering process can effectively eliminate porosity and prevent the evaporation of volatile components, such as Na, K, and Li compared with those the conventional sintering process. Wu et al [12] used this method to fabricate 0.96(K0.4Na0.6)(Nb0.96Sb0.04)O3–0.04Bi0.5K0.5Zr0.9Sn0.1O3 ceramics. Two experimental parameters, namely, temperature (T) and time (t) (T1 = 1120 °C, t1 = 5 min, T2 = 700 °C, t2 = 3 h), were varied to conduct the experiments, and a significant improvement in piezoelectric properties (d33 ∼ 350–400 pC N−1) of ceramics could be achieved. According to the research results of Gio et al [3], the optimum piezoelectric and ferroelectric properties of the KNLNS-BNKZ ceramics (d33 = 251 pC N−1, kp = 0.51, kt = 0.55, Pr = 16.77 μC cm−2) were obtained at T2 = 1060 °C and t2 = 5 h, proving the efficacy of two-step sintering technique. Pan et al [13] suggested that the two-step sintering process could be used to synthesize (K,Na)NbO3-based ceramics to lower the volatilization of alkali metals. In the present study, we focused on studying the effect of calcination and two-step sintering temperatures on the physical properties of (K0.48Na0.48Li0.04)(Nb0.95Sb0.05)O3 lead-free ceramics. We aimed to optimize the calcination and two-step sintering temperatures to improve the piezoelectric properties of the materials.
2. Experimental section
The two-step sintering process was used to produce lead-free (K0.48Na0.48Li0.04)(Nb0.95Sb0.05)O3– (KNLNS) ceramics. K2CO3, Na2CO3, Sb2O3, Li2CO3, and Nb2O5 (purity 99.5%) were used as the starting materials. K2CO3, Na2CO3, and Li2CO3 powders were dried in an oven at 200 °C for 2 h to reduce the influence of moisture. Following this, the powdered samples were weighed and milled in ethanol for 20 h. Subsequently, the sample was dried, pressed, and calcined at 850, 900, and 950 °C for 2 h. The powder was calcined at the optimum temperature and ball-milled for 20 h. Subsequently, the samples were compressed into disks (diameter: 12 mm; thickness: 1.5 mm) at a pressure of 1.5 T cm−2. Following this, the ceramic sample was sintered following a two-step sintering method as shown in scheme of figure insert 6. The samples were heated from 30 to 850 °C with a heating rate of 5 °C min−1. After maintaining 850 °C for 30 min, the sample is further raised to 1150 °C with a heating rate of 5 °C min−1 and maintained at 1150 °C for 5 min and then decreased down to a lower temperature (T2 = 950, 1000, 1050, and 1100 °C) with a heating rate of 20 °C min−1 and maintained at these temperatures for 4 h.
The crystal structure of powders and the sintered samples was investigated by x-ray diffractometer (D8 ADVANCE) by using Cu-Kα radiations of wavelength 1.54 Å. The morphology and microstructure of the samples were analyzed by scanning electron microscopy (SEM, Hitachi S 4800) operating at 15.0 kV with a working distance of ∼17.5 mm. The ceramic density was calculated using the Archimedes method, and the ferroelectric hysteresis loops were analyzed using the Sawyer–Tower method. The capacitance and dielectric loss of the ceramic samples were assessed (RLC HIOKI 3532) using an impedance analyzer. Finally, the samples were polarized at an electric field of 30 kV cm−1 for 20 min to investigate the piezoelectric properties. The piezoelectric parameters of ceramics were studied based on piezoelectric standards 1961 [14] and 1987 [15].
3. Results and discussion
3.1. Optimization of calcining temperature for KNLNS ceramics
We considered the differential thermal analysis (DTA) and thermogravimetric analysis (TGA) data recorded for the (K0.48Na0.48Li0.04)(Nb0.95Sb0.05)O3 powder to determine the calcination temperature (figure 1). The DTA curve presents the early-stage heat absorption peaks at 107.2 and 179 °C, and the weight losses at these temperatures are attributed to the simultaneous losses of H2O and CO2 [16]. The total mass in the sample is reduced by 2.05% under these conditions. Rubio-Marcos et al [17] suggested that the decomposition of AHCO3 to A2CO3, where A is Na+, K+, or Li+, occurs in the temperature range of 100 °C–180 °C. AHCO3 is formed when the ceramic powder is mixed in an ethanol environment. The second transition region appears at approximately 315.9 °C, and the weight loss in this region is attributed to the release of an intermediate reaction layer of (K, Na, Li)2(Nb, Sb)4O11 on the surface of Nb2O5 particles [16]. Approximately 3.33% of the weight is lost under these conditions. The endothermic peaks at 315.9 °C reflect the polymorphic transition of A2CO3 [17]. The major loss in weight occurred in a narrow temperature range spanning 415 °C–670 °C. The weight loss occurring in this region corresponded to the loss in CO2 [17]. In the final stage, Further development of the reaction at 803.6 °C leads to the formation of a stoichiometric (K0.48Na0.48Li0.04)(Nb0.95Sb0.05)O3 phase at the surface of the reaction layer. Approximately 2.53% of the weight is lost at this stage (figure 1). Rubio-Marcos et al [17] reported that the decomposition of carbonates was completed at temperatures above 700 °C. This indicates that the KNN-based ceramics present the perovskite phase at a temperature higher than 700 °C. However, for a large sample volume, a single-phase structure cannot be formed at a calcination temperature of 700 °C. Above 700 °C, the decomposition of Na2CO3, K2CO3, and Li2CO3 carbonates results in the formation of a lubricating liquid phase. The samples were mechanically mixed with K2CO3, Na2CO3, Sb2O3, Li2CO3, and Nb2O5 to form KNLNS at approximately 803.6 °C (figure 1). Based on the thermal stability of the (K0.48Na0.48Li0.04)(Nb0.95Sb0.05)O3 powder, calcination was conducted at 800, 850, and 900 °C to study the structures and phases of the materials.

Figure 1. TGA and DTA curves recorded for the powdered (K0.48Na0.48Li0.04)(Nb0.95Sb0.05)O3 samples.
Download figure:
Standard image High-resolution imageXRD patterns of calcined KNLNS powders were recorded at 800, 850, and 900 °C for 2 h (figure 2(a)). Analysis of figure 2(a) revealed that the crystal structure of the KNLNS powders calcined at 800 °C presented a cubic symmetry, and the results agreed well with the results reported by Verma et al [18]. The perovskite phase occupied a large volume, and the presence of a second phase (Na2Nb4O11) was observed. The second phase was formed in small amounts, and the peaks between 20 and 30 reflected the formation of this phase. Similar results were reported by Zhang et al [19]. The results reveal that the temperature is not high enough to drive the reaction and form a single-phase structure. When powdered KNLNS was calcined at 850 °C or 900 °C, a pure perovskite phase was formed (figure 2(a)). The calculated intensity ratio (I022/I200) for the (022)O/(200)O peaks in the 2θ range of 44°–48° were recorded to be 1.12 and 1.13 when the calcination temperatures were 850 or 900 °C, respectively (insert of figure 2(a)). The results confirmed the formation of the KNLNS materials presenting the single-phase orthorhombic crystal structure. Figure 2(b) presents the SEM images of the powdered KNLNS samples calcined at 850 °C. Analysis of figure 2(b) reveals that the grain size of the powder calcined at 850 °C is in the range of 0.1–0.4 μm, and the average grain distribution peak is approximately 0.18 μm (190 nm) (insert of figure 2(b)). Based on these experimental results, the temperature of 850 °C was chosen as the optimized calcination temperature for the KNLNS powder. These results agreed well with the results reported by Nandini et al [16]. However, for pure KNN ceramics, the calcination temperature can be as high as 1050 °C, as reported by Verma et al [18] for undoped KNN powder.

Figure 2. (a) XRD patterns recorded for KNLNS powders calcined at 800, 850, and 900 °C; (b) SEM images recorded for KNLNS powders calcined at 850 °C.
Download figure:
Standard image High-resolution image3.2. Optimization of sintering temperature for KNLNS ceramics
XRD patterns recorded for the KNLNS samples sintered at 950, 1000, 1050, and 1100 °C for 4 h were analyzed to study the effect of the two-step sintering temperature on the phase structure of the materials (figure 3(a)). The presence of a pure perovskite phase is observed in figure 3(a), and the origin of this phase was attributed to the good crystallization property of ceramics. A significant extent of peak splitting was observed for the ceramics sintered at 1050 and 1100 °C, indicating a high crystalline degree, as detailed in the structural changes investigated at 2θ = 44°–47°. The results were obtained based on data simulation based on the Lorentz fitting function (figure 3(b)). It was observed that the 2θ of KNLNS patterns shifted from the left to the right with an increase in the sintering temperature from 950 to 1100 °C. Gaur et al [20] reported that KNLNS ceramic samples sintered at different temperatures in a very narrow range from 1050 °C to 1090 °C, which no evident shifting in the peaks at 2θ = 44°–47°. Figure 3(b) also reveals that the orthorhombic phase (O-phase) of the samples is characterized by the (022)O and (200)O peaks and their intensity tends to increase with an increase in the sintering temperature (T2), similar to that described by [20]. It means that the crystallinity of the ceramic samples is better as the T2 increases. Good crystallinity and single-phase structure can be attributed to the fact that the radius of the Sb5+ (0.62 Å) ions were comparable to the radius of the Nb5+ (0.64 Å) ions in the B-site and the radius of Li+ (0.92 Å) was comparable to that of K+ (1.38 Å) and Na+ (1.32 Å) lead to diffused well into the KNN lattice to produce a homogeneous solid solution, consistent with the report of Gaur et al [20].

Figure 3. XRD patterns recorded for KNLNS ceramics at different two-step sintering temperatures.
Download figure:
Standard image High-resolution imageThe elements in the (K0.48Na0.48Li0.04)(Nb0.95Sb0.05)O3 ceramic materials were identified by analyzing the EDS spectra (figure 4(a)). Analysis of the EDS spectra revealed the presence of Na, K, Nb, Sb, and O in the ceramics sintered at 1050 °C. The results agreed well with the results reported by Wu et al [21]. The absence of Li was observed by analyzing the DES spectra, and the absence of this element was attributed to the low atomic mass of the material. Figure 4(a) reveals that Sb was introduced at positions B in the KNN ceramic presenting the ABO3 structure. The results revealed the formation of a homogeneous solid solution, and the results were consistent with the results obtained by studying the structure of the materials. The FTIR profiles recorded in the range of 400–3500 cm–1 for the (K0.48Na0.48Li0.04)(Nb0.95Sb0.05)O3 ceramic materials sintered at 1050 °C were analyzed to affirm the results (figure 4(b)).

Figure 4. EDS analysis (a) and FTIR spectral profiles (b) of KNLNS ceramics sintered at 1050 °C.
Download figure:
Standard image High-resolution imageThe FTIR profiles reveal the presence of characteristic peaks of both KNLNS materials. Absorption bands at 423, 685, 810, 927, 1058, 1203, 1332, 1630, 2325, 3414, and 3512 cm−1 were present in the profiles (figure 4). Analysis of the profiles reveals the presence of strong absorption peaks at approximately 423 and 3512 cm−1. These peaks corresponded to the O–H stretching bond. The presence of these peaks revealed the absorbance of water vapor. The band at 1203 cm−1 can be assigned to the asymmetrical stretching of the C–O group, and the group of bands at 810 and 927 cm−1 can be attributed to the out-of-plane deformation of the carbonate group. Similar results were reported by Supriya et al [22]. The bands appearing at 685, 1332, 1630, 2325, and 3414 cm–1 could be ascribed to the characteristic vibrations of B–O (where B is Nb+5 and Sb+5) [22] and A–O (where A is Na+, K+, or Li+) [22] that participated in the formation of a perovskite phase in KNLNS ceramics. According to Rubio-Marcos et al [17, 23], the FTIR profiles recorded for the (K0.44Na0.52Li0.04)(Nb0.86Ta0.10Sb0.04)O3 ceramics present absorption peaks localized at 1640, 880, and 630 cm−1. The presence of the octahedral BO6 groups is confirmed by the presence of peaks at 1386, 1627, 2391, and 3441 cm–1.
Figure 5 presents the microstructure of the (K0.48Na0.48Li0.04)(Nb0.95Sb0.05)O3 ceramics sintered at T2 = 950 °C–1100 °C for 4 h. The sintering temperature T2 strongly influenced the microstructure of the KNLNS ceramics. The average grain size of the ceramics increased with an increase in T2 and reached the maximum value of 0.94 μm at 1050 °C. A dense microstructure and a clear grain boundary were observed under these conditions. The density decreased beyond 1050 °C. The increase in the ceramic grain size can be explained by the fact that the addition of Li+ (4% mol) and Sb5+ (5% mol) to KNLNS ceramics in the presence of Li+ and Sb5+ can improve the migration rate of grain boundaries and accelerate the process of grain growth in KNN-based ceramics by forming a liquid phase. According to Jiang et al [24], the grain size of the K0.5Na0.5NbO3 ceramics increases from 3 to 10 μm when the one-step sintering temperature increases from 1060 to 1100 °C. This indicates that high sintering temperature effectively induces grain growth via the migration of grain boundaries. The diffusion rate increases under these conditions [25]. Interestingly, although the size of the ceramic grains increases with T2, the size of the ceramic particles is smaller than the size of the particles formed following traditional sintering methods. This is explained by the schematic diagram in figure 6. When the traditional sintering process (insert of figure 6) is used, the size of the ceramic grains increases sharply with an increase in the sintering temperature. Particle size larger than 5 μm was recorded when the sintering temperature was above 1150 °C. Similar results were reported by Jiang et al [24]. The temperature of the samples was raised to 1150 °C during the two-step sintering process, and this temperature was maintained for 5 min to form a Li-liquid phase that improves the diffusion rate. Following this, the temperature was rapidly reduced to 1050 °C, which was maintained for 4 h (insert of figure 6). The use of this technique helped decrease the grain size, and the completion of the microstructure was recorded. This limited the evaporation of alkaline elements, generating fewer lattice defects.

Figure 5. Microstructures of KNLNS ceramics recorded at different two-step sintering temperatures: (a) 950 °C, (b) 1000 °C, (c) 1050 °C, and (d) 1100 °C.
Download figure:
Standard image High-resolution image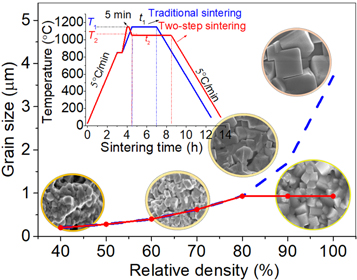
Figure 6. Schematic diagram of the process of increasing the grain size of ceramics using different sintering techniques.
Download figure:
Standard image High-resolution imageIt can be explained based on the model in the figure 6 that the first step of the two-step sintering process could be related to grain growth [26]. When the rapid cooling from a higher sintering temperature (T1 = 1150 °C) to a lower sintering temperature (T2 = 1050 °C) and holding for a suitable duration (t2 = 4 h), which may freeze the microstructure of the ceramics, which lead to Inhibition of ceramic particle size growth in the second step of sintering because the prohibition of grain boundary migration.
Figure 7(a) shows the density versus sintering temperature plots for the KNLNS ceramics. As the T2 increased, the density of the ceramics increased from 4.17 to 4.35 g cm−3, and the relative density increased in the range of 95.3%–98.1%. Similar results were reported by Jiang et al, who studied K0.5Na0.5NbO3 ceramics [24]. They reported that the density of the K0.5Na0.5NbO3 ceramic sintered at 1100 °C was 4.39 g cm−3 (relative density of 97.4%). The increase in density is closely related to the microstructure of the materials. A uniform distribution of grains and tight grain packing were observed at T2 = 1050 °C. This results in an increase in ceramic density (4.35 g cm−3; relative density: 97.8%). The closed–porosity was presumed to be approximately 3.2%. However, the ceramic density decreases when T2 = 1100 °C (figure 7(a)), and this can be attributed to the volatilization of alkali components during sintering. This causes a deviation from the original calculated component, and similar results were reported by Wang et al [27]. The increase in the relative density and the formation of grains of appropriate sizes can be attributed to the improvement in the electrical properties of the KNLNS ceramics. The details are reported in the following section.

Figure 7. (a) Ceramic density; (b) dielectric constant and the dielectric loss of KNLNS ceramics.
Download figure:
Standard image High-resolution imageThe trend in the change in the dielectric constant (εr ) of the ceramic samples at different temperatures is similar to the trend observed for the change in density (figure 7(b)). The value of εr increases with T2 and reaches the maximum value (εr = 849) at T2 = 1050 °C. However, when T2 > 1050 °C, the value of εr decreases. Conversely, when T2 increases, the value of the dielectric loss (tanδ) decreases, and the minimum value (tanδ = 0.073) is recorded at T2 = 1050 °C. Beyond this temperature, the value increases. The observations can be attributed to the high density, large grain size, and improved crystalline quality of the ceramics, as reported by Tho et al [6]. In addition, the replacement of K+ (1.38 Å) ions and Na+ (1.32 Å) ions occupying the A sites of the perovskite lattice by Li+ (0.92 Å) ions and Nb5+ (0.64 Å) ions occupying the B-site by Sb (0.62 Å) lead to good crystallization at low sintering temperatures, which contributes to improve the dielectric constant, and a decrease in the dielectric loss of the materials.
Figure 8(a) presents the ε(T) curves for the (K0.48Na0.48Li0.04)(Nb0.95Sb0.05)O3 ceramics generated in the range of 30 °C–420 °C at 1 kHz. The ε(T) curves generated for the ceramics present two clear peaks which correspond to TO−T (low temperature) and TC (higher temperature). Figure 8(b) reveals that T2 has a negligible influence on the TO-T and TC phase transition temperatures of the (K0.48Na0.48Li0.04)(Nb0.95Sb0.05)O3 ceramics. It shows that the value of TC was obtained in the range of 373 °C–381 °C. While, the TO-T of the ceramics ranges from 79 °C−115 °C, and it shifted to lower temperatures at optimum T2. This can be explained by the substitution of Li+ and Sb5+ ions into the A and B sites in the ABO3 structure of the KNN ceramic, respectively [20]. The maximum dielectric constant (εm) of the ceramics increases with T2, and the maximum value (εmax = 6659) was recorded at T2 = 1050 °C. Beyond this temperature, the value decreases. As discussed above, the ceramic sample corresponding to the T2 is 1050 °C, and the ceramic sample has a homogeneous microstructure, large grains, high density, and small grain boundaries of the ceramics. This result makes it easier to reverse ferroelastic domain walls leading to improved dielectric properties of ceramic samples [8].

Figure 8. Temperature-dependent dielectric constant and dielectric loss recorded for KNLNS ceramics at 1 kHz.
Download figure:
Standard image High-resolution imageThe electromechanical coupling coefficients (kp, kt), the piezoelectric coefficients (d33) and mechanical quality coefficient Qm of the (K0.48Na0.48Li0.04)(Nb0.95Sb0.05)O3 ceramics have been plotted in figures 9(a) and (b), respectively. The kp, kt, d33, and Qm values present similar behavior. Initially, the values tend to increase with an increase in T2, and the values decrease when T2 exceeds 1050 °C. The maximum values for kp (0.33), kt (0.35), d33 (195 pC N−1), and Qm (83) were recorded at T2 = 1050 °C. This result is consistent with the results obtained by studying the microstructure and ceramic density as well as good crystallization of the structure at the optimum sintering temperature. As reported by Tu et al [8], the large grain size, small grain boundaries and high density of KNLNS ceramic are favorable for getting enhanced piezoelectric properties. Wang et al [27] reported that the maximum density and the largest coefficient d33 value were recorded when the 0.92(Na0.535K0.48)NbO3 − 0.083LiNbO3 samples were sintered at 950 °C.
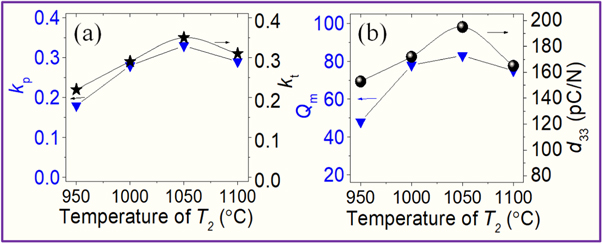
Figure 9. Changes in kp, kt, d33, and Qm of KNLNS ceramics as a function of T2.
Download figure:
Standard image High-resolution imageFurthermore, the increase in the Qm value can be attributed to the improvement in the dielectric loss and the microstructure of the ceramics. It is explained that the replacement of K+ (1.38 Å) ions and Na+ (1.32 Å) ions occupying the A sites of the perovskite lattice by Li+ (0.92 Å) ions and the Nb5+ (0.64 Å) ions occupying the B-site by Sb (0.62 Å) leading to good crystallization, which contributes to a decrease in the dielectric loss of the materials and the result is improved the mechanical quality coefficient [8].
The hysteresis loops were generated at RT and analyzed to confirm the effects of different T2 on the ferroelectric properties of KNLNS ceramics (figure 10(a)). Good saturated S–E hysteresis loops were obtained for the ceramics. Figure 10(b) presents the variations in the remnant polarization (Pr) and the coercive field (Ec) as a function of T2. The value of Pr increases with an increase in T2 and reaches the maximum value of 16.1 μC cm−2 at T2 = 1050 °C. The value decreases beyond this temperature. The sample sintered at T2 = 950 °C is characterized by the Ec value of 9.3 kV cm−1. The Ec values decrease with an increase in T2 and reach the smallest value of 5.9 kV cm−1 at T2 = 1100 °C. The improvement in the ferroelectric properties is attributed to the increase in the particle size results in the improvement in the orientation directions of the domains. In other words, the perfect microstructure, small grain boundaries, and high ceramic density ease the process of polarization rotation. This improves the polarization conditions of the KNLNS ceramics [28, 29]. Similar results have been previously reported [30–32]. The results agree with the studied dielectric and piezoelectric characteristics of the ceramics. The ferroelectric properties of the ceramics deteriorate due to the evaporation of volatile alkali metal oxides (Na+, K+) at T2 = 1100 °C [3].

Figure 10. (a) P-E ferroelectric hysteresis loops; (b) Calculated Pr and Ec values; (c) Schematic diagram of the process of ferroelectric energy storage; and (d) Calculated Wrec and η values of the ceramics.
Download figure:
Standard image High-resolution image
Based on the schematic diagram presented in figure 10(c), the energy storage density (Wrec, marked by the green area in figure 10(c); calculated by equation (1)) and the energy storage efficiency (η) were calculated using equation (2) as follows [3, 4]:


Figure 10(d) reveals that the trend in the changes in the energy storage density (Wrec) of the ceramics at different T2 is similar to the trend in the change in the energy storage efficiency (η). Wrec and η decreased, and the minimum values of 0.21 J cm−3 and 18.3%, respectively, were recorded at T2 = 1000 °C. However, when T2 exceeds 1000 °C, Wrec and η increase linearly with an increase in T2, and the maximum values of 0.36 J cm−3 and 48.1%, respectively, are recorded at T2 = 1100 °C. The energy storage properties of the KNLNS ceramics can be significantly improved while optimizing the two-step sintering temperature. Similar results have been previously reported [3]. The optimal sintering conditions for the KNLNS ceramics can be determined. The values of Wrec (200%) and η (51.8%) increased under optimized conditions. The results indicate that optimization of preheating and two-step sintering temperatures helps increase the relative density of the materials. The grain size of the materials affects the domain size and configuration of the materials, which are critical factors that affect the electrical properties of the KNLNS ceramics.
Table 1 lists the electrical parameters of the (K0.48Na0.48Li0.04)(Nb0.95Sb0.05)O3 ceramics and other reported materials such as (K0.48Na0.48Li0.04)(Nb0.96Sb0.04)O3 [20], [Na0.5K0.5]0.95(Li)0.05(Sb)0.05(Nb)0.95O3 (KNLNS) [33], (K0.41Na0.59)(Nb0.79Sb0.06Ta0.15)O3 (KNNST) [34], (K0.535Na0.485Li0.05)(Nb0.8Ta0.2)O3 (KNLNT) [35], [K0.5Na0.5]1 − x (Li)x (Sb)x (Nb)1 − x O3 (KNLSN) [33], and [(K0.5Na0.5)0.94Li0.06]0.97La0.01(Nb0.9Ta0.1)O3 (KNLLNT) [36]. Analysis of the electrical parameters Ts, kp, ρ, d33, Pr, TC, and εr reveals that the fabricated materials are promising candidates that can be used to develop piezoelectrics devices.
Table 1. Compilation of electrical properties of the ceramics and the other reported data.
| KNN based ceramics | Ts (°C) | kp | ρ (g/cm3) | d33 (pC/N) | Pr (μC/cm2) | TC(°C) | εr | References |
|---|---|---|---|---|---|---|---|---|
| KNLNS | 1050 | 0.33 | 4.35 | 195 | 10.7 | 376 | 849 | This work |
| KNLNS | 1080 | — | 4.27 | 150 | — | 326 | 381 | [20] |
| KNLNS | 1090 | 0.35 | 4.39 | — | 6.6 | 339 | 800 | [33] |
| KNLSN | 1080 | 0.42 | 4.3 | 273 | 7.3 | 330 | 700 | [33] |
| KNNST | 1090 | 0.47 | 4.67 | 170 | 12.6 | 315 | 1395 | [34] |
| KNNST | 1090 | 0.42 | 4.46 | 151 | 14.2 | 320 | 700 | [35] |
| KNLLNT | 1100 | 0.34 | 4.58 | 17 | — | 400 | 119 | [36] |
4. Conclusions
A two-step sintering technique was used to fabricate lead-free (K0.48Na0.48Li0.04)(Nb0.95Sb0.05)O3 ceramics at a low sintering temperature of 1050 °C. The experimental results reveal that the KNLNS samples calcined at 850 °C and sintered at 1050 °C present a pure perovskite phase with good degrees of crystallization. The best electrical properties of the (K0.48Na0.48Li0.04)(Nb0.95Sb0.05)O3 ceramics were recorded a the optimized temperature of 1050 °C. The density (ρ) was recorded to be 4,35 g cm−3, the kp value was 0.33, the kt value was 0.35, the εr value was 849, the εmax value was 6659, the tanδ value was 0.073, the d33 value was 195 pC N−1, and the Pr value was 16.1 μC cm−2. These proved the efficacy of the two-step sintering technique. The KNLNS ceramics are great candidates for the development of lead-free energy storage devices (Wrec = 0.36 J cm−3 and η = 48.1%). In short, the optimization of the preheating and two-step sintering temperature can help in increasing the relative density and effectively improved the electrical properties of the materials.
Acknowledgments
This research was funded by Ministry of Education and Training under grant number B2023-DHH-30. The authors would like to thank the cooperation project between the School of Engineering and Technology - Hue University and National Cheng Kung University.
Data availability statement
All data that support the findings of this study are included within the article (and any supplementary files).
Conflict of interest
The authors declare that they have no conflict of interest.
Contributions
All authors contributed to the study concept and design including doing experiments as well as discussing writing the manuscript. The manuscript was read and approved by all authors.