
Abstract
The present work investigates the microstructures, mechanical properties and deformation behaviors of the 316L stainless steel fabricated by selective laser melting (SLM). The initial dislocation density of as-SLM and conventional samples is measured using x-ray diffraction (XRD). It is found that the high dislocation density is obtained by SLM, contributing to the enhancement of yield strength. Twinning has occurred at the early stage of SLM deformation, which undergoes obvious grain rotation and twinning development during the tensile tests. However, only a few transformed martensite is presented in the deformed samples, and no significant grain orientation changes are observed.
Export citation and abstract BibTeX RIS

Original content from this work may be used under the terms of the Creative Commons Attribution 4.0 licence. Any further distribution of this work must maintain attribution to the author(s) and the title of the work, journal citation and DOI.
1. Introduction
Selective laser melting (SLM), as one of the important forming methods in additive manufacturing, has been developed relatively maturely [1–5]. The SLM process involves a high-energy laser beam to melt the metal powder pre-coated on the powder bed, and then the equipment controls the laser beam to perform selective melting according to the system data information under the protection of inert gas such as nitrogen or argon. Then the platform moves down where it is re-covered with powder and sintered, and the process is repeated to recycle until completed the whole component [3]. The SLM technology utilizes the high-energy-density laser beam to melt metal powder layer by layer for direct forming. It is an integrated manufacturing technology that combines precision and high requirements. Unlike conventional manufacturing technology, complex parts can be produced efficiently without geometric limitations [2]. Manufacturing small-batch components without tooling and expensive mechanical equipment can reduce costs, short manufacturing cycles and high material utilization rates [4, 6].
SLM forming is a high-energy transient metallurgical process in which material melting, solidification and cooling are accomplished in an extremely short period of time. The large temperature gradient results in local element segregation and heterogeneous columnar structure [2, 7, 8]. In the SLM systems, the laser beam is focused on a spot with a diameter range of 50–100 μm. Therefore, the interaction between laser and powder forms the micro melt pool with more complex local conditions, such as Benard-Marangoni instability in the melt pool and repeated heating and cooling cycles [9, 10]. Periodic expansion and contraction lead to formed sub-micron cellular structures inside the grains that are not obtained through conventional techniques. These substructures have some enriched chemical elements and a high density of dislocations in the cell walls. Numerous studies have confirmed, indeed, that for SLM parts, cell structures with chemical segregation and a high dislocation density contribute to strength improvement. [11, 12]. These cell walls have a strong dislocation trapping effect, and segregated solutes can also pin and hinder the movement of dislocations, causing strong heterogeneous hardening behavior [13, 14]. Therefore, the 316L stainless steel fabricated by SLM owns a better comprehensive performance [15, 16]. The products formed by the optimized process parameters are higher than conventional in strength, and their ductility also reaches or even exceeds that of rolled pieces and forgings [1, 2, 17].
The development of substructures and an increase in dislocation density are credited with the high strength of SLM 316L stainless steel. The dislocation network and elemental segregation accompanying the substructure give rise to the differences in mechanical properties. In fact, its tensile process has also experienced massive twinning deformation, which is obviously different from the conventional deformation mechanism. In this study, the microstructures and mechanical properties of 316L stainless steel fabricated by SLM are investigated and compared with conventional methods. The microstructure evolution during tensile deformation is analyzed, and the deformation behavior of SLM 316L stainless steel is elucidated in combination with work hardening.
2. Experimental
Gas-atomized 316L powder particles (15–53 μm) had a sphericity of 0.884, with a composition of Fe-0.01C-0.37Si-1.31Mn-16.3Cr-11.56Ni-2.47Mo-0.013P-0.006 S in wt.%. The powder distribution and morphology are shown in figure 1. A cube specimen (15 mm×15 mm×50 mm) was fabricated by the EOS M290 selective laser melting device equipped with a 400 W Yb-fiber laser, with 195 W laser power, 1080 mm s−1 scan speed, 0.09 mm hatch space, and 20 μm layer thickness. Used cross-hatching scanning strategy and rotated the scanning direction 67° after each layer was completed. The oxygen content during SLM was determined to be 256 ppm. The conventional 316L of cold rolling and heat treatment (CT) was used as the control sample.
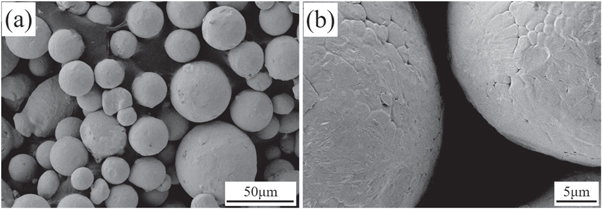
Figure 1. 316L stainless steel powder for SLM, (a) powder distribution and (b) particle surface morphology.
Download figure:
Standard image High-resolution imageMicrostructural characterization was carried out with a scanning electron microscope (SEM, QUANTAFEG450 field emission), an electron backscatter diffraction (EBSD, HSHR (TKD)) and a transmission electron microscope (TEM, JEM2100). The samples after grinding and polishing, they were electrolytically eroded with 10 wt.% oxalic acid solution at 15 V DC for 35 s to reveal the microstructure features under SEM. EBSD samples were electropolished with a mixed solution of 10% glycerol, 20% perchloric acid and 70% alcohol, applying 10 V DV for 50 s. The scan step was 0.15–1.8 μm according to the samples. In order to characterize the deep structure, TEM studies were also performed on 0% and 3% deformed as-SLM samples, and prepared by ion milling. According to Williamson and Hall method [18], the dislocation density was measured by x-ray diffraction (XRD) and the experimental results were processed by the analysis software JADE. The method used XRD patterns to calculate the internal strain ε and grain size N.

Where FW(S) is the full width at half maximum (FWHM) of the diffraction peak, θ is the diffraction angle, K is a constant and usually K = 1, λ is the wavelength of the x-ray, N is the apparent size parameter, ε is internal strain, respectively. In this study, it is assumed that the internal strain is caused by dislocation, and the dislocation density can be calculated in the following form [19]:

Where ρ is the dislocation density, k is a constant and usually k = 16.1 for face-centered cubic crystals, b is the Burgers vector, respectively.
Flat dog-bone-shaped tensile samples with a 10 mm gauge were machined from the as-SLM specimen parallel to the building direction and the CT specimen parallel to the rolling direction. Then, in accordance with the GB228–2010 standard, the mechanical properties were tested using an electronic universal testing machine with a rate of 2 mm min−1. Three tensile tests were performed for each process at room temperature to confirm reliability. The morphology of tensile fracture surfaces was analyzed by SEM. Some as-SLM samples were tensile tested at 3% strain, and the uniformly deformed section in the middle was taken for TEM observation. Sampling at the necked region after tensile specimen fracture for EBSD characterization.
3. Result and discussion
3.1. Initial microstructures
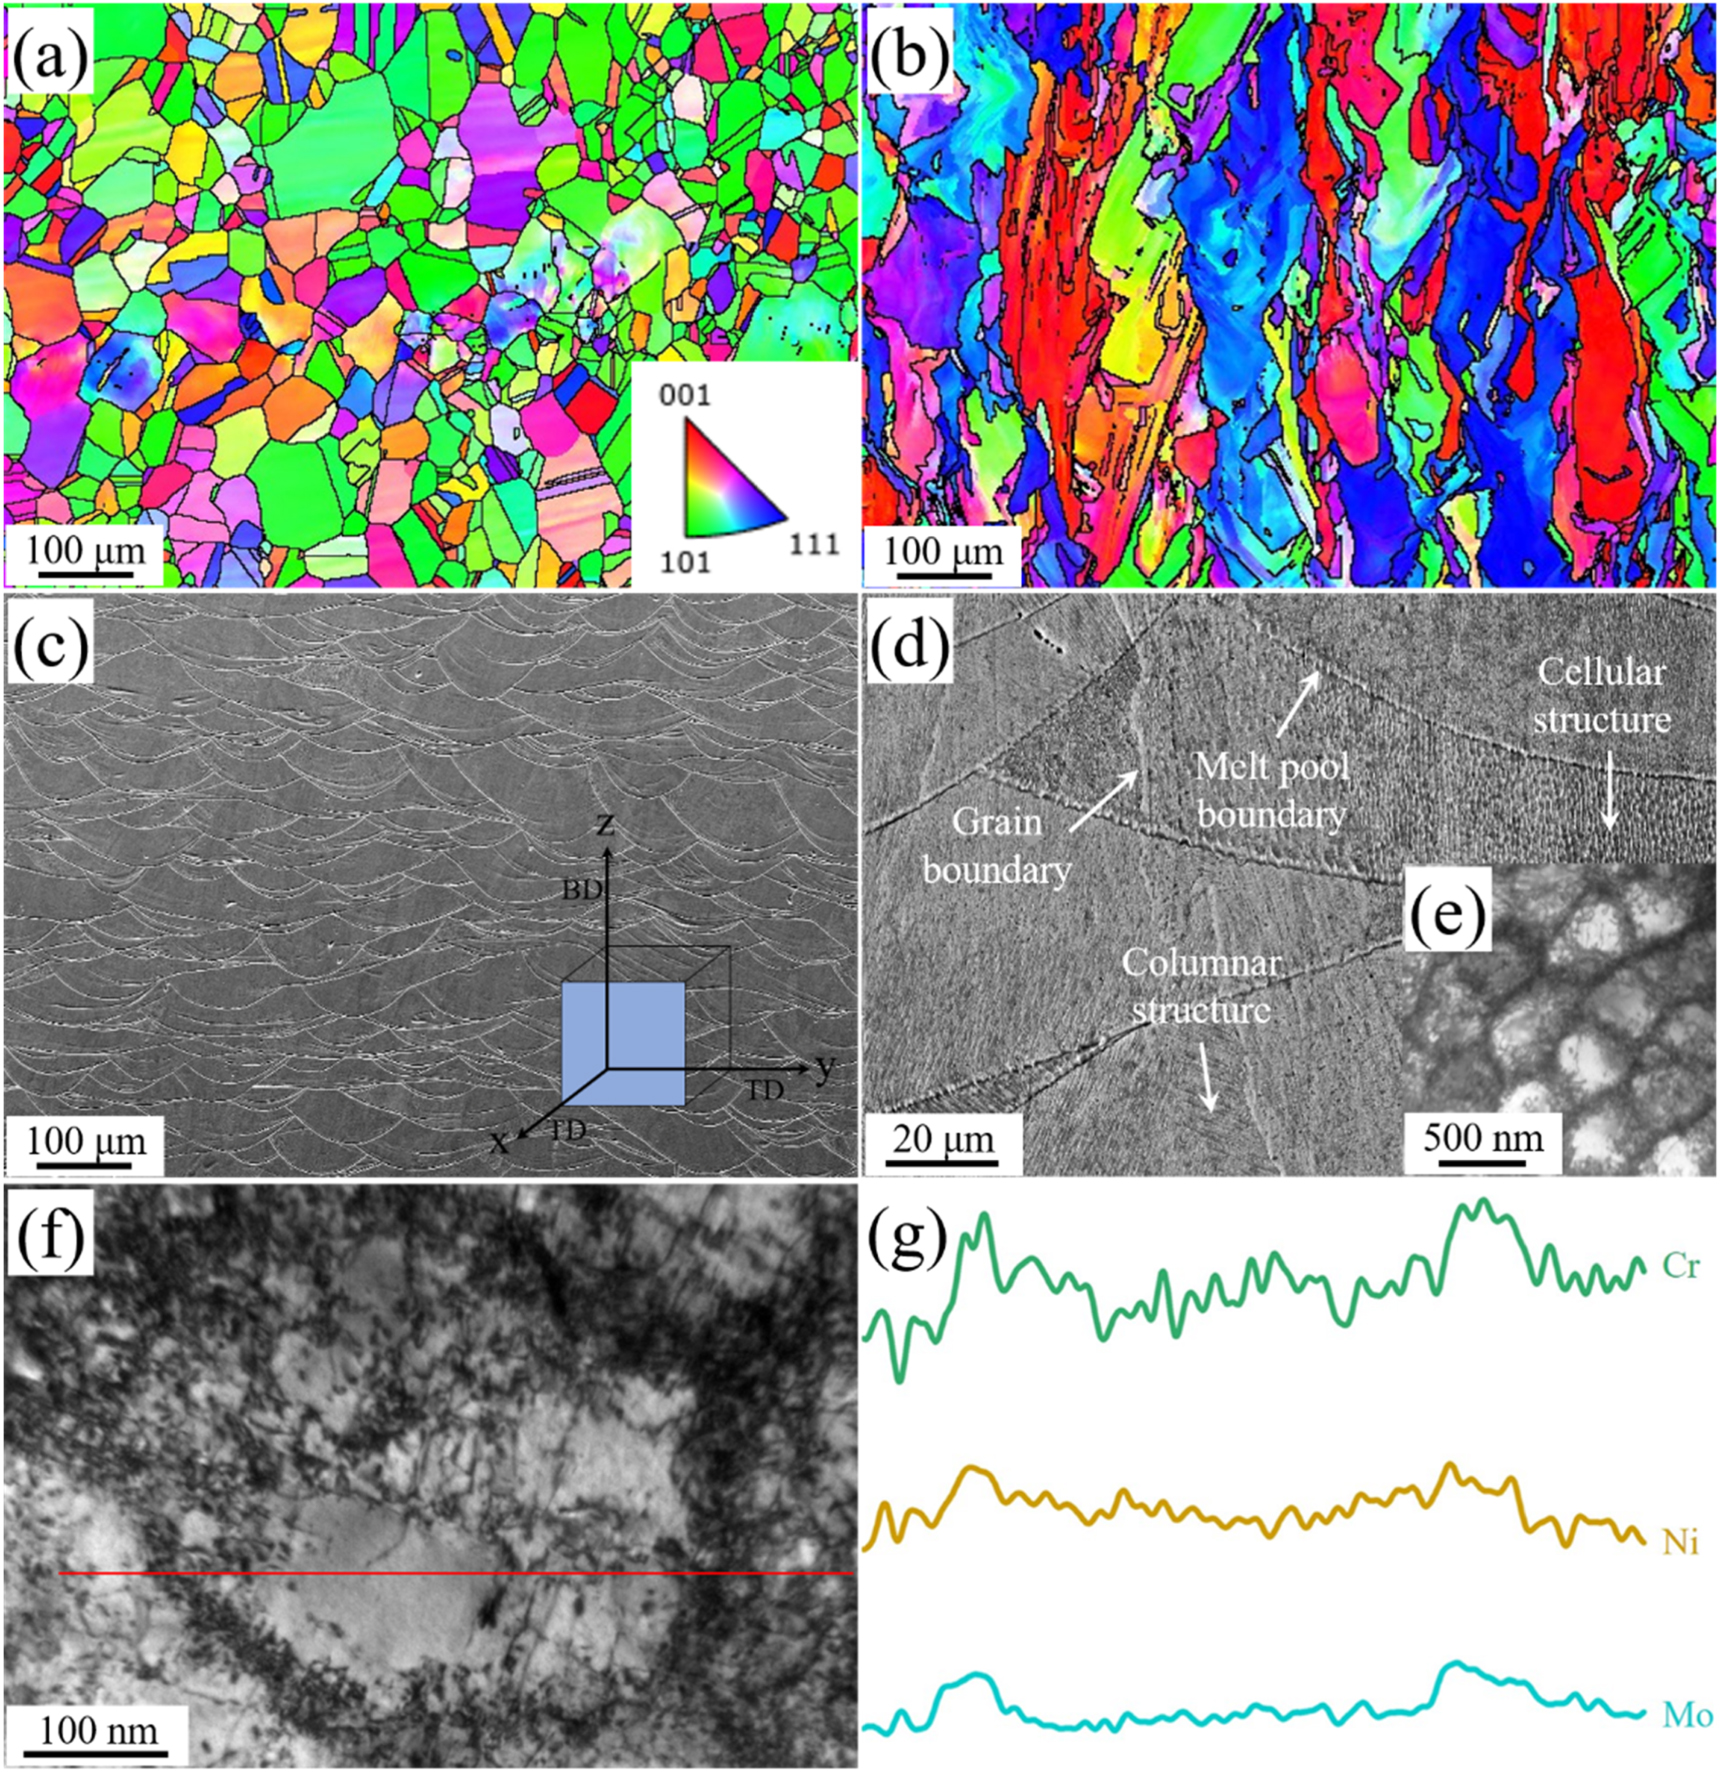
In this work, the density of as-SLM was determined at more than 99.5% using the Archimedes method. Figure 2 shows the microstructure of CT and as-SLM samples. The grain orientation distribution and grain size of the samples were obtained by EBSD, as shown in figures 2(a)–(b). It is clear that the sample made with conventional shows a great number of <110> textures. It has equiaxed grains and the overall average grain size is smaller than that of the as-SLM sample. The sample fabricated by SLM, in contrast, is dominated by irregularly shaped columnar grains in the building direction, leading to a highly random grain distribution with a low texture level. Figure 2(c) shows the melt pool boundary eroded by an oxalic acid solution of the sample fabricated by SLM. It is the boundary between the solid matrix and the melt pool, presenting the final shape of the solid/liquid interface. Figure 2(b) shows no distinct melt pool boundary, indicating that the crystallographic orientation changes on both sides of the melt pool boundary are non-obvious. It is also found under high magnification SEM image that grains could grow along the building direction across the molten pool boundary, and cellular and columnar substructures were distributed inside the microstructure. TEM image shows that these substructure boundaries contain high-density dislocations, constituting a dislocation network with similar morphology to conventional dislocation walls, as shown in figure 2(e), consistent with previous studies [20, 21]. TEM-EDS analysis of the cell structure in figure 2(f) confirms the segregation of Cr, Mo and Ni at cell walls.

Figure 2. Grain orientation distribution mappings of (a) CT and (b) as-SLM samples, (c) low magnification and (d) high magnification SEM images showing the melt pool boundary and substructure of as-SLM, (e) TEM image showing cell structure, (f) a cell structure, (g) TEM-EDS line scan results of cell structure in (f).
Download figure:
Standard image High-resolution imageIn addition, the XRD dislocation density of 316L stainless steel formed by SLM and conventional was determined. The XRD patterns and the internal strain fitting results are shown in figure 3. The calculated average dislocation density of the as-SLM samples is about 1.06 × 10¹⁵ m−2 based on the W-H relationship. However, the dislocation density of CT sample is only 0.65 × 10¹³ m−2. The microstructure formed by these two methods is single-phase austenite, but higher dislocation density can be achieved by selective laser melting technology.

Figure 3. XRD patterns of the as-SLM and CT samples and their Williamson-Hall plots.
Download figure:
Standard image High-resolution image3.2. Mechanical properties
The stress-strain curves indicate that the as-SLM sample has excellent mechanical properties than CT, especially more than twice the yield strength, as shown in figure 4(a). As-SLM strength rises rapidly at the initial tensile stage and approaches its tensile strength soon. After reaching the tensile strength, the strength only decreases slightly in the subsequent long range, so it has a long stage of uniform plastic deformation. However, the CT strength gradually increases with increased strain when it exceeds the yield strength, and enters the necking stage soon after reaching tensile strength resulting in a short uniform plastic deformation stage. Usually, the yield strength of metal or alloy has a specific relationship with the grain size, that is, increased average grain size causes decreased yield strength within a certain range. It can be seen from figures 2(a)–(b) that the as-SLM sample has a bigger average grain size and higher yield strength than CT, which does not conform to the traditional Hall-Petch theory. This means that the theoretical H-P relationship does not apply to the sample formed by SLM. The dislocation density is the main factor affecting the initial plastic deformation stress and a major contributor to enhanced yield strength. According to Taylor hardening law [22], the contribution of dislocation density to as-SLM yield strength is 423 MPa, which occupies an enormous part of the measured value of 574 MPa. This suggests that the enhanced yield strength is largely contributed by the high dislocation density.

Figure 4. (a) Engineering stress-strain curve, (b) work hardening rate plots of as-SLM and CT samples.
Download figure:
Standard image High-resolution imageFigure 5 shows the comparison of strength and ductility of present 316L stainless steel fabricated by SLM. Compared with those previous reports [15, 20, 23–29], our present work presented a higher strength and ductility combination. The unique dislocation network structure in SLM 316L stainless steel could hinder the dislocation movement during deformation, but the dislocation movement did not stop completely. A part of the dislocation continuously slid across the cell walls as the deformation increased, increasing strength without reducing ductility. Solute segregation at the cell wall pinned dislocations and effectively stabilized the dislocation network. Smaller substructure size resulted in shorter free travel distance for movable dislocations and a strong interaction between dislocations. Meanwhile, partial moveable dislocations were trapped by the cell walls, leading to twinning as another way of deformation. According to the TEM image in figure 2(e), the as-SLM sample exhibits finer substructures with an average cell size of 0.36 μm, less than the average cell size studied by Liverani et al [15] andMarattukalam et al [27]. Thus, the substructure maintained a steady plastic flow throughout the tensile deformation stage to improve ductility [29].

Figure 5. Compared to the (a) yield strength and elongation, (b) ultimate tensile strength and elongation in other literature of the 316L stainless steel formed by SLM.
Download figure:
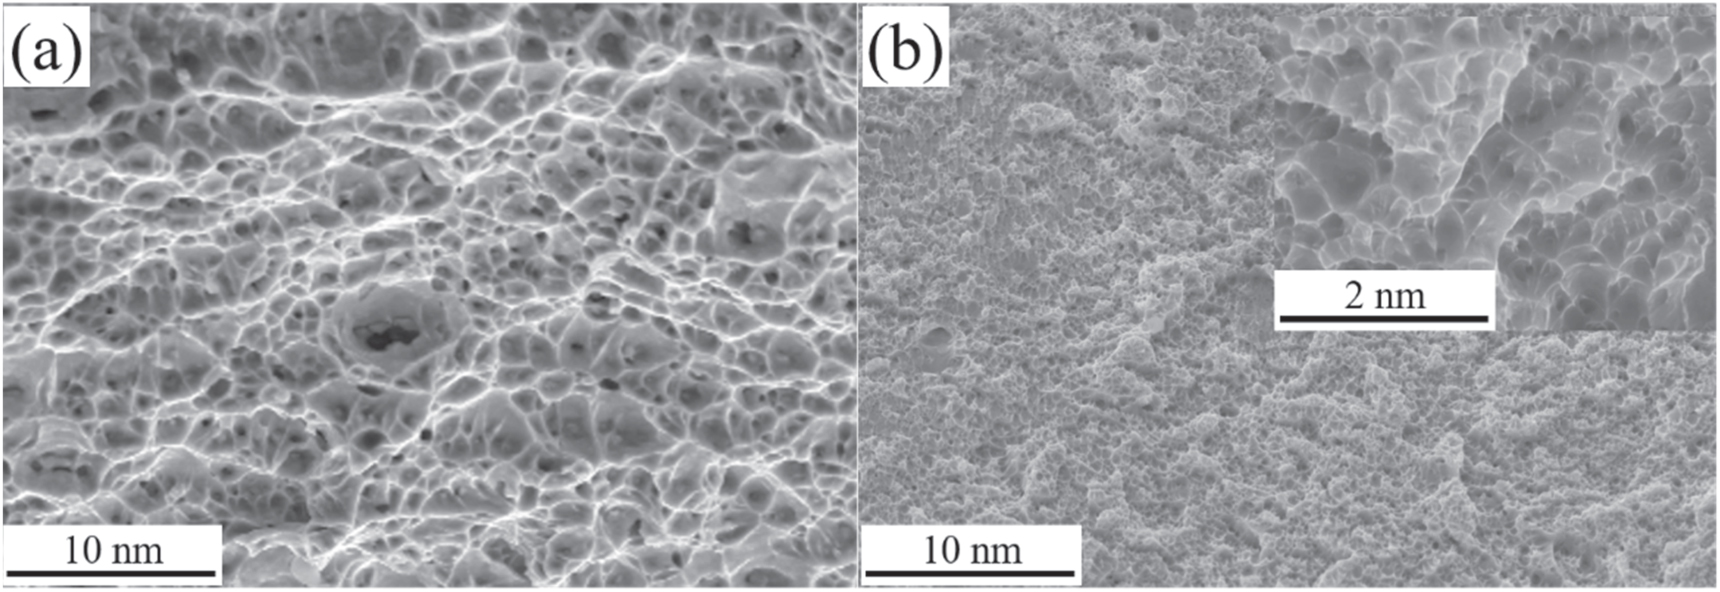
Standard image High-resolution imageThe fractured surfaces of CT and as-SLM tensile testing samples are shown in figure 6. Both samples are typical ductile fractures but have varying dimple depths and sizes. The fracture surface of as-SLM shows a high density of fine dimples with a sub-micron scale much smaller than that of the CT sample, corresponding to the cell structure of SLM samples caused by the rapid cooling rate. These small and dense dimples as the result of micropore nucleation, growth, and aggregate fracture that absorb more energy during deformation and enhance ductility.

Figure 6. Fractured surfaces of (a) the CT and (b) as-SLM samples.
Download figure:
Standard image High-resolution image3.3. Microstructure evolution
Figure 7 shows the TEM microstructure of the as-build sample and 3% deformed sample. The laser beam melts the powder layer and rapidly solidifies, causing the solidified layer be reheated or even be remelted during the SLM process. Higher cooling rate (106–108 K s−1) [30], as well as rapid heating/cooling and repeated heating/cooling thermal cycles experienced by local areas in a very short time caused internal stress in the forming parts and produced stacking faults (SFs) in some high-stress regions, as shown in figure 7(a). Figures 7(b)–(d) shows the representative microstructure at the strain of 3%, suggesting twinning has occurred in the initial deformation stage. The inset SAD pattern in figure 7(b) identifies the location as deformation twins with the [011] zone axis. Figure 7(c) shows the high-resolution TEM micrograph of the twin region in figure 7(b), showing the formation of fine nano twins. It is also found that several SFs are interspersed in the twins, which proves that SFs can evolve into twins. Furthermore, a higher density of SFs is formed compared to the undeformed microstructure, as shown in figure 7(d). These SFs can penetrate the cell walls and remain in the same direction. Figures 7(f) and (g) are SFs in two directions, corresponding to regions '1' and '2' in figure 7(e), respectively. According to the local magnified high-resolution image, SFs appears as a layer of dislocated atoms on the atomic scale, and two SFs with different directions form the intersection of primary and secondary SFs on the microscopic scale. The inset SAD patterns in figures 7(b)–(e) indicate that both SFs and twins appear in the grains with the [011] zone axis.

Figure 7. TEM images of (a) as-build and (b)–(g) 3% deformed samples, (a) stacking faults (SFs) of as-build, (b) deformation twins at 3% strain, (c) high-resolution micrograph of twins in (b), (d) SFs at 3% strain, (e) high-resolution micrograph of SFs in (d), (f) and (g) local magnification of regions '1' and '2' in (e), respectively.
Download figure:
Standard image High-resolution imageFigure 8 shows EBSD results of as-SLM and CT samples in the nearby fracture region, including inverse pole figure (IPF) maps, grain boundary (GB) maps, band contrast (BC) and phase maps. According to the IPF maps, the deformed samples parallel to the rolling direction/building direction show more elongated grains and no significant orientation change is observed compared with undeformed. Twinning is found in more grains of the as-SLM sample (figure 8(b)). This result indicates that the sample fabricated by SLM experienced apparent grain rotation and twinning development during deformation compared with CT, increasing the proportion of deformation twins and Σ3 grain boundary. In addition, the as-SLM sample shows strong austenite stability during the deformation process, and it is directly transformed from austenite to martensite. Instead, it is coordinated by ε-M as a transition phase and then transformed into α'-M. It means that the martensitic transformation proceeds through the γ, ε-M to α'-M. Abundant dislocations generate in the CT sample during deformation and promote martensite transformation. The α'-M is situated in the micro-deformation bands with (211) orientations, as shown in figure 8(g).

Figure 8. EBSD results of as-SLM (a)–(c) and CT (d)–(g) samples near the fracture. (a, d) inverse pole figure (IPF) maps, (b), (e) grain boundary (GB) maps, (c), (f) band contrast (BC) and phase maps; (g) IPF map of corresponding α'-M in (f). Red line represents Σ3 boundary in (b, e), Blue and green in (c), (f) represent ε-M and α'-M, respectively.
Download figure:
Standard image High-resolution image
As the work hardening rate curve shown in figure 4(b), the CT sample is significantly higher than that of as-SLM. The strain-induced martensitic transformation affects the mechanical properties of conventional austenitic stainless steels during plastic deformation. Martensite transformation is mainly assisted by dislocation slip. The formed α'-M acts as an obstacle to dislocation slip to cause dislocation accumulation, leading to the increase in work hardening rate and obvious hardening phenomenon. Therefore, to CT sample, dislocation slip, twinning and martensite transformation dominate the whole deformation process. However, dislocation slip is dominant at the beginning of deformation of as-SLM sample. The high initial dislocation density make it was difficult for dislocations to continue to proliferate, so the work hardening rate decreases rapidly with the increment of true strain. A high-stress state at the initial stage of sample deformation is higher than the critical shear stress for twins. The stacking faults develops towards twins once deformation begins because they are previously existed before deformation, and the twin density gradually rises. Dislocations slip and twinning play a strengthening role at this stage. Subsequently, work hardening rate curve up-turned and remains stable. Several substructures exist in the as-built sample, leading to dislocation tangle or piled up with the increment deformation. The movement of movable dislocations is blocked, making the curve rise. As the deformation continues to increase, deformation twins are effective barriers to the dislocation movement. Meanwhile, the strengthening effect of twins inhibit the occurrence of plastic instability, so twins maintain high strength and bring better ductility. Finally, the work hardening rate is decreased due to the hardening ability of the deformation twins are not enough to maintain uniform plastic deformation. Twins are intersected in austenite at high strain produced stress concentration, resulting in minority of austenite to martensite transformation.
4. Conclusions
The high dislocation density (1.06 × 10¹⁵ m−2) largely contributes to the enhancement of yield strength in 316L stainless steel fabricated by SLM. As-SLM shows the yield strength of 584 MPa, nearly double that of CT sample. Dislocation slip is dominant when the as-SLM sample begins to deform, but the high initial dislocation density increases the difficulty of dislocation proliferation. The substructure is surrounded by high-density dislocations which limit the free travel distance of movable dislocations, resulting in dislocation tangle and piled up. In addition, stacking faults already is existed in the sample before deformation, and the stress state at the beginning is higher than the critical shear stress of twins. Therefore, twinning occurs early in the deformation and accompanies the plastic deformation process until fracture. The EBSD results at the nearby fracture region also confirms majority of deformation twins and minority of ε-M and α'-M are existed. Above results indicate that twinning and dislocation slip jointly dominate the deformation behavior of SLM sample during the tensile process, and deformation twins are responsible for the steady work hardening.
Acknowledgments
This work was supported by The New Energy Automobile Material Production and Application Demonstration Platform Project (No.TC180A6MR-1).
Data availability statement
All data that support the findings of this study are included within the article (and any supplementary files).
Declaration of competing interest
The authors confirm that there is no conflict of interest regarding the work presented in this paper.