
Abstract
Utilization of plant extracts for the corrosion protection of metallic alloys has increased significantly in the last few years. Ginger (GII), tea tree (TT) and grapefruit (GP) essential oil extracts were evaluated for their corrosion protection effect on mild steel in 0.5 M H2SO4 media by potentiodynamic polarization, weight loss analysis, open circuit potential measurement, optical microscopy and ATF-FTIR spectroscopy. Corrosion rate from weight loss and polarization at 0% extract concentration decreased from 63.33 mm y−1 and 18.01 mm y−1 to values between 0.31 mm y−1 and 1.96 mm/y for weight loss, and 0.604 mm y−1 and 0.161 mm/y for polarization at optimal extract concentration. Generally, the extracts performed effectively with inhibition efficiency above 95%. The extracts displayed mixed-type inhibition properties though with significant effect on the cathodic plot while the anodic plots indicate activation control mechanism. Corrosion inhibition of GII extract obeyed the Langmuir and Frumkin isotherm model while TT extract inhibition adhered to Langmuir, Frumkin, Frundlich and Temkin isotherms. GP extract inhibition obeyed the Langmuir isotherm only. Correlation coefficient of the isotherms were generally above 0.9. Adsorption of the extracts aligned with chemisorption adsorption from thermodynamic calculations. Open circuit potential plots in the presence of the extracts/acid solution generally depict significant electropositive shift compared to the plot in the absence of the extracts which was relatively electronegative. Potential variations were observed on the plots of the extracts due to miniature active passive transit characteristics at the extract-metal interphase. ATF-FTIR spectroscopic data shows the functional groups in TT extract molecules adsorbed onto the steel exterior compared to GII and GP extract molecules which depict surface coverage from analysis of the wavelength and transmittance data. Optical image of mild steel after corrosion depicts significantly degraded exterior with corrosion pits. However, in the presence of the extracts the steel morphology was well protected.
Export citation and abstract BibTeX RIS

Original content from this work may be used under the terms of the Creative Commons Attribution 4.0 licence. Any further distribution of this work must maintain attribution to the author(s) and the title of the work, journal citation and DOI.
Introduction
Degradation of carbon steels in aqueous industrial and domestic applications is of great scientific and economic importance due to the cost of maintenance of the steel in application, repair of damaged mechanical components and increasing complexity of operating environment. Carbon steel corrosion is excercebated by the presence of multifunctional anionic species such as Cl–, SO4 2−, NO− 3, S2O3(2_) [1] within the environment. The universal applicability of carbon steels in contrast to stainless steels is due to its versatility, economic advantage, mechanical and metallurgical characteristics, ease of manufacture and recyclability [2, 3]. The application of carbon steels extends to pipeline construction, gas refining, mining, manufacture of fertilizers, radiator tank of automobiles, chemical and intermediate chemical production, energy production, heavy industrial machines, desalination plants and marine applications [4]. The high vulnerability of carbon steels to corrosion is traceable to lack of passivating elements within its microstructure, thus it is unable to produce an impenetrable protective oxide on its surface. Other factors that significantly weaken the corrosion resistance of carbon steels are the degree of moisture within the environment, pH of the environment and ionic concentration [5]. The extensive production and application of H2SO4 most especially as a precursor to the manufacture of other chemicals is responsible for the prevalent abundance of SO4 2− anions in aqueous environments. Mining and refining of ores, processing of crude oil, production of rubber, electroplating, electrodeposition etc also involve the extensive application of H2SO4 [6–8]. Corrosion of carbon significantly limits their operational lifespan and usefulness; hence the need for cost effect method of mitigating the corrosion problem.
Most of the conventional methods of corrosion control e.g. paint coatings, electrodeposition, hot-dip galvanization, electroplating etc are limited in versatility and cost. Corrosion inhibitors are comparatively cost effective, versatile in application and have been approved to be effective for decades in controlling corrosion. However, the known potent corrosion inhibitors in closed industrial applications are noxious, harmful to personnel and environment with regards to UN sustainable development goals e.g. arsenics, nitrates, phosphates, nitrites, chromates etc [9–11]. Corrosion inhibitors of organic origin are also toxic coupled with relatively high manufacturing cost [12–14]. Inhibitors are chemical compounds that limits the oxidation-reduction reactions liable for corrosion on metallic surfaces [15–17]. This occurs through the evolution of a protective film over the metal exterior, alteration of the corrosive medium, and adsorption on functional sites on the steel. Investigation into the corrosion protection properties of green chemical compounds with emphasis on essential oils has produced interesting results on a broad scale with some oils been effective [18–21] and others marginal in performance due to weak their adsorption properties [22–30]. Essential oils are complex aromatic compounds extracted from plant sources and majorly consist of terpenes, nitrogen, aldehydes, phenols, ketones, esters, fatty acids, alcohols, and sulphur constituents [31]. Most of the constituents are phytochemical in action with huge potential for effective protection of metallic alloys [32]. Research to establish corrosion inhibition properties of essential oil in general is ongoing and is of utmost importance due to their sustainability and availability [33–40]. Research by Znini [41], Bathily et al [42] and Hossain et al [23] reviewed a total of over 200 research publications on the corrosion inhibition properties of different essential oils. Generally, it was observed that they exhibited effective corrosion inhibition properties with respect to their concentration and chemical properties in the corrosive media coupled with mixed-type corrosion inhibition behaviour. Performance of green chemical compounds is considerably limited by weak adsorption and poor corrosion inhibition at low concentrations. This can be evaluated through adequate assessment of the corrosion protection effect of plant extracts and their minimum concentration for peak performance. This articles discusses the corrosion protection properties of ginger, tea tree and grapefruit essential oil extracts mild steel in 0.5M H2SO4 solution.
Experimental methods
Materials preparation
Mild steel (MS) test pieces with circular dimension of 1.2 cm consists of 0.21% Cu, 0.29% Si, 1.04% Mn, 0.27% C, 0.08% S, 0.05% P and 98.08% Fe energy dispersive spectroscopy with PhenomWorld scanning electron microscope. The MS test pieces were cut with high speed serrating tool into separate proportion of 1 cm length for weight loss analysis. MS test pieces for potentiodynamic polarization and open circuit potential analysis were fixed to a Cu wire with soldering lead before embedded in pre-hardened epoxy mixture. The exposed surfaced of the steel was abraded with emery papers (60–1500 grits) and burnished with 6 μm diamond solution before to washing with deionized H2O and acetone. Ginger (GII), tea tree (TT) and grapefruit (GP) essential oil extracts were ordered from NOW Foods in the United States of America, and prepared in volumetric concentrates of 0%, 1%, 1.5%, 2%, 2.5%, 3% and 3.5% separately in 200ml of 0.5M H2SO4 solutions.
Potentiodynamic polarization and open circuit potential measurement
Electrochemical investigation was done at 35 °C atmospheric temperature with a Digi-Ivy 2311 potentiostat (consisting of ternary multicomponent electrode configuration within a glass beaker holding the acid-extract solution) and connected to a computer device. The electrodes are MS electrodes with visible area of 1.126 cm3, Ag/AgCl standard electrode and Pt wire counter electrode. Polarization curves were plotted at sweep rate of 0.0015 V s−1 at potential ranges of −1.1 V to +1.65 V. Corrosion current density CJ, (A cm−2) and corrosion potential, Cp (V) values were obtained through Tafel derivation. Corrosion rate, CRT (mm/y) was computed from the numerical expression below;

where Cq is the equivalent weight (g) of MS, 0.00327 represents corrosion constant and D is density (g cm−3). Inhibition efficiency, IEF (%) was calculated from below;

CRT1 and CRT2 represents MS weight loss without the extracts and with the extracts. Polarization resistance, PR, (Ω) was computed from below;

Ba and Bc represents the anodic and cathodic Tafel slopes (V dec−1).
ATF-FTIR Spectroscopy and Optical microscopy characterization
1% GII concentration/0.5 M H2SO4, 1% TT concentration/0.5 M H2SO4 and 1% GP concentration/0.5 M H2SO4 media before and following corrosion test were delineated under infrared particle emissions with Bruker Alpha FTIR (Fourier transform infrared spectroscopy) spectrometer limited to wavelength range of 375 to 7500 cm−1, and precision of 0.9 cm−1. Spectral patterns were analysed and matched to the standard ATF-FTIR (Attenuated total reflectance-Fourier transform infrared spectroscopy) table. Tabulations were done for the functional groups liable for the inhibition of the corrosion reaction process. Morphological image characterization of MS specimens before, and following the corrosion test in the acid media was performed with a Mustech digital microscope.
Weight loss measurement
Weight of MS steel test pieces were computed and separately hanged in 200 ml of the acid-extract electrolyte for 240 h. Weight measurement was performed at 24 h interval. Corrosion rate, CRT (mm/y) was estimated from the formulae below;

WL illustrates weight loss (g), D is density (g cm−3), A is total surface of the MS specimen (cm2) and 87.6 is the corrosion rate constant. t is time (h). Inhibition efficiency (η) was computed from the following numerical relationship;

WL1 and WL2 are weight loss at predetermined extract concentrations.
Results and discussion
Potentiodynamic polarization studies
Potentiodynamic polarization plots for MS corrosion in H2SO4 media in the presence of specific concentrations of GII, TT and GP extracts are shown in figures 1(a)–(c). The polarization data are presented in table 1. Corrosion rate of MS at 0% extract concentration is 18.010 mm y−1 corresponding to corrosion current density of 1.71 × 10⁻³ A cm−2 and polarization resistance of 13.31 Ω. This is confirmed from the significantly higher cathodic and anodic Tafel plots (figures 1(a)–(c)). Addition of GII, TT and GP extracts at 1% concentration substantially reduced the corrosion rate of MS to 1.751 mm y−1, 0.605 mm y−1 and 0.480 mm y−1 (inhibition efficiency of 90.28%, 96.64% and 97.33%), and corrosion current density of 1.66 × 10⁻⁴ A cm−2, 5.74 × 10⁻⁵ A cm−2 and 4.56 × 10⁻⁵ A cm−2. Reduction in corrosion rate was observed GII extract concentration increased till 0.161 mm y−1 (99.11% inhibition efficiency). Corrosion rate of MS in TT/H2SO4 solution varied with TT concentration but did not significantly decrease with corrosion rate of 0.604 mm y−1 (inhibition efficiency of 96.65%) at 3.5% TT concentration. MS corrosion rate increased to 0.616 mm y−1 at 2% GP concentration before decreasing to 0.121 mm y−1 (inhibition efficiency of 99.33%).
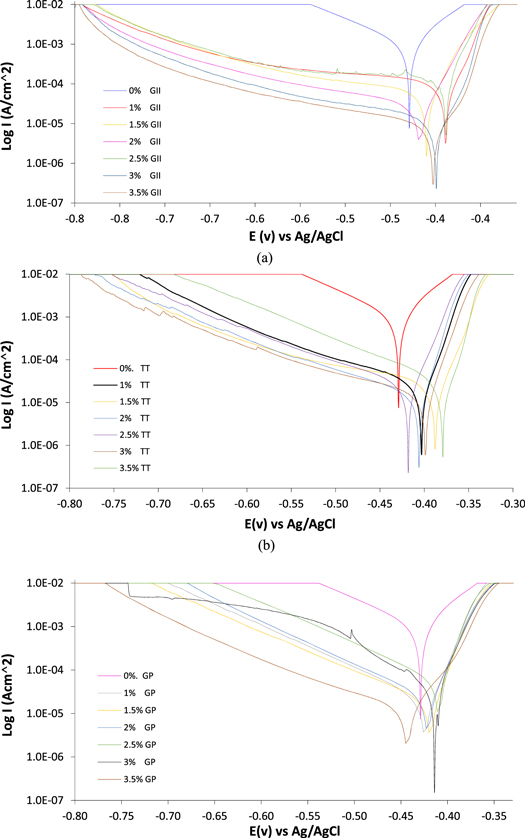
Figure 1. Potentiodynamic polarization plots for MS corrosion in 0.5M H2SO4 solution at 0% − 3.5% extract concentration (a) GII, (b) TT and (c) GP extract.
Download figure:
Standard image High-resolution imageTable 1. Potentiodynamic polarization data for GII, TT and GP extract inhibition on MS corrosion in 0.5M H2SO4 solution.
| GII extract | |||||||
|---|---|---|---|---|---|---|---|
| Extract concentration (%) | MS corrosion rate (mm/y) | GII inhibition efficiency (%) | Corrosion current density (A cm−2) | Corrosion potential (V) | Polarization resistance, Rp (Ω) | Cathodic potential, Bc | Anodic potential, Ba |
| 0 | 18.010 | — | 1.71E-03 | −0.429 | 13.31 | −9.252 | 12.761 |
| 1 | 1.751 | 90.28 | 1.66E-04 | −0.389 | 136.90 | −1.813 | 13.792 |
| 1.5 | 1.095 | 93.92 | 1.04E-04 | −0.410 | 218.80 | −2.550 | 16.030 |
| 2 | 0.533 | 97.04 | 5.06E-05 | −0.417 | 449.80 | −3.404 | 14.250 |
| 2.5 | 0.402 | 97.77 | 3.82E-05 | −0.388 | 759.54 | −1.341 | 11.643 |
| 3 | 0.227 | 98.74 | 2.15E-05 | −0.399 | 1055.00 | −3.184 | 10.184 |
| 3.5 | 0.161 | 99.11 | 1.52E-05 | −0.402 | 1492.00 | −3.523 | 13.000 |
| TT Extract | |||||||
| Extract concentration (%) | MS corrosion rate (mm/y) | TT inhibition efficiency (%) | Corrosion current density (A/cm2 ) | Corrosion potential (V) | Polarization resistance, R p (Ω) | Cathodic potential, B c | Anodic potential, B a |
| 0 | 18.010 | — | 1.71E-03 | −0.429 | 13.31 | −9.252 | 12.761 |
| 1 | 0.605 | 96.64 | 5.74E-05 | −0.403 | 395.80 | −5.462 | 0.742 |
| 1.5 | 0.486 | 97.30 | 4.61E-05 | −0.388 | 493.20 | −3.046 | 0.033 |
| 2 | 0.396 | 97.80 | 3.75E-05 | −0.406 | 605.70 | −6.174 | 0.048 |
| 2.5 | 0.586 | 96.75 | 5.56E-05 | −0.418 | 409.00 | −6.269 | 0.554 |
| 3 | 0.375 | 97.92 | 3.56E-05 | −0.399 | 638.90 | −4.704 | 0.020 |
| 3.5..3 | 0.604 | 96.65 | 5.73E-05 | −0.379 | 397.00 | −7.576 | 0.056 |
| GP Extract | |||||||
| Extract concentration (%) | MS corrosion rate (mm/y) | GP inhibition efficiency (%) | Corrosion current density (A/cm2 ) | Corrosion potential (V) | Polarization resistance, R p (Ω) | Cathodic potential, B c | Anodic potential, B a |
| 0 | 18.010 | — | 1.71E-03 | −0.429 | 13.31 | −9.252 | 12.761 |
| 1 | 0.480 | 97.33 | 4.56E-05 | −0.424 | 499.10 | −9.625 | 2.15 |
| 1.5 | 0.520 | 97.11 | 4.93E-05 | −0.418 | 461.10 | −8.553 | 1.76 |
| 2 | 0.616 | 96.58 | 5.84E-05 | −0.421 | 389.10 | −9.409 | 2.71 |
| 2.5 | 0.180 | 99.00 | 1.71E-05 | −0.409 | 133.00 | −9.786 | 2.07 |
| 3 | 0.100 | 99.45 | 9.48E-06 | −0.414 | 239.90 | −11.926 | 1.15 |
| 3.5 | 0.121 | 99.33 | 1.15E-05 | −0.435 | 221.00 | −8.308 | 3.61 |
Generally, the cathodic plot for the extracts varies as extract concentration increases due to significant influence of the protonated extract molecules on the H2 evolution and O2 reduction reactions. The molecules precipitate on reactive sites on the steel surface. However, the effectiveness of the precipitation is subject to available of sufficient extract molecules. Figure 1(a) shows GII extract substantially influenced the mechanism cathodic reaction process from the substantial decrease of the cathodic portion of the polarization plot compared to TT and GP extracts. The higher the GII extract concentration, the lower the slope of the cathodic polarization plots. The anodic plots (figures 1(a)–(c)) were generally similar signifying effective surface coverage of MS through activation control and electrostatic attraction of the extract molecules. This influenced the protection effect of the extracts. Variation of corrosion potential of GII, TT and GP extract concentration to the potential at 0% extract concentration shows the inhibition performance of the extracts is a mixed-type [43, 44] i.e. the extract limited the redox reaction mechanisms liable for corrosion.
Weight loss measurement
Comparative analysis of the corrosion inhibition effect of GII, TT and GP oil extracts on MS in 0.5 M H2SO4 solution was performed by weight loss measurement. Plots of MS corrosion rate to measurement time in the presence of the extracts are shown from figures 2(a)–(c). Figures 3(a)–(c) shows the corresponding plots of GII, TT and GP inhibition efficiency values versus measurement time. Table 2 shows MS weight loss, MS corrosion rate and extracts (GII, TT and GP) inhibition efficiency data at 240 h of exposure in the electrolyte. Observation of the corrosion rate plots (figures 2(a)–(c)) shows the corrosion rate values of MS at 0% GII, TT and GP concentrations substantially varies from the plot at 1%–3.5% GII, TT and GP concentrations. This is by reason of the deteriorating action of SO4 2− anions in the electrolyte on MS surface through redox reaction mechanisms leading to accelerated corrosion of the steel. Corrosion rate at 0% extracts concentration initiated (24 h) at 41.95 mm y−1 and progressively deteriorated to 63.33 mm y−1 at 240 h. In the presence of the extracts (GII, TT and GP), the corrosion rate of the steel at all concentrations was substantially reduced. Plots in figure 1(a) shows corrosion rates of MS with GII extracts addition (1%–3.5% GII concentration) exhibited the lowest values in contrast to the plots in the presence of TT and GP extracts. In the presence of GII extract, corrosion rates initiated (24 h) at values between 0.835 and 1.392 mm/y. At 240 h, the culminating corrosion rate values varies between 0.278 and 5.012 mm/y. Corrosion rate values for TT extract varies between 1.156 and 11.582 mm y−1 at 240 h while the corresponding values for GP extract varies between 1.062 mm y−1 and 10.277 mm y−1 respectively. It must be noted that corrosion rate of MS at 1.5% GP concentration is slightly higher than the values at 2.5% and 3% GP concentration. This observation is probably due to marginal lateral repulsion among the inhibitor molecules. The effect is marginal because the corresponding inhibition efficiency value is above 90%

Figure 2. Plots of MS corrosion rate versus exposure time in 0.5 M H2SO4 media at (a) 0%–3.5% GII concentration (b) 0%–3.5% TT concentration and (c) 0%–3.5% GP concentration.
Download figure:
Standard image High-resolution image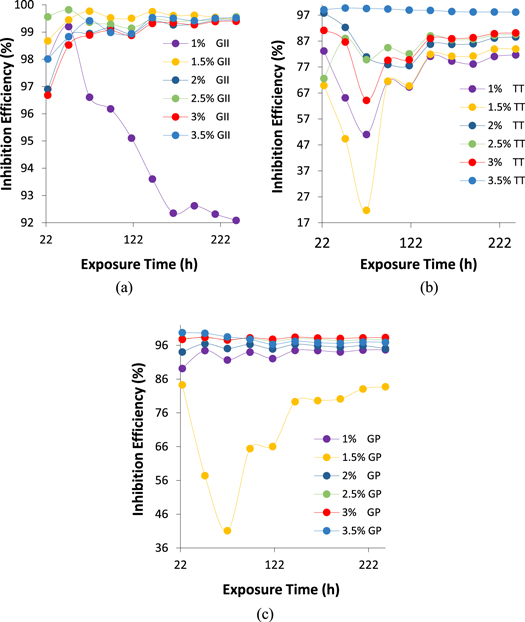
Figure 3. Plots of extract inhibition efficiency versus exposure time in 0.5 M H2SO4 media at (a) 1%–3.5% GII concentration (b) 1%–3.5% TT concentration and (c) 1%–3.5% GP concentration.
Download figure:
Standard image High-resolution imageTable 2. Data for MS weight loss, MS corrosion rate, and extract inhibition efficiency at 240 h of exposure.
| GII | TT | GP | |||||||||
|---|---|---|---|---|---|---|---|---|---|---|---|
| Extract conc. (%) | WL (g) | CRT (mm/y) | IEF(%) | Extract conc. (%) | WL (g) | CRT (mm/y) | IEF(%) | Extract conc. (%) | WL (g) | CRT (mm/y) | IEF(%) |
| 0% | 6.823 | 63.33 | — | 0% | 6.823 | 63.33 | — | 0% | 6.823 | 63.33 | — |
| 1% | 0.540 | 5.01 | 92.09 | 1% | 1.248 | 11.58 | 81.71 | 1% | 0.361 | 3.35 | 94.71 |
| 1.5% | 0.037 | 0.34 | 99.46 | 1.5% | 1.093 | 10.14 | 83.98 | 1.5% | 1.107 | 10.28 | 83.77 |
| 2% | 0.038 | 0.35 | 99.44 | 2% | 0.779 | 7.23 | 88.58 | 2% | 0.337 | 3.13 | 95.06 |
| 2.5% | 0.030 | 0.28 | 99.56 | 2.5% | 0.708 | 6.57 | 89.62 | 2.5% | 0.160 | 1.49 | 97.65 |
| 3% | 0.041 | 0.38 | 99.40 | 3% | 0.670 | 6.22 | 90.17 | 3% | 0.114 | 1.06 | 98.32 |
| 3.5% | 0.033 | 0.31 | 99.52 | 3.5% | 0.125 | 1.16 | 98.17 | 3.5% | 0.211 | 1.96 | 96.91 |
Apart from 1% GII concentration, corrosion rate plots of MS were generally similar from 24 h to 240 h signifying stability of the protection effect of GII extract with reference to time and concentration. Performance of TT and GP extract visibly varies with concentration (figures 2(b) and (c)) though TT extract shows significant time dependent performance before 96 h of exposure. Further insight to the protection performance of GII, TT and GP extracts on MS in the acid electrolyte are shown from figures 3(a)–(c). GII inhibition efficiency initiated (24 h) at values between 98.01% and 99.56% (1.5% to 3.5% GII concentration) and culminated at values between 99.46% and 99.56%. Inhibition efficiency values at 1% GII concentration decreased to 92.09% at 240 h in contrast to values at 1.5% to 3.5% GII concentration. Inhibition efficiency of TT extract generally decreased for the first 72 h before attaining relative stability at 144 h till 240 h. TT inhibition efficiency at 3.5% TT concentration was stable throughout the exposure hours. Inhibition efficiency of GP extract was stable at all concentrations but varies with concentration with the exception of 2.5% GP concentration which significantly varied with exposure time culminating at 83.77% (240 h).
Optical image analysis
Optical images of MS before corrosion test, after corrosion in 0.5M H2SO4 solution and after corrosion in the acid electrolyte in the presence of GII, TT and GP extracts are shown from figures 4(a)–(f). The image in figure 4(b) shows severe morphological deterioration compared to figure 4(a) due to oxidation of MS surface by SO4 2− anions. Macro-pits are clearly visible on the surface of the steel due to displacement of ionized Fe2+ anions into the electrolyte. The steel underwent accelerated corrosion and degradation in the acid solution. This image contrasts the images in figures 4(c)–(e), and figure 4(f) where the surface morphologies of MS displays sufficient resistance to electrochemical deterioration in the presence of the extracts. Morphological differences are due to the nature of electrochemical reaction between the extracts, SO4 2− anions and MS surface. Figure 4(c) shows GII protection involves reaction with MS surface to form non-corrosive precipitates while figures 4(d) and (e) shows the extracts forms a protective over the steel which limits the diffusion of the corrosive anions unto the steel surface.
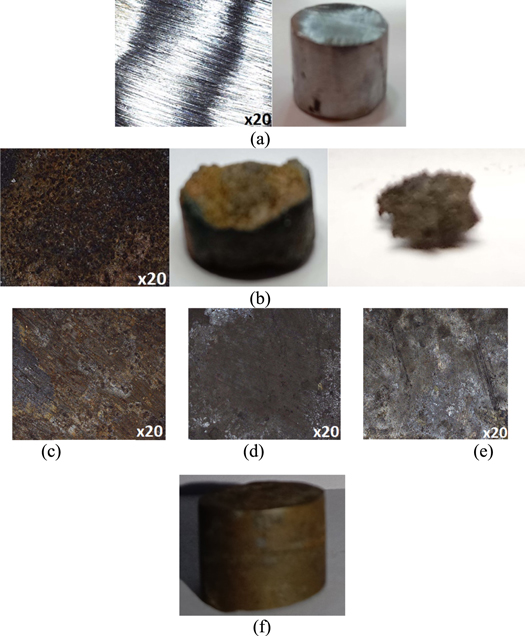
Figure 4. Optical images MS (a) before corrosion test, (b) after corrosion in 0.5M H2SO4 solution, (c) after corrosion in the presence of GII extract, (d) after corrosion in the presence of TT extract and (e) after corrosion in the presence of GP extract (f) representative image of extract inhibited steel.
Download figure:
Standard image High-resolution imageAdsorption isotherm and corrosion thermodynamics
Further insight into the corrosion protection effect of GII, TT and GP extracts on MS in H2SO4 media was gotten from numerical equations and plots depicting the extent of differentiation of extract molecular species adsorbed onto the steel surface at equilibrium conditions and stable temperature [45]. Ionized molecules of the extracts transit from the aqueous phase to the metal-solution interphase during corrosion inhibition reaction processes. Data from electrochemical analysis shows the extracts influenced the anodic and cathodic plots i.e. inhibition reaction occurred through surface coverage, covalent bonding, electrostatic attraction etc Adsorption of inhibitor molecules generally involves agglomeration of inhibitor molecules from the electrolyte on the ionized metal surface. Data from weight loss experimentation were analyzed with conventional adsorption isotherms while the correlation coefficient values was applied to estimate the most relevant adsorption isotherms. Langmuir, and Frumkin isotherms gave the highest correlation coefficient values for GII extract. Langmuir, Frumkin, Freundlich and Temkin isotherms gave the highest correlation coefficient values for TT extract while Langmuir isotherms was the only relevant model for GP extract. Table 3 shows the correlation coefficient data for the relevant adsorption isotherms.
Table 3. Correlation coefficient data for relevant adsorption isotherms.
| Adsorption isotherms | GII extract | GII extract | GII extract |
|---|---|---|---|
| Langmuir | 0.9989 | 0.9994 | 0.9845 |
| Frumkin | 0.7294 | 0.9002 | — |
| Freundlich | — | 0.9037 | — |
| Temkin | — | 0.9481 | — |
The inhibition reaction mode of GII extract on MS aligns with the Langmuir and Frumkin isotherm models. The Langmuir and Frumkin isotherm plots for GII inhibition on MS are shown in figures 5(a) and (b). Langmuir isotherm indicates that definite sum of reaction sites occurs on metallic surfaces in molecular layer form of adsorbed inhibitor molecules. The value of energy between the molecules is dependent on the dynamic equilibrium conditions in accordance with the equation below:

Kads represents the equilibrium constant of adsorption. Cex is the molar concentration of GII, TT and GP extracts. The Frumkin isotherm indicates that molecular adsorption on ionized non-homogeneous surfaces are uniform under high concentrations with reference to the potential of the adsorbent surface. The lateral interaction effect between the extract molecules is substantial and numerical according to the equation below:


Figure 5. Adsorption isotherm plots for GII extract on MS in H2SO4 solution (a) Langmuir isotherm and (b) Frumkin isotherms.
Download figure:
Standard image High-resolution imageLangmuir, Frumkin, Freundlich and Temkin adsorption were the relevant adsorption isotherm model for TT adsorption on MS in H2SO4 solution. There plots are shown in figures 6(a)–(d). The Temkin isotherm indicates that the heat of adsorption reduces in proportion to increase in surface coverage at equal binding energy distribution [46] with respect to the equation below:

Where

A represents Temkin isotherm constant (L/g), b represents Temkin constant associated with heat of adsorption, T represents temperature (K), R indicates gas constant (8.314, J/mol K) and Ce indicates concentration of adsorbate. The Freundlich isotherm indicates that adsorbed molecular interaction on metallic surfaces is related to the lateral interaction effect between them [44, 45]. The Freundlich equation is shown below:


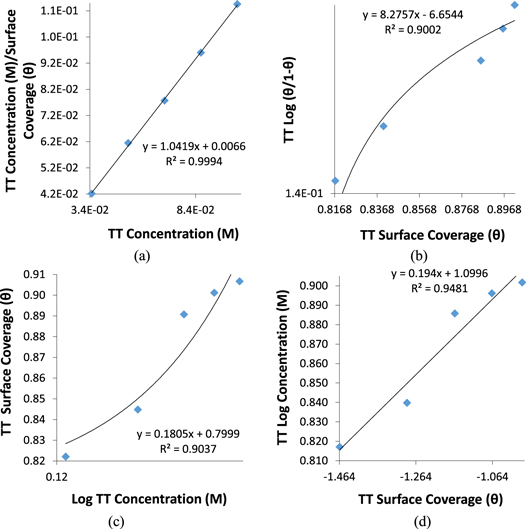
Figure 6. Sorption isotherm plots for TT extract on MS in H2SO4 solution (a) Langmuir isotherm, (b) Frumkin isotherm, (c) Freundlich and (d) Temkin isotherms.
Download figure:
Standard image High-resolution imagen represents the constant for the characteristics of adsorbed extract molecule. The Langmuir isotherm plot for GP adsorption on MS in H2SO4 solution is shown in figure 7.
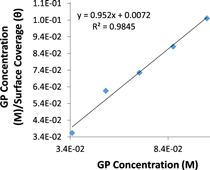
Figure 7. Dsorption isotherm plot for GP extract on MS in H2SO4 solution.
Download figure:
Standard image High-resolution imageData representing the Gibbs free energy (ΔG) for GII, TT and GP extracts adsorption MS surface in H2SO4 solution are presented in table 4. The data were obtained from equation (12). Equilibrium constant of adsorption (Kads) for the extracts were obtained from Langmuir equation due to their relatively significant correlation coefficient values.

55.5 represents molar concentration of H2O within the electrolyte, R represents universal gas constant, T indicates absolute temperature. ΔG data depicts chemisorption adsorption for GII, TT and GP molecules onto MS surface due to significant electrostatic effect and covalent bonding between the extract molecules and ionized MS surface [47]. The ΔG data show H2O molecules were substantially replaced by the extract molecules. This hinders the electrochemical action of SO4 2− anions in the electrolyte. The ΔG data for GII extract are relatively the highest values compared to other extracts due to chemisorption adsorption reaction mechanism. The lowest ΔG data were exhibited by GP extract though the values show physiochemical interaction effect. Nevertheless, the ΔG data for the extracts shows the molecular reaction between the extract molecules and the steel exterior stifled further corrosion of the steel surface, blocking the reaction sites and preventing electrolytic transport of SO4 2− anions to the steel.
Table 4. Data for Gibbs free energy (ΔG) and equilibrium constant of adsorption (Kads) in for GII, TT and GP extract adsorption on MS in H2SO4 solution.
| GII Extract | ||||
|---|---|---|---|---|
| LCS Samples | GII Concentration (Mol) | Surface Coverage (θ) | Equilibrium Constant of adsorption ( K ads ) | Gibbs Free Energy, ΔG (Kjmol−1 ) |
| A | 0 | 0 | 0 | 0 |
| B | 0.018 | 0.921 | 631739.27 | −43.05 |
| C | 0.028 | 0.995 | 6638713.26 | −48.88 |
| D | 0.037 | 0.994 | 4847293.33 | −48.10 |
| E | 0.046 | 0.996 | 4917715.16 | −48.13 |
| F | 0.055 | 0.994 | 2993751.33 | −46.90 |
| TT Extract | ||||
| LCS Samples | TT Concentration (Mol) | Surface Coverage (θ) | Equilibrium Constant of adsorption ( K ads ) | Gibbs Free Energy, ΔG (Kjmol−1 ) |
| A | 0 | 0 | 0 | 0 |
| B | 0.034 | 0.817 | 129768.68 | −39.13 |
| C | 0.052 | 0.840 | 101527.15 | −38.52 |
| D | 0.069 | 0.886 | 112627.15 | −38.78 |
| E | 0.086 | 0.896 | 100344.21 | −38.49 |
| F | 0.103 | 0.902 | 88867.06 | −38.19 |
| GP Extract | ||||
| LCS Samples | TT Concentration (Mol) | Surface Coverage ( θ ) | Equilibrium Constant of adsorption ( K ads ) | Gibbs Free Energy, ΔG (Kjmol−1 ) |
| A | 0 | 0 | 0 | 0 |
| B | 0.034 | 0.947 | 519991.39 | −42.57 |
| C | 0.052 | 0.838 | 99965.90 | −38.48 |
| D | 0.069 | 0.951 | 279197.43 | −41.03 |
| E | 0.086 | 0.977 | 483579.35 | −42.39 |
| F | 0.103 | 0.983 | 567832.54 | −42.79 |
ATF-FTIR Spectroscopy studies
GII, TT and GP oil extracts being organic compound consists of complex molecular configuration and multifunctional organic components. Their chemisorption adsorption properties show they are non-polar and polar with high dipole moments responsible for strong electrostatic attraction and covalent bonding with MS surface. Identification of reactive groups within the complex molecules responsible for corrosion inhibition by the extracts after protonation in H2SO4 media was done through ATF-FTIR spectroscopy and compared with the conventional spectroscopy table [48, 49]. The ATF-FTIR spectra plots for GII/H2SO4, TT/H2SO4 and GP/H2SO4 solutions before and following corrosion test are shown from figures 8(a)–(c). Table 5 shows the peak wavenumbers, transmittance prior to and after corrosion, the respective reactive groups and atomic bonds of the extracts in the electrolyte. The spectra plot in figure 8(b) for TT/ H2SO4 solution show significant decrease in transmittance for the solution after corrosion test at all wavenumbers and disappearance of the functional groups. This signifies adsorption of the reactive groups on the MS surface through chemisorption. The spectra plot in figure 8(a) shows significant increase in transmittance of the spectra peaks at specific wavenumbers where important functional groups are identified for the GII/H2SO4 solution after corrosion test while at wavenumber 732 cm−1, the transmittance is the same before and after corrosion test. This assessment shows that despite the chemisorption adsorption behaviour of the extract from adsorption isotherm studies, modification of the corrosive media played a major role in limiting the diffusion of corrosive anions unto the steel surface. Within the acid solution hydrolysis of the extract results in release of the important functional groups for corrosion inhibition of the steel. Similar observation occurred for GP extract in the acid solution though at different wavenumbers.

Figure 8. ATF-FTIR Spectral plots of (a) GII/H2SO4, (b) TT/ H2SO4 and GP/ H2SO4 solution before and after MS corrosion test.
Download figure:
Standard image High-resolution image
Table 5. TF-FTIR Spectroscopic table for GII/H2SO4, TT/H2SO4 and GP/H2SO4 solution before and after corrosion test.
| GII Extract | ||||
|---|---|---|---|---|
| Wavenumber (cm−1 ) | Transmittance (%) Before Corrosion | Transmittance (%) After Corrosion | Functional groups | Bonds |
| 732 | 47.15 | 47.15 | alkynes, alkenes, primary and secondary amines, aromatics, alkyl alides | –C(triple bond)C–H: C–H bend, =C-H bend, O-H bend N-H wag, C-H 'oop', C-Cl stretch |
| 1160 | 10.56 | 42.3 | alcohols, carboxylic acids, esters, ethers, alkyl halids, aliphatic amines | C–O stretch, C–H wag (–CH2X), C–N stretch |
| 1456 | 30.17 | 44.56 | aromatics, alkanes | C–C stretch (in–ring), C–H bend |
| 1748 | 10.8 | 41.03 | carbonyls (general), carboxylic acids, esters, saturated aliphatic | C = O stretch |
| 2942 | 2.08 | 36.97 | carboxylic acid, alkanes | O = H stretchm C = H stretch |
| TT Extract | ||||
| Wavenumber (cm−1 ) | Transmittance (%) Before Corrosion | Transmittance (%) After Corrosion | Functional groups | Bonds |
| 724 | 25.14 | 4.45 | alkynes, alkenes, primary and secondary amines, aromatics, alkyl alides | –C(triple bond)C–H: C–H bend, =C-H bend, O-H bend N-H wag, C-H 'oop', C-Cl stretch |
| 1176 | 16.9 | 0.24 | alcohols, carboxylic acids, esters, ethers, alkyl halids, aliphatic amines | C–O stretch, C–H wag (–CH2X), C–N stretch |
| 1456 | 19.4 | 0.89 | aromatics, alkanes | C–C stretch (in–ring), C–H bend |
| 1720 | 13.36 | 0.36 | carbonyls (general), carboxylic acids, aldehydes, saturated aliphatic, alpha,beta–unsaturated esters | C = O stretch |
| 2930 | 10.47 | 0.13 | carboxylic acid, alkanes | O = H stretchm C = H stretch |
| GP Extract | ||||
| Wavenumber (cm−1 ) | Transmittance (%) Before Corrosion | Transmittance (%) After Corrosion | Functional groups | Bonds |
| 676 | 54.78 | 61.74 | alkenes, primary and secondary amines, aromatics, alkyl halides, alkynes, alkyl halides | =C–H bend, N–H wag, C–H 'oop', C–Cl stretch, –C(triple bond)C–H: C–H bend, C–Br stretch |
| 1172 | 60.14 | 67.8 | alcohols, carboxylic acids, esters, ethers, alkyl halids, aliphatic amines | C–O stretch, C–H wag (–CH2X), C–N stretch |
| 1630 | 57.64 | 61.82 | primary amines | N–H bend |
| 2950 | 56.34 | 63.54 | carboxylic acid, alkanes | O = H stretch C = H stretch |
| 3458 | 36.44 | 42.01 | alcohols, phenols | O–H stretch, H–bonded |
Conclusion
Ginger (GII), tea tree (TT) and grapefruit (GP) essential oil extracts effectively inhibited mild steel corrosion in dilute H2SO4 solution at all concentrations studied. Inhibition efficiency of the extracts from weight loss measurement was between 92.09%–99.52% for GII, 81.71%–98.17% for TT and 94.71%–96.91% for GP extracts. The corresponding values from potentiodynamic polarization are 90.28%–99.11% for GII, 96.64%–96.65% for TT and 97.33%–99.33% for GP. The extracts significantly decreased the slope of the cathodic polarization plots with increase in concentration of the extracts in the acid solution while the anodic polarization plots were generally similar. Variation in corrosion potential was significantly minimal due to the mixed-inhibition properties of the extracts. Al the lowest extract concentration, TT extract exhibited the most electropositive shift in corrosion potential relative to the plot at 0% extract concentration while at the highest extract concentration, TT and GP extracts were the most electropositive due to effective protection of the steel surface and suppression of the redox electrochemical processes. Comparison of the steel morphology from the acid solution with and without the extracts shows the extracts significantly protected the steel surface from the corrosive action of the anions in the acid solution. The wavelength and transmittance data from ATF-FTIR spectroscopy shows the active functional groups responsible for corrosion inhibitions and their possible mode of inhibition.
Acknowledgments
The author appreciates the financial support of Covenant University towards the successful actualization of this research.
Data availability statement
All data that support the findings of this study are included within the article (and any supplementary files).
Declaration of interest
No conflict of interest exists.