
Abstract
To investigate the physical properties and in vitro biocompatibility of Poly (butylene adipate-co-terephthalate) and Sodium alginate (PBAT/SA) melt blending, as well as feasibility of using PBAT/SA blending materials to fabricate vascular stents through 3D printing technology. PBAT/SA composites were prepared by melt blending, and then related physical properties were assessed through FTIR, SEM, DSC, and water contact angle tests. The effects of the PBAT/SA blend on cell morphology, ROS, apoptosis, and cell proliferation were analyzed in vitro. In addition, we employed a 4-axis 3D printer to evaluate the feasibility of using PBAT/SA blend materials to fabricate vascular stents. We successfully prepared PBAT/SA melt blended materials. FTIR and SEM analyses demonstrated that PBAT and SA were compatible, while DSC data confirmed that the addition of SA improved the thermal properties of PBAT. Besides, water contact angle analysis showed that SA improved the hydrophilicity of PBAT. In addition, we successfully fabricated PBAT/SA vascular stent using 4-axis 3D printing technology. Our data showed that PBAT and SA are compatible, and the addition of SA enhances the thermal properties and hydrophilicity of PBAT. In addition, PBAT/SA blend materials can be fabricated into vascular stents using 4-axis 3D printing technology.
Export citation and abstract BibTeX RIS

Original content from this work may be used under the terms of the Creative Commons Attribution 4.0 licence. Any further distribution of this work must maintain attribution to the author(s) and the title of the work, journal citation and DOI.
1. Introduction
In recent years, the increasing number of coronary heart disease incidents caused by high fat and salt diet, excessive drinking and smoking, obesity, and lack of physical exercise, combined with stroke, heavily threaten human health [1]. Since the world's first percutaneous transluminal coronary angioplasty (PTCA) was performed in 1977, Percutaneous coronary intervention (PCI) has become one of the essential method used in treatment of coronary heart disease [2]. Compared with surgical treatment, PCI is associated with minor trauma, lower intraoperative risk, fast postoperative recovery and fewer complications. However, traditional bare-metal stents (BMS) used in PCI are permanently retained in patients, resulting in adverse reactions such as allergic reactions, in-stent thrombosis, and in-stent restenosis [3]. Emerging biodegradable stents (BDS) are considered the fourth revolutionary medical apparatus in the interventional treatment of coronary heart disease after percutaneous transluminal coronary angioplasty (PTCA), BMS, and drug-eluting stents (DES). Current studies on biodegradable stents mainly focus on degradable metal stents and degradable polymer stents. Degradable metal stents include magnesium alloys [4], iron alloys [5], and zinc alloys [6], while degradable polymer stents include poly (l-lactic acid) (PLLA) [7]. Unfortunately, the degradation rate of degradable metal scaffolds do not match recovery phase of pathological vessels [8],while the degradable PLLA vascular scaffolds have insufficient mechanical strength, lead to thrombosis and in-stent restenosis [9]. Therefore, there is increased research attention towards BDS, especially on improvement of materials and fabrication of vascular stents.
Poly (butylene adipate-co-terephthalate) (PBAT) is an aliphatic-aromatic copolyester prepared from 1, 4-butanediol (BDO), adipic acid (AA), terephthalic acid (PTA), or diol terephthalate (DMT) through direct esterification or transesterification [10]. Compared with most biodegradable polyesters such as poly-lactic acid (PLA) or poly (butyl succinate) (PBS), PBAT has both the flexibility of long methylene chain and tenacity of aromatic ring, with excellent elasticity, similar to low-density polyethylene (LDPE) [11]. Besides, PBAT is suitable for injection molding, extrusion, blow molding and other processing methods. Due to its excellent flexibility and biodegradability, most biomedical researchers use PBAT as a toughening agent for other biodegradable polymers, such as PLA and PBS [12, 13]. However, to date, there are no studies on the application of PBAT in biodegradable vascular stents.
Sodium alginate (SA) is a linear precursor copolymer which lacks a branched chain, which is formed by connection of guluronic acid (G unit) with its stereoisomer mannuronic acid (M unit) through the m-M chain segment, G-G chain segment and M-G chain segment [14]. The US Food and Drug Administration (FDA) defines sodium alginate as 'Generally Regarded As Safe, GRAS.' Many studies have demonstrated that sodium alginate has anti-allergy, immune regulation, anti-oxidation and anti-inflammatory effects [15, 16], and is widely used in tissue engineering, drug sustained-release and wound hemostatic healing [17–19]. However, data on the application of sodium alginate in degradable vascular stents remain scant.
On the other hand, 3D printing technology is a superior tool used in the manufacture of vascular stents and is associated with high efficacy, convenience, and precision. It has been employed in many studies on the manufacture of vascular stents or related fields. FLEGE C et al [20] employed Selective Laser Sintering (SLS) technology to prepare coronary stent prototypes with PLLA and Poly(ε-caprolactone) (PCL) while VAN LITH R et al [21] used citric acid-based polyester to fabricate antioxidant vascular stents with Stereolithography Appearance (SLA) technology. However, the existing 3D printing technology for vascular stents still has certain limitations. Therefore, there is need to improve production of vascular stents with excellent performance through the 3D printing technology.
Given the above, in this study, PBAT was used as the primary material for the degradable vascular stent, which was modified by blending with sodium alginate (SA). We characterized and evaluated in vitro biocompatibility of the PBAT/SA blends. And then we used 4-axis 3D printing technology to explore 3D printing of PBAT/SA degradable vascular stents.
2. Materials and methods
2.1. Materials
Poly (butylene adipate-co-terephthalate) (PBAT), Mn∼120,000, Cas No:55231-08-8 and Sodium Alginate (SA) , CP, viscosity 200 ± 20 mpa.s, Cas No: 9005-38-3 were purchased from Shanghai Macklin Biochemical Technology Co., Ltd (Shanghai, China).
2.2. Preparation of PBAT/SA blends
The PBAT and SA particles were vacuum dried at 60 °C for 24 h. PBAT was placed into a torque rheometer (Hapro torque rheometer RM-200C), melted for 5 min in 160 °C. Following a 9:1 and 8:2 feeding ratio, SA was slowly added to the mixer after complete melting of PBAT. Two materials were constantly mixed at 160 °C, with a rotation speed of 30 rpm for 10 min. After cooling to room temperature, the blended materials were collected and packaged for future use.
2.3. Characterization of the PBAT/SA blends
2.3.1. Fourier-transform infrared spectroscopy (FTIR)
2 mg of PBAT/SA, PBAT, and SA samples were ground in an agate mortar. After addition of 100 mg of ground and dry KBr powder, the mixture was evenly mixed and put into a pressure machine to form 1*1 cm2 flakes. Thereafter, infrared spectroscopy was performed using a Nicolet iN10MX Fourier transform infrared spectrometer (Thermo Fisher Scientific), with a resolution of 4 cm−1 and a scanning range of between 400 and 4000 cm−1.
2.3.2. Scanning electron microscopy (SEM)
The PBAT/SA and PBAT samples were made into dumbbell-shaped splines by mold injection, which was broken after becoming brittle in liquid nitrogen for 1 h, and their cross-sections were intercepted. The surface of the cross-section was sprayed with gold after being vacuum-dried, and then analyzed under a Regulus 8100 field emission scanning electron microscope (Hitachi, Japan).
2.3.3. Differential scanning calorimetry (DSC)
Using a DSC2500 differential scanning calorimeter (DSC; TA Company, United States), 5−10 mg of the vacuum-dried PBAT/SA and PBAT samples were first heated from 40 °C to 200 °C at 10 °C min−1 and then held at 200 °C for 5 min to delete any thermal history. The samples were then cooled from 200 to −50 °C at 10 °C min−1 to yield a cooling (recrystallization) curve, which was held for 5 min. The samples were again heated from −50 °C to 200 °C at 10 °C min−1 to obtain a heating (melting) curve.
2.3.4. Water contact angle
The PBAT/SA and PBAT samples were made into films with a length of 30 mm, a width of 10 mm, and a thickness of 0.2 mm. The PBAT/SA and PBAT contact angle was measured by the theta static contact angle measuring instrument (Biolin Company, Sweden). Distilled water (5 μl) was dropped onto the surface of the sample with a micro-syringe, and then the samples were photographed and measured from the onset to the 10th second. Afterwards, the contact angles at 0 s and 10 s were selected for comparison.
2.4. 4-axis 3D printing of PBAT/SA vascular stent
The self-developed melt extrusion 4-axis 3D printer (developed by 3D printing center, Shanghai ninth people's hospital) was used to fabricate the PBAT/SA degradable vascular stent. During the initial printing process, the PBAT + 20% SA blend material had uneven extrusion with heavy warping, which seriously affected the printing accuracy. 20 g of the vacuum-dried PBAT + 10% SA blend material particles were placed into a 3D printer extrusion barrel with a heating function, and then heated to 170 °C. Once the PBAT + 10% SA blend material came to a molten state, it was extruded at a uniform speed of 3 mm s−1. A controllable rotating shaft (A-axis) device was then introduced to rotate synchronously (3 mm s−1) to receive the extruded material, which was then stacked layer by layer according to the printing path to form a vascular stent-like tube network structure [22]. The printing parameters included: nozzle diameter: 0.3 mm, nozzle pressure: 0.27 Mpa, printing thickness: 0.15 mm, number of printing layers: 4, mesh interval 0.8, stent inner diameter 5 mm, stent length: 50 mm.
2.5. In vitro cytocompatibility of the PBAT/SA blends
2.5.1. Preparation of cell culture and PBAT/SA extract
Cell culture: NIH/3T3 cell line was purchased from Wuhan Proceeds Life Technology Co., Ltd The cells were cultured in a DMEM high-glucose medium containing 1% penicillin/streptomycin (Beijing Soleibo Technology Co., Ltd, Beijing, China.) and 10% calf serum (Zhejiang Tianhang Biotechnology Co., Ltd, Hangzhou, China), in 5% CO2 volume fraction and saturated humidity. At a cell density of 80%-90% per dish, the cells were digested with 0.25% trypsin (Gibco) at 37 °C, and then the detached cells were collected after centrifugation. The cells were washed in PBS buffer (Beijing Soco Laybold Technology Co., Ltd, Beijing, China.) and then centrifuged again to remove the supernatant. The collected cells were resuspended in a DMEM medium at a density of 1 × 10⁵ cells/culture dish (Corning, USA) and then put into a new culture dish. The cells were put in an incubator and grown to a density of 60%–70% for subsequent experiments.
The PBAT/SA blended material samples were 3D printed into disks with a diameter of 10 mm and a thickness of 0.2 mm, and then sterilized using ethylene oxide. Thereafter, the material membrane was immersed in the extract containing serum-free DMEM medium. After a break of 72 h at 37 °C, the extract was collected in a syringe and placed in a centrifuge tube at 1000 r min−1 for 5 min. The leach liquor was then filtered with a 0.22 μm membrane to remove impurities and then sterilized before collection of the filtrate, which was kept at −80 °C for subsequent use.
2.5.2. Cell morphology
The 3T3 cells which were co-cultured with PBAT/SA blend material extract for 24 h were washed twice with PBS, fixed with 4% paraformaldehyde for 10 min, and then washed three times with PBS. The cells were permeabilized with 2% BSA in PBS (Beijing Soleibao Technology Co., Ltd) for10 minutes, and then washed three times with PBS. The cells were stained with diluted Phalloidin-iFluor 555 antibody (ab176756, Abcam, USA). In addition, protein microfilaments (f-actin) were stained and incubated at 37 °Cfor 60 min. Thereafter, they were washed three times with PBS and then mounted with DAPI (Beijing Soleibo Technology Co., Ltd). The cell morphology was analyzed under an inverted fluorescence microscope (Nikon, Japan).
2.5.3. Reactive oxygen species
The production of reactive oxygen species (ROS) was detected using a ROS detection kit (Beyotime, S0033S). The 3T3 cells which were co-cultured with the material extraction solution for 24 h were washed twice with PBS, and the diluted fluorescent probe DCFH-DA (10 μmol l)−1 was added to cover and protect the cells from light. The cells were incubated at 37 °C for 20 min and then washed three times with a serum-free cell culture medium to remove extracellular DCFH-DA. The cells were digested with 0.25% trypsin (Gibco), and then the supernatant was discarded by centrifugation. The cells were washed twice in PBS and analyzed. Positive cells on the FITC channel were analyzed by a flow cytometer (CytoFlex S, Beckman, USA).
2.5.4. Apoptosis rate
The rate of apoptosis was analyzed using Annexin V-FITC Apoptosis Detection Kit (Beyotime, C1062S). The 3T3 cells co-cultured with the material extract for 24 h were digested with 0.25% trypsin without EDTA, centrifuged at 4 °C for 5 min and then washed twice with pre-cooled PBS. The cells were collected, and then resuspended in staining buffer. We adjusted the cell concentration to 3 × 10⁵ cells ml−1 before addition of 5 μl Annexin V-FITC and 10 μl PI. The sample was mixed gently, incubated at room temperature and in darkness for 15 min. Thereafter, 400 μl staining buffer was added to the samples on ice and then mixed thoroughly. The degree of apoptosis in each group was assessed by flow cytometry within 5 min.
2.5.5. Cell Counting Kit-8
NIH/3T3 cells in the logarithmic growth phase were collected, counted and then seeded in a 96-well plate (Corning, USA) at a density of 5,000 cells/well. The cells were incubated for 24 h at 37 °C under 5% CO2. Thereafter, 10 μl of CCK-8 solution was added to each well and then incubated at 37 °C for 2 h. Absorbance of the samples was measured at 450 nm with a microplate reader and then used to analyze cell proliferation. 2.6 Statistics.
The data were presented as means with standard deviations (M ± SD). The statistical significance of the differences between the control and treatment groups was determined by Student t test using GraphPad Prism Version 9.0 (GraphPad Software, San Diego, California, USA). A P < 0.05 was considered statistically significant.
3. Results and discussion
3.1. Characterization of PBAT/SA Blends
3.1.1. Fourier-transform infrared spectroscopy.
As shown in figure 1, we defined the FTIR spectra of SA, PBAT, PBAT + 10%SA, and PBAT + 20%SA. The infrared characteristic peaks of SA (figure 1(a)) were 3265 cm−1 for the −OH stretching vibration, 1611 cm−1, and 1416 cm−1 were the asymmetric and symmetrical stretching vibrations of –COO–, respectively, and 1022 cm−1 was the CH in-plane bending vibration [23]. On the other hand, the infrared characteristic peaks of PBAT (figure 1(b)) were 2952 cm−1 for the antisymmetric stretching vibration of CH2, 1711 cm−1 was the C=O stretching vibration, while 1254 cm−1 was the C–O–C stretching vibration in the aromatic ester. π–π shows conjugation with the benzene ring, and the =CH out-of-plane vibrational frequency was reduced to 726 cm−1 [24]. In addition, the FTIR spectra of PBAT/SA blends prepared by addition of different amounts of SA (figures 1(c) and (d)) were comparable to those of pure PBAT (figure 1(b)). The frequencies: 2952 cm−1, 1711 cm−1, 1254 cm−1 and 726 cm−1 correspond to the characteristic peaks of pure PBAT matrix. Our data showed characteristic absorption peaks (–OH stretching vibration) belonging to SA at 3265 cm−1, which indicate that SA was successfully incorporated into the PBAT matrix, and the melt blending of PBAT and SA was homogeneously.
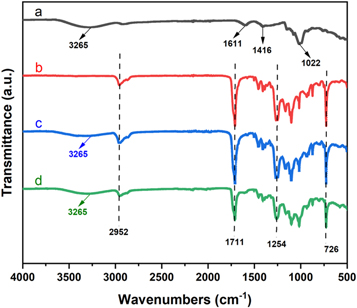
Figure 1. FTIR spectra for SA (a), PBAT (b), PBAT + 10%SA (c) and PBAT + 20%SA (d).
Download figure:
Standard image High-resolution image3.1.2. Scanning electron microscopy
SEM was performed to assess the dispersion of SA in the PBAT matrix. As shown in figure 2, the microstructure of the fracture surface of pure PBAT and two PBAT/SA blends with different SA contents. The fracture surface of PBAT (figures 2(a)–(c)) was relatively flat and smooth, while addition of the SA exerted significant changes to the fracture surface of the PBAT/SA blend material. The PBAT + 10%SA blend material had a typical 'sea-island structure' (figures 2(d)–(f)). Most of the fracture surface of the blend material was still flat, and a small part of the blended material formed aggregates. This shows that the SA have been dispersed within the matrix homogeneously, which was consistent with our FTIR data. The homogeneously of the two is because of the high shear force applied during melt blending, which promotes uniform dispersion of SA in the PBAT matrix. In addition, the homogeneously may also be attributed to events during the melt blending process, where the hydrogen bonds of SA molecules are opened to form new bonds with the PBAT matrix, thus enhancing homogeneously between the two. However, aggregation and heterogeneous dispersion of highly hydrophilic SA in the hydrophobic PBAT matrix are inevitable. Our analysis showed gradual increase in the size of the dispersed phase, the grooves and voids (figures 2(g)–(i)). This is because of the increase in the intermolecular force of SA with the increase in the SA content. Besides, the shear force generated during melt blending is not enough to uniformly disperse the SA in the PBAT matrix. When the SA content increased to 20%, its size dispersed phase matrix in the PBAT matrix increased significantly, and yielded a rough cross-section, which indicates that high SA content leads to declined homogeneously of the SA and PBAT matrix.
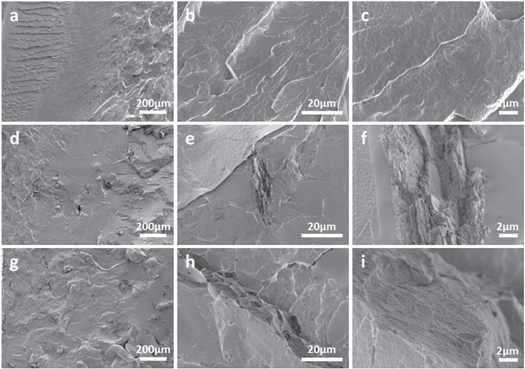
Figure 2. SEM images of the fracture surfaces of pure PBAT (a), (b), (c) and two PBAT/SA blends: PBAT + 10%SA (d), (e), (f) and PBAT + 20%SA (g), (h), (i).
Download figure:
Standard image High-resolution image3.1.3. Differential scanning calorimetry
The cooling and quadratic heating curves of pure PBAT and PBAT/SA blends were used to analyze the crystallization and melting behaviors of the materials, respectively (figures 3(A) and (B)). We analyzed the primary DSC data, which included crystallization temperature (Tc), melting temperature (Tm), crystallinity (χc), melting enthalpy (ΔHm) and crystallization enthalpy (ΔHc) (table 1). The formula for calculation of sample crystallinity (χc) was: χc = ΔHm/(1-Wt)ΔH0 × 100% [25]; where, Wt is the mass fraction of SA, and ΔH0 is the melting enthalpy of 100% crystalline PBAT, 114 J g−1 [26]. Our data showed that with the increase in the SA content, the crystallization curve of the PBAT/SA blend material moves to the high-temperature direction, indicating that the addition of SA had a heterogeneous nucleation effect [27]. On the other hand, the melting temperature of PBAT increased with the addition of SA, while the thermal properties of PBAT were improved. In contrast, there was decrease in the melting enthalpy (ΔHm) and crystallinity (χc), which may be because of the increase in the SA content decreased the intermolecular hydrogen bonding between PBAT molecular chains [28]. The uneven dispersion of the SA matrix led to the appearance and increased agglomeration in the PBAT matrix, which hinders the PBAT/SA blending. In addition, our DSC data showed that the peak shapes of the crystallization and the melting peak did not significantly change, which demonstrates that the addition of SA did not affect the crystalline phase of PBAT. Besides, the chemical reaction with PBAT did not change the internal structure of the molecule.

Figure 3. DSC cooling (recrystallization) curve (a) and heating (melting) curve (b) for pure PBAT and two PBAT/SA blends.
Download figure:
Standard image High-resolution imageTable 1. Summarized thermal parameters for pure PBAT and two PBAT/SA blends obtained from DSC analysis.
| Name | Tm(°C) | △Hm(J g)−1 | Tc(°C) | △Hc(J g)−1 | χc |
|---|---|---|---|---|---|
| PBAT | 123.79 | 20.969 | 47.98 | 23.236 | 18.4 |
| PBAT + 10%SA | 126.22 | 13.776 | 78.23 | 18.094 | 12.08 |
| PBAT + 20%SA | 126.47 | 9.549 | 77.51 | 14 | 8.3 |
3.1.4. Water contact angle
The effect of the addition of SA on the surface wetting properties of PBAT/SA blends were also analyzed (figure 4). The data shows that the addition of SA reduces the water contact angle of PBAT, while increase of the SA content led to significant decrease of the composite contact angle. This phenomenon was associated with the fact that SA is a natural polymer with many –COO– and –OH structures, which offers strong hydrophilicity [29]. After melt blending with PBAT, SA was dispersed in the blend material leading to increased hydrophilicity, which is beneficial to the adhesion and growth of cells.
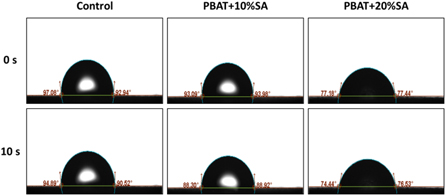
Figure 4. Water contact angle for pure PBAT and two PBAT/SA blends.
Download figure:
Standard image High-resolution image3.2. 3D printing of PBAT/SA vascular stents
PBAT is an aliphatic-aromatic copolyester with both aliphatic degradability and excellent aromatic mechanical properties. Some studies have successfully employed 3D printing of PBAT [30, 31]. Other studies have also demonstrated the 3D printing properties of SA, which has been widely used in the 3D printing of biological materials [32]. As shown in figure 5, we successfully printed the vascular stent of PBAT/SA blend material using 4-axis 3D printing technology, confirming the 3D printability of the PBAT/SA blend material.

Figure 5. The overall effect and size data of 3D printed PBAT/SA vascular stents: (a) the overall effect of 3D printed PBAT/SA vascular stents, (b) the vascular stent length: 40 mm, (c) inner diameter: 5.12 mm, (d) thickness: 0.6 mm.
Download figure:
Standard image High-resolution image3.3. In vitro cytocompatibility of the PBAT/SA blends
3.3.1. Cell morphology
Phalloidin can specifically bind to F-actin of eukaryotic cells, thereby displaying the microfilament skeleton of cells. The mounting medium containing DAPI can specifically stain cell nuclei, and the images of phalloidin staining and DAPI staining can be superimposed to confirm the location of the cell nucleus and further observe the cell morphology. As shown in figure 6, microscopic analysis showed no significant difference in the cell morphology between the cells co-cultured with the PBAT/SA blend material extract and the control group. This data demonstrated that the cells were evenly distributed, and the number was not significant. In addition, the cells were fibrous, the nuclei were intact, and no prominent mitotic figures were present, indicating that the PBAT/SA blend material does not affect the cell morphology of 3T3 cells.

Figure 6. The overall effect and size data of 3D printed PBAT/SA vascular stents: (a) the overall effect of 3D printed PBAT/SA vascular stents, (b) the vascular stent length: 40 mm, (c) inner diameter: 5.12 mm, (d) thickness: 0.6 mm.
Download figure:
Standard image High-resolution image3.3.2. Reactive oxygen species, apoptosis rate and cell counting kit-8 tests
ROS, a direct indicator of the level of cellular oxidative stress, is formed by reducing nicotinamide adenine dinucleotide phosphate (NADPH) oxidase, lipoxygenase, or cyclooxygenase. High levels of ROS can cause redox state imbalance and damage to cellular DNA, lipids, and proteins [33]. The ROS probe DCFH-DA is hydrolyzed into DCFH after entering the cell, and the intracellular ROS oxidizes DCFH to emit fluorescence. Therefore, the intracellular ROS level is proportional to the fluorescence intensity. The fluorescence signal as a result of ROS production in cells was detected by flow cytometry. Our data showed that there was no statistical difference in the ROS level between the 3T3 cells co-cultured with the material extract and the control group (P > 0.05) (figure 7(a)), showing that the PBAT/SA blend material does not cause oxidative damage to cells. In addition, we analyzed the degree of apoptosis in cells by flow cytometry using Annexin V and PI double staining. Similarly, our data showed that there was no statistical difference in the rate of apoptosis between the PBAT/SA blend material group and the control group (P > 0.05) (figure 7(b)). This data showed that the PBAT/SA blend material did not affect apoptosis in cells. The effect of PBAT/SA blend material on cell proliferation was analyzed by evaluating the absorbance of cells after co-incubation with CCK-8. As shown in figure 7(c), there was no statistical difference in the absorbance P > 0.05. Together, these data demonstrates that the PBAT/SA blend material does not affect proliferation of cells.

Figure 7. In vitro cytocompatibility of PBAT/SA blends tested by (a) ROS detection, (b) cell apoptosis and (c) CCK-8 assay. ns stands for nonsignificant.
Download figure:
Standard image High-resolution image
Previous studies have shown that pure PBAT has good biocompatibility [34, 35]. Jao et al [36] used the Bicinchoninic acid (BCA) and MTT assay to show that PBAT did not inhibit cell proliferation and there was no cytotoxicity at L929 fibroblasts. Similarly, Aline et al [37] performed the MTT assay and showed that PBAT was not toxic to MG-63 cells, and PBAT could promote the reconstruction of alveolar bone defects. As described previously, SA is widely used in the field of biomaterials due to its excellent biocompatibility. It is used in drug release materials, living cells and bioactive protein delivery media, wound dressings, bone, and cartilage repair materials [17–19, 38]. Our analysis has demonstrated that melt blending PBAT and SA does not produce new species. Therefore, the product obtained after melt blending of PBAT and SA has good biocompatibility.
4. Conclusion
In this study, we demonstrated that PBAT and SA have sufficient compatibility, and their blending does not yield new substances. At the same time, although the addition of SA improves the thermal properties and hydrophilicity of PBAT, excess SA leads to decreased crystallinity of the PBAT. In addition, the biocompatibility assays demonstrated that the blending of PBAT and SA would not affect cell morphology, apoptosis, ROS, and cell proliferation, and the PBAT/SA blend material had good biocompatibility. Finally, we confirmed the 3D printability of the PBAT/SA blend material by 4-axis 3D printing technology.
Acknowledgments
This work was supported by National Natural Science Foundation of China (Grant No. 81570287).
Data availability statement
No new data were created or analysed in this study.