

Abstract
In order to study the conductive and microwave absorption performance of multi-dimensional multiphase filler conductive foam composites, carbon nanotubes (CNTs)/carbon black (CB)/polymethyl methacrylate (PMMA) nanocomposites with different porosity were fabricated via supercritical carbon dioxide (ScCO2) one-step physical constraint foaming technology. The effects of filler component and porosity on the conductivity and absorbing properties of CNTs/PMMA/CB composite foam were studied. The Monte-Carlo method was used to study the percolation of composites and the effect of introduced microcells on the conductive network of multi-dimensional fillers. The results revealed that the volume conductivity of CNTs(3 vol%)/PMMA composites increased from 0.88 S m−1 to 3.31 S m−1 after the addition of 1 vol% CB. CNTs and CB had obvious synergistic effect on improving the conductivity of the composites, and the microwave absorption efficiency rose from 12.6 dB to 17.2 dB. With the increase of porosity, the electromagnetic wave absorption peak of CNTs/CB/PMMA composite foam moved to low frequency, while the conductivity showed a first rise and then a decline. The simulated percolation probability obtained by representative volume element (RVE) with different porosity also showed a similar trend, which turned out that with the increase of porosity, the effect of microcells on the convertion of conductive network construction from promoting to inhibiting.
Export citation and abstract BibTeX RIS

Original content from this work may be used under the terms of the Creative Commons Attribution 4.0 licence. Any further distribution of this work must maintain attribution to the author(s) and the title of the work, journal citation and DOI.
1. Introduction
With the vigorous development of the 5G technology and the increasing range of personal electronic communications equipment, the electromagnetic disturbance produced by electronic equipment running in life are increasingly serious, which results in inevitable impact on normal operation of precision electronic equipment and human health [1–3]. The application of electromagnetic wave absorption material before designing an electronic device is one of the main technical means to suppress their own electromagnetic radiation and reduce external electromagnetic pollution [4–6]. Compared with traditional metals, conductive polymer composites (CPCs) obtain excellent characteristics of low density, corrosion resistance and oxidation resistance besides good electrical conductivity, thus being widely studied in electromagnetic wave absorption at present [7–9].
The preparation of traditional CPCs often requires the addition of high content of conductive filler, which increases the processing difficulty and production cost as well as the reduction of mechanical properties of materials [10]. Polymer/carbon filler foamed conductive composite (PCFC), with extremely low percolation threshold, good impedance matching characteristics and accurately adjustable cellular structure, has gradually become the future prospect of electromagnetic absorbing material [11, 12].
The introduction of microcells makes the filler selectively distributed in the cell wall to promote the conductivity and absorption performance of PCFC. Tran et al [13] prepared CNTs/PMMA nanocomposites by melting blending and supercritical carbon dioxide (ScCO2) intermittent foaming method. The influence of foaming conditions on the cell morphology (cell size, cell density and wall thickness) was studied, and it was found that the percolation threshold of composites was significantly reduced after foaming. Li et al [14] prepared CNTs/PMMA foam composites with percolation threshold as low as 0.019 vol%, and found the electrical conductivity and electromagnetic absorption efficiency reached 3.19 S m−1 and 35.9 dB, respectively, when 5 wt% CNTs were added. The filler geometry also had a certain influence on the conductivity of composites. Yuan et al [15] found that after adding shorter CNTs, the composite foam had higher conductivity, which was attributed to the fact that short CNTs were difficult to be stretched and broken by cells, and could be well dispersed in cell walls and cell edges.Porosity had a great influence on the conductivity of composites. Wang et al [16, 17] constructed RVE model to simulate the percolation behavior and conductivity of polymer based conductive foam composites based on Monte Carlo method and cell growth-fiber motion governing equation. They found that the effect of cells on the percolation conductivity of composites changed from promotion to inhibition with the growth of cells, and verified it in experiments.
In recent years, the cooperative percolation conductivity of multi-dimensional multiphase fillers has also been extensively studied. Li [18] prepared CNTs/CB/polyvinylidene fluoride (PVDF) nanocomposites by melting blending method, and found that the addition of CB greatly improved the conductivity of the composites and reduced the percolation threshold. Duan et al [19] systematically studied the effect of CNTs size on the conductivity and electromagnetic interference shielding performance of polymer conductive foam by adding 1D CNTs and 0D CB to nickel-coated carbon fiber (NCCF)/epoxy resin (EP) blend foam to build a cooperative conductive network. Chen et al [20] established the three-dimensional RVE model of CB-CNTs hybrid filler and found the non-linear relationship between the volume fraction of CNTs and CB and the percolation probability, which resembled the cooperative percolation law observed in the experiment.
In this paper, CNTs/CB/PMMA composite foams with different porosity were fabricated by melting blending/one-step physical constraint foaming technology. The effects of the ratio of multi-dimensional carbon fillers (CNTs and CB) and foaming process on the microstructure of the composite foams were studied by scanning electronical microscope (SEM). The conductive and electromagnetic absorption performance of composite foams were analyzed using high precision resistance meter and vector network analyzer. The percolation behavior of foamed composites was simulated by Monte Carlo method. The synergistic effect of multi-dimensional fillers in constructing conductive network and forming percolation path was investigated.
2. Materials and methods
2.1. Raw materials
Multi-walled Carbon nanotubes (MWCNTs) : TNGM3, density = 1.4 g cm−3, Chengdu Organic Chemistry Co., Ltd; Polymethyl methacrylate (PMMA) : Mw = 300000, density = 1.19 g cm−3, Jiangsu Nantong Liyang Chemical Co., Ltd; Nano carbon black: XFL15, density = 1.83 g cm−3, XFNANO; Liquid CO2 (purity 99.99%): Wuhan Xiangyun Gas Co. Ltd.
2.2. Preparation of PMMA/CNT/CB foam composites
The process of preparing composite materials is shown in figure 1. Firstly, DZF-6020AB vacuum dryer is used to dry the experimental materials at 80 °C for 24 h, and the experimental materials with different volume fraction ratio were fused and mixed in XSS-300 totally enclosed mixing mill. The conditions of mixing are 210 °C, 60 rpm and 30 min. The specific configuration is shown in table 1. Secondly, the solid sample with thickness of 1 mm was obtained by hot processing the mixture at 170 °C and 20 MPa for 40 min. Finally,the physical constraint foaming process was the same as in [21]. According to previous studies, when the temperature and pressure are respectively increased, the excessive increase of the size or density of the bubbles leads to the collapse and merger of the obvious bubbles, which destroys the structure of the cell walls [22]. In this study, the experimental design of simultaneous increase of temperature and pressure was adopted, and this design idea also appeared in Ref [17]. Since the diffusion rate of ScCO2 in the polymer decreased with the decrease of temperature and pressure, we increased the adsorption time at lower temperature and pressure [23]. Foamed samples with different porosity (ζ) were gained by adopting variouprocess parameters shown in table 2.where wt,vol and ρ are the mass fraction, volume fraction and density of the material respectively, and i represents different components.

Figure 1. The schematic diagram of preparation of CNTs/CB/PMMA foamed composites.
Download figure:
Standard image High-resolution imageTable 1. Component content of CNTs/CB/PMMA composites.
| Sample | PMMA/vol% | CNTs/vol% | CB/vol% |
|---|---|---|---|
| CNTs/PMMA1 | 98 | 2 | 0 |
| CNTs/PMMA2 | 97.5 | 2.5 | 0 |
| CNTs/PMMA3 | 97 | 3 | 0 |
| CNTs/PMMA4 | 96.5 | 3.5 | 0 |
| CNTs/PMMA5 | 96 | 4 | 0 |
| CNTs/PMMA-CB1 | 98 | 1 | 1 |
| CNTs/PMMA-CB2 | 97.5 | 1.5 | 1 |
| CNTs/PMMA-CB3 | 97 | 2 | 1 |
| CNTs/PMMA-CB4 | 96.5 | 2.5 | 1 |
| CNTs/PMMA-CB5 | 96 | 3 | 1 |
Note: The mass fraction of each component in the experiment was calculated by equation (1).
Table 2. Process parameters of CNTs/CB/PMMA composites adsorption of ScCO2.
| Temperature/°C | Pressure/MPa | Adsorption time/h | Constraint thickness/mm | |
|---|---|---|---|---|
| A | 50 | 12 | 11 | 1.1 mm(ζ = 0.24) |
| B | 60 | 13 | 10 | 1.2 mm(ζ = 0.42) |
| C | 70 | 14.5 | 9 | 1.3 mm(ζ = 0.54) |
| D | 80 | 16 | 8 | 1.4 mm(ζ = 0.63) |
2.3. Material characterization
Dielectric performance test: vector network analyzer (N5230A, Agilent Technology Co., Ltd) was used to test the dielectric constant and dielectric loss of the material, and the test frequency range was X-band: 8.2–12.4 GHz.The sample size was 22.9 mm × 10.2 mm × 1 mm, and the sample to be tested was placed in the waveguide fixture for testing. Electromagnetic absorption efficiency calculation: the reflection coefficient RL of the material is used to represent the absorption efficiency A of the electromagnetic wave of the material. The relationship between the reflection coefficient and the absorption efficiency of the electromagnetic wave is shown in equation (2) as follows:

According to the transmission line principle, the reflection coefficient of the vertically incident electromagnetic wave of the material can be calculated by equations (3)–(5) as follows [24]:


where Zm is the complex impedance of the composite material, and Z0 is the complex impedance of the vacuum environment. μ0 and ε0 are vacuum permeability and dielectric constant respectively. εm and μm are the permeability and dielectric constant of the composites. f is the incident frequency of electromagnetic wave, c is the speed of light under vacuum condition, and d is the thickness of material.
Micromorphology characterization: the samples were cooled in liquid nitrogen and then snapped quickly,and the fracture was treated with platinum injection. SEM (Quanta FEG 250, FEI Company, USA) was used to analyze the microstructure of the foamed composite. Image J was used to calculate the diameter distribution of bubble holes in composite materials, and the density of bubble holes was calculated by equation (6) as follows [25].

where, N is the density of bubbles, n is the number of bubbles in SEM photos, S is the area of FESEM photos, and M is the magnification factor of samples taken.
Conductivity testing: A specimen is coated with conductive silver adhesive and sealed with conductive tape to reduce contact resistance. A digital multimeter is used to measure direct resistance of composite at room temperature. Equation (7) is used to calculate its conductivity.

where σ is the volume conductivity,B is the cross-sectional area of the sample, l is the length of the sample, and R is the resistance of the sample measured.
3. Theoretical estimation
3.1. Basic RVE generation
In CPCs, with the increase of the content of conductive filler (particles, fibers), the composite will suddenly change from insulator to conductor, which is called percolation phenomenon, and the content of filler at this time is called percolation content. Strictly speaking, the content of filler forming an infinite group in an infinite (thermodynamic finite) system is called percolation content, but the existing numerical calculation method cannot study of infinite system. So the introduction of the RVE model and Monte Carlo method two kinds of means to percolation behavior of polymer-based conductive composites were studied. Firstly, Mont Carlo method was used to randomly generate conductive fillers in the polymer matrix as RVE, so as to reproduce the distribution of fillers at the micro level of the composite material and for subsequent percolation detection. The RVE framework is shown in figure 2(a).
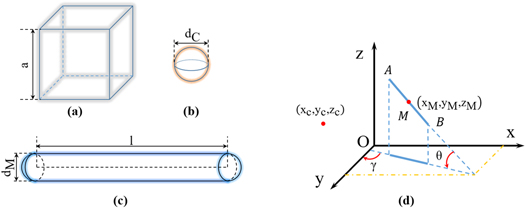
Figure 2. Basic composition of composite RVE and packing positioning method: (a) cube RVE; (b) particle filler (0 D); (c) fiber filler (1 D); (d) filler location in Cartesian coordinate system.
Download figure:
Standard image High-resolution imageMicron - or nano-sized conductive fillers in polymer substrates, such as CNTs and stainless steel fibers , are coiled or entangled, while some other fillers, such as carbon fiber (CF) and glass fiber(GF), are kept straight and unbent. In order to simplify the model calculation and improve the universality of the model, the fiber conductive filler was assumed to be a straight rigid body connected by hemispheres at both ends in figure 2(c), and the particle filler was assumed to be a sphere as shown in figure 2(b). Based on the above assumptions, the two types of fillers can be easily located in cartesian coordinate system. For particle fillers, their spherical coordinates (xC, yC, zC) can be located. As for the fiber fillers, its length l, midpoint coordinates (xM, yM, zM), angle θ with the xy plane and angle γ with the y axis should be known before it can be located, as shown in figure 2(d). In the subsequent simulation, the random algorithm corresponding to equations (8)–(10) is used to generate CB and CNTs in RVE, and the volume fraction of filler is calculated using equation (11) as follow.


where rand is a random function used to generate random numbers between [0, 1]. When θmax = π/2, the fiber filler is randomly dispersed, and when θmax = 0, the packing is completely aligned.φC and φM are the volume fraction of particle packing and rod packing respectively, and NC and NM are the number of particle packing and rod packing respectively. ζ is the porosity of the composite, ζ = 0 for the solid RVE.
3.2. Filler intersection detection
The detection object of percolation algorithm is a filler group composed of a single conductive filler connected to each other. If the filler group can make the two opposite surfaces of the RVE conduct, the RVE percolates. Therefore, the connectivity detection between fillers is the basis of percolation algorithm. When RVE contains both fiber filler (one-dimensional) and particle filler (zero-dimensional), the detection of the filler connection is shown in figure 3. For CNTs and CB, the minimum distance of tunneling current generated by electron transfer can not exceed the minimum Vander Waals distance (ξ = 0.34 nm) between carbon layers. Therefore, in this study, if the shortest distance between the fillers is less than ξ, there is a current transfer between the fillers, and the fillers can be regarded as interconnected. The calculation of the shortest distance of filler can be simplified as line-to-line shortest distance [26], point-to-line shortest distance and point-to-point distance in three-dimensional space, and the specific calculation method will not be described again.
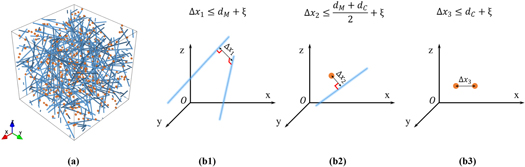
Figure 3. Intersection detection between conductive fillers: (a) multiphase filler RVE; (b1) CNTs ands CNTs; (b2) CNTs and CB; (b3) CB and CB.
Download figure:
Standard image High-resolution image3.3. Formation and percolation detection of RVE with cell
Periodic boundary conditions were applied to the RVE boundary to prevent filler loss in the simulation process and reduce the influence of size effect on perosmotic probability results [27]. The generated solid RVE is shown in figure 4(a), and the same color means that the filler is in the same group.The cell is introduced into the center of cube RVE, and the position relationship between the CNTs and the cell is determined by the distance Rm from the CNTs midpoint to the center of the cell and the angle α0 between the fiber midpoint and the center of the bubble hole. During the growth of the cell, the movement of the surrounding CNTs can be divided into translation and rotation.According to the equations (12)–(16) of cell growth-CNTs movement [28] and extended to three-dimensional space [16, 17], displacement dx and rotation angle dα were obtained, and fibers in solid RVE were repositioned to obtain foam RVE as shown in figure 4(b).


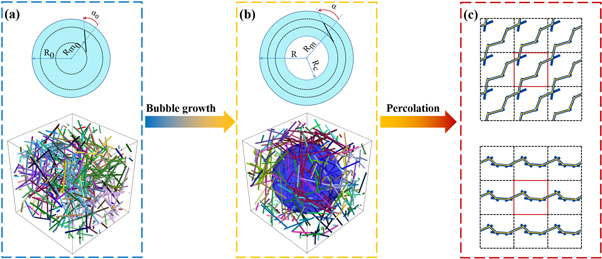
Figure 4. RVE establishment and periodic percolation determination of composite materials: (a) unfoamed solid RVE; (b) foam RVE; (c) two percolation tests.
Download figure:
Standard image High-resolution imageFor the CB in RVE, its position can be expressed only by spherical coordinates, and its spherical coordinates change when the cell grows up, which can be calculated by using the motion equation (12).
In order to avoid overestimation of percolation probability and weaken the influence of RVE size on percolation results [29]. Periodic percolation determination method is adopted in this paper, that is, only when the filler network achieves continuous percolation in periodic RVE, the filler network can be judged as percolation network, and its determination principle is shown in figure 4(c).
According to previous studies, the percolation threshold of CNTs is much lower than that of CB, that is, CNTs plays a dominant role in the construction of filler network [10, 18]. So the percolation of CNTs is mainly detected when Monte Carlo method is used for percolation simulation, and CB is used as a 'bridge' connecting CNTs as a component of filler group. Therefore, the simulation method of adding all CB at one time and adding CNTs gradually was adopted to obtain the percolation content of CNTs under the fixed CB content, as shown in figure 5.
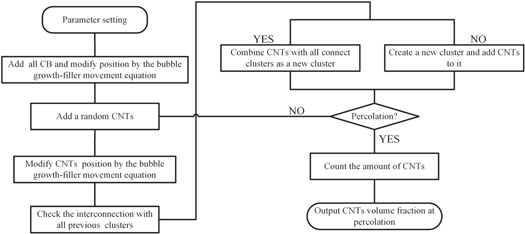
Figure 5. Program flowchart for Monte Carlo simulation.
Download figure:
Standard image High-resolution image3.4. Percolation simulation post-treatment method
Strictly speaking, the percolation threshold of composite is defined as the volume fraction of filler when forming an infinite spanning network in an infinite system. When the volume fraction of filler is larger than φp, the probability of forming an infinite filler network is 1; otherwise, the probability is 0. Therefore, the percolation threshold in an infinite system is certain. For systems of finite area and volume, such as RVE for experimental materials and simulations, the percolation threshold is probabilistic. In order to calculate a strictly defined percolation threshold for a finite size system, the threshold needs to be extrapolated to an infinite system based on finite size scaling theory. The method adopted in this paper is to estimate the percolation threshold of the infinite system by using the cumulative distribution function (CDF) fitting of the percolation data of finite size RVE. First of all, according to a certain content of filler RVE all accounts for more than the proportion of permeability RVE to preliminary estimate of its more than permeability probability, in order to determine more than threshold, all more than permeability in the simulation of RVE statistics and filler volume fraction of the normal inspection, on the basis of the mean normal fitting for μ and the standard deviation σ, μ is percolation threshold, as shown in figure 6(a). Equation (17) is used to determine the cumulative distribution function of percolation probability P and packing volume fraction φ, as shown in figure 6(b). After the percolation threshold is obtained, the volumetric conductivity of the composite can be obtained by fitting with equation (18), as shown in figure 6(c) [30].


where, erf is the Gaussian error function, σ is the composite material volume conductivity, σ0 packing volume conductivity, 4.84 S/m for CNTs, φ is the packing volume fraction, φC is the percolation threshold of the corresponding packing, t is the critical index, 2.18 for CNTs composite material [31].
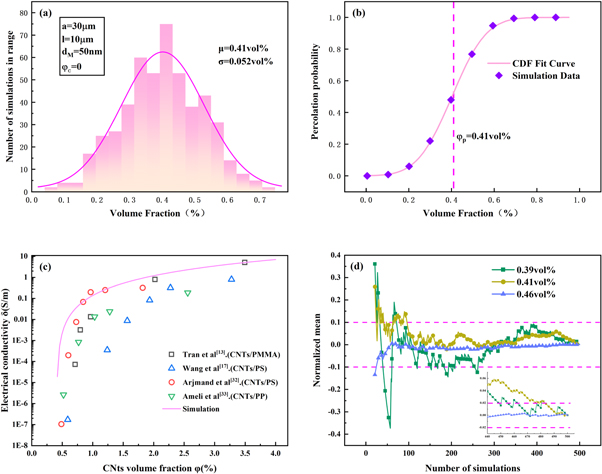
Figure 6. Post-treatment of percolation simulation results: (a) histogram of percolation filler content; (b) percolation probability cumulative distribution function fitting; (c) volume conductivity fitting; (d) convergence detection of Percolation probability.
Download figure:
Standard image High-resolution imageAs percolation threshold of finite system is probabilistic, convergence test should be conducted on percolation probability obtained by Monte Carlo simulation, as shown in figure 6(d), all calculated values after 260 simulation are within 90% of 500 simulation values, and all calculated values after 480 simulation are within 98% of 500 simulation values. Moreover, with the increase of packing volume fraction, the convergence of percolation probability is better. The calculated value of percolation probability of RVE with packing content of 0.35 vol% after 100 simulations is within 99% of the value of 500 simulations. In order to ensure the accuracy of results, all percolation simulation cycles in this paper are set to 500.
4. Results and discussion
4.1. Microstructure of CNTs/CB/PMMA foam composites
As shown in figure 7, CNTs were well dispersed in the PMMA matrix without obvious agglomeration. The foamed material had uniform cellular structure and all had obturator cell structure.With the increase of the content of CNTs from 2 vol% to 4 vol% and the density of bubbles from 1.04 × 10⁶ cells/cm3 to 4.19 × 10⁶ cells/cm3, the heterogeneous nucleation of CNTs is obvious. The mesh structure formed by the lapping of CNTs increased the stiffness of the composite material, and the total amount of CO2 absorbed by PMMA is limited, resulting in the decrease of the diameter of the cell from 5.42 μm to 3.75 μm.As shown in figure 8, with the addition of 1 vol%CB, the change trend of cell structure was the same as that of CNTs/PMMA foam with the increase of CNTs content. The density of cell increased from 1.57 × 10⁶ cells/cm3 to 3.63 × 10⁶ cells/cm3, and the diameter of cell decreased from 5.66 μm to 3.97 μm. On the other hand, the foam density of CNTs/CB/PMMA foam composites was not significantly higher than that of CNTs/PMMA foam composites. When the total filler content was kept unchanged, the foam density was lower when the filler content was higher, because it was difficult to avoid the agglomeration of CB particles by the dense mixing method adopted in the preparation process. These aggregates adsorb the surrounding CNTs aggregates and weaken the heterogeneous nucleation of nanoparticles, which is particularly obvious when the filler content is high.
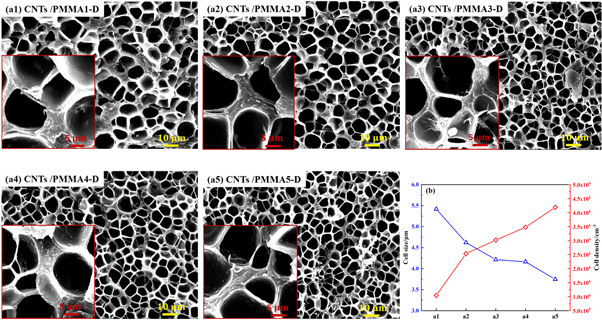
Figure 7. SEM images of CNTs/PMMA foam composites (a1)–(a5) and cell distribution (b).
Download figure:
Standard image High-resolution image
Figure 8. SEM images of CNTs/CB/PMMA foam composites (a1)–(a5) and cell distribution (b).
Download figure:
Standard image High-resolution imageBy changing the temperature and pressure at which CNTs/CB/PMMA adsorbed ScCO2, CNTs/CB/PMMA composites with different cell structures can be obtained, as shown in figure 9. As the temperature increases from 50 °C to 80 °C and the pressure increases from 12 MPa to 16 MPa, the cell density increased from 5.81 × 10⁵ cells/cm3 to 3.63 × 10⁶ cells/cm3, and the cell diameter decreased from 7.18 μm to 3.97 μm. This is because the ability of PMMA matrix to absorb CO2 decreases with the increase of temperature, and increases with the increase of pressure. And it is more sensitive to pressure influence, so the high-temperature and high-pressure process (80 °C, 16 MPa) can absorb more CO2, form more nucleation sites, and obtain higher porosity. On the other hand, although the matrix strength of PMMA is smaller at high temperature, which promotes the growth of microcell, the inhibition effect of higher pressure on the growth of bubble pores is more obvious, so high temperature and high pressure process can produce foamed composite with dense microcells and high porosity.
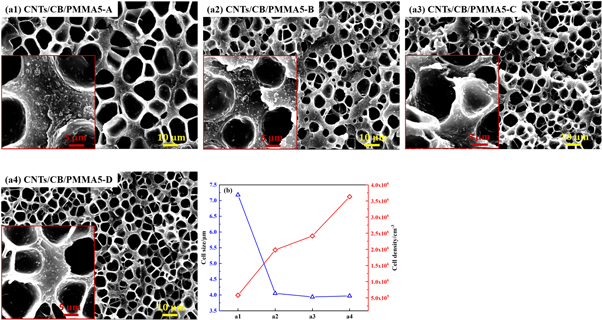
Figure 9. SEM images (a1)–(a4) and cell morphology distribution (b) of CNTs/CB/PMMA foam composites under different technological parameters.
Download figure:
Standard image High-resolution image4.2. Percolation simulation results
Since CNTs are difficult to exist in the PMMA matrix in completely straight form, and both CNTs and CB have a certain degree of agglomeration, in this section, the length of rod filler is 10 μm, the aspect ratio is 200, the diameter of particle filler is 100 nm, and the size of RVE is 20 μm, so as to conduct a qualitative analysis of the cooperative percolation between fillers. The influence of percolation probability of CNTs/CB/PPMA composites with different filler components is shown in figure 10(a). With the increase of CB content, the percolation zone gradually becomes narrower, indicating that the addition of CB intensifies the percolation effect, and the percolation threshold of CNTs decreases significantly, but the promotion degree of percolation first increases and then decreases. However, when the total content of filler was fixed, the percolation probability gradually decreased with the increase of CB. For example, when the filler content is fixed at 0.5 vol%, the change of percolation probability of RVE is shown in the brown line in figure 10 (a). This is because CB, as a low aspect ratio filler, had no advantage over CNTs in conducting network construction.

Figure 10. Monte Carlo simulated percolation probability: (a) influence of filler ratio on percolation of CNTs/CB/PMMA multiphase RVE; (b) effect of porosity on percolation of CNTs/CB/PMMA(1 vol%) foam multiphase RVE.
Download figure:
Standard image High-resolution imageAs shown in figure 10(b), the percolation threshold of CNTs/CB/PMMA foam composites decreases first and then increases with the increasing porosity, which reflects the effect of cell growth on filler rearrangement. When the porosity is appropriate (about 0.2), filler selectivity is distributed in the cell wall, and the introduction of cell has a promoting effect on the construction of conductive network. With the continuous growth of cells, excessive rearrangement of fillers destroys the structure of conductive network, and the scope of percolation zone expands significantly with the increase of porosity, which leads the probability of percolation decreasing as the porosity increases.
4.3. Electrical properties of CNTs/CB/PMMA foam composites
Figure 11 shows the influence of different volume fraction fillers on the volume conductivity of CNTs/CB/PMMA composites. As shown in figure 11(a), when CB was not added, with the increase of CNTs content from 2 vol% to 4 vol%, the conductivity of the composites rose rapidly to 4.84 S m−1. After the addition of 1vol%CB, the influence of CNTs content on the conductivity of the composite material was considered and denoted as CNTs/CB/PMMA-1. The volume conductivity of the composites increased to 3.13 S m−1 with the CNTs content increasing from 1 vol% to 3 vol%. With the same CNTs content, the addition of CB significantly enhanced the conductivity of the composites, just as the addition of CB improved the percolation probability of the RVE in figure 10(a). The composites prepared have been transformed into conductors, so the percolation threshold can be calculated by using the classical percolation equation (18). The percolation threshold of the composite materials is 1.51 vol% without CB, and 0.85 vol% with CB, and these two values are smaller than the simulated values, which is caused by the agglomeration of nanomaterials in PMMA. However, if the total content of CB and CNTs is taken as the filler content, denoting CNTs/CB/PMMA-2, the electrical conductivity is weaker than that of CNTs/PMMA composites with the same filler content. This is because CB, as a particle filler, has no advantage in the construction of conductive network and does not promote percolation as well as one-dimensional CNTs with a high aspect ratio, which was also proved in the percolation probability simulation in section 4.2.
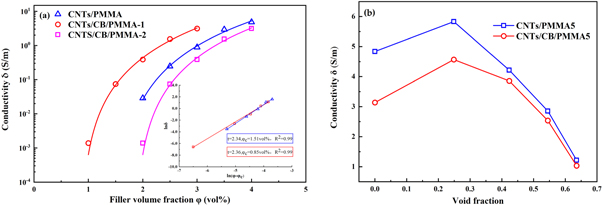
Figure 11. Electrical conductivity of CNTs/CB/PMMA composites: (a) CNTs/CB/PMMA solid composites; (b) CNTs/CB/PMMA foam composites.
Download figure:
Standard image High-resolution imageFigure 11(b) shows the conductivity of foam composites with different porosity obtained by different foaming processes. As the porosity increases, the conductivity of CNTs/PMMA composites increases first and then decreases. Previous studies have found that the conductivity of foamed materials is better than that of unfoamed materials. This is because when the porosity of foam material is low and the bubble wall is thick, CNTs do not overarrange, but promote the construction of conductive network to a certain extent. When the porosity is high, the density of the cells is higher, and the wall thickness of the cell is reduced. CNTs around the cell were excessively affected by the growth of the cell, and excessively arranged along the tangential direction of the cell, which destroys the structure of the conductive network. The conductivity of CNTs/CB(1 vol%)/PMMA foam composites also decreased with the increase of porosity, but the decline was smaller,. This was because CB was a particle filler, which was less affected by the growth of bubble holes and delayed the destruction of conductive network.
Figure 12 shows the dielectric and lectromagnetic absorption performance of CNTs/CB/PMMA foam composites. Under the same porosity, the foam composites with CB have higher dielectric constant, dielectric loss and attenuation constant, and the electromagnetic wave absorption capacity was greatly improved. Meanwhile, the absorption peak moves to low frequency and the shielding bandwidth is also larger, and the absorption peak appears at 11.5 GHz. The peak value is 16.5 dB. Compared with different porosity of composite materials of foam, low porosity foam filler network is not damage, conductive performance is better, so the dielectric constant and dielectric loss is bigger. But due to the smaller cells density, entered microwaves in the interior does not have sufficient reflection absorption. Therefore, its attenuation constant is smaller, and its electromagnetic wave absorption peak moves to the low frequency, so it has good absorption performance at the low frequency. Its absorption peak appears at 9.5 GHz, which is 15.2 dB, but its absorption efficiency of high frequency electromagnetic wave is greatly reduced.

Figure 12. Dielectric and absorbing properties of CNTs/CB/PMMA foam composites: (a) dielectric constant; (b) dielectric loss; (c) attenuation constant; (d) reflection coefficient.
Download figure:
Standard image High-resolution image
5. Conclusions
In this work, the microstructure and electrical properties of CNTs/CB/PMMA nanofoam composites were systematically studied. The addition of CNTs and CB significantly improved the conductivity of PMMA, and the conductivity of the composites increased exponentially with the increase of content of the filler. However, the conductivity of CB was weaker than that of CNTs and the aspect ratio of CNTs was larger. Therefore, when the total content of filler is the same, the conductivity of CNTs/CB/PMMA composites is not better than that of CNTs/PMMA composites. The addition of CNTs and CB promoted the heterogeneous nucleation in the foaming process of composites. As a particle filler, CB was more obvious in the low filler content. But when the filler content was high, CB enhanced the agglomeration of nanofillers, thus reducing the cell density. With the increase of porosity, the conductive properties of CNTs(3 vol%)/CB(1 vol%)/PMMA composite foam showed a trend of first increasing and then decreasing, and the simulation results of percolation probability also showed this trend. Therefore, the effect of cell growth on the conductive properties of composites has a transition from promotion to inhibition. After the addition of 1 vol%CB, the microwave absorption peak of CNTs/CB/PMMA nanocomposite foam moved to low frequency, and the absorption efficiency was significantly improved. Increasing porosity can improve the microwave absorption efficiency of composite foam at high frequency, but reduce its electromagnetic absorption performance at low frequency.
Data availability statement
All data that support the findings of this study are included within the article (and any supplementary files).
Author contributions
Conceptualization, Xuliang Zhong and Huajie Mao; methodology, Wei Ruan and Danfeng Zhou; software, Xuliang Zhong and Huan Yuan; writing—original draft preparation, Xuliang Zhong and Guoqiang Luo; writing—review and editing, Xiaorui Li and Wei Guo.
Funding
This research was funded by the National Natural Science Foundation of China Youth Fund (NO. 51801141), National Key R&D program of China (No. 2018YFB1106700), the 111Project (B17034); Innovative Research Team Development Program of Ministry of Education of China (No. IRT_17R83), the Fundamental Research Funds for the Central Universities (WUT: 2019III112CG).
Conflicts of interest
The authors declare no conflict of interest.