
Abstract
The new electrode materials are critically important for the development of lithium-ion batteries (LIBs). Herein, we report the synthesis of Germanium sulfide -graphene composite (GeS-G) by facile sonication which exhibits the excellent cycling performance for lithium-ion batteries. Under the condition of charge-discharge rate of 50 mA·g−1 and voltage window of 0.005–3 V, the specific capacity of GeS-G is 170 mAh·g−1 after 100 cycles, which is significantly higher than that of pure GeS. The results of the present work imply that the nanostructure of GeS-G is the potential electrode materials for application in high-performance lithium-ion batteries and enrich the gene bank of lithium-ion battery materials.
Export citation and abstract BibTeX RIS

Original content from this work may be used under the terms of the Creative Commons Attribution 4.0 licence. Any further distribution of this work must maintain attribution to the author(s) and the title of the work, journal citation and DOI.
1. Introduction
With the increase of energy demand, the research of energy storage technology has attracted increasing level of attention [1–4]. Lithium-ion batteries is one of the most important energy storage technologies for use in portable electronics, electric vehicles, and the storage of renewable energy [5–10]. However, the current lithium-ion batteries still suffer from the obstacle of the short cycling performance, low storage energy and high cost of production [11, 12]. It is extremely necessary to develop new electrode materials with a satisfactory cycle life and high specific storage capacities. In recent years, two dimensional (2D) materials have attracted much attention owing to its large surface-to-volume ratios, which can dissipate the mechanical stress and minimize volume change during lithiation/delithiation [13]. To the best of our knowledge, two-dimensional nanostructures of graphene, SnS, SnSe and GeSe have been successfully synthesized, and most of these electrode materials show high specific storage capacities for lithium-ion batteries [13–17]. So far, there have been cases of Ge being used in LIBs [18, 19]. Ge based materials have similar chemical properties to Si and Sn, while Si has been widely studied for its excellent electrochemical properties. However, the lithium ion diffusion rate and high conductivity of Ge are superior to Si, and it has the advantages of low diffusion resistance, high proportion of macropores, and low resistivity, which make Ge more attractive for use in lithium ion batteries [20]. However, the bulk germanium material has the problem of volume expansion during charging and discharging, and its volume change reaches 370%. It causes the electrode powder and the conductive network to collapse, resulting in the rapid dropping in the capacity. Reducing the size of Ge to the nanometer scale and recombining with materials can effectively alleviate the problems caused by volume changes during the cycle, because the nanoparticles provide a larger specific surface area and shorten the lithium ion transmission path. The recent work by Yong Jae Cho and co-worker reports the synthesis of germanium sulfide (GeS and GeS2) nanoparticles by gas-phase laser photolysis and thermal annealing [17]. The fabricated nanostructures have the function of eliminating irreversible transformation and volume diffusion. It has also been demonstrated to show excellent cycling performance and high specific capacity. However, the cost of preparing germanium sulfide by this method is relatively high and the experiment process is also complicate.
In the present work, we report the facile synthesis of GeS-graphene (GeS-G) nanostructure by a facile sonication. The graphene can improve the electronic conductivity and mechanical strength of the electrode materials. The synthesized GeS-G composites exhibit the satisfactory cycling stability and high specific capacity at high cycling rates. The results reveal that the GeS-G composites are promising electrode candidate materials for application in lithium-ion batteries.
2. Experimental procedures
2.1. Preparation of GeS nanoparticle
In a typical sonication process, the as-prepared GeS powder and ethanol solution were placed in a centrifuge tube, and then put it into an ultrasonic processor (KQ-500E) and sonicated for 5 h. After sonication, the color of the dispersion changes to the dark brown. The suspension was centrifuged at 4000 rpm for 20 min to remove any un-exfoliated GeS particles. Then, the resultant supernatant was centrifuged at 10,000 rpm for 5 min to collect the centrifuged suspension. Finally, the centrifuged suspension was dried in a drying oven at 60 °C to obtain GeS nanoparticles.
2.2. Synthesis of GeS-graphene composites
GeS-Graphene composites were prepared by a simply sonication. Flake graphene (<300 nm, XFNANO) were dispersed in alcohol by sonication in an ultrasonic processor. Then, the as-prepared GeS nanoparticles was slowly added into the centrifuge tube filled with graphene dispersion, at a mass ratio of 5:1, followed by sonicating for 5 h to obtain homogeneous black dispersion. Subsequently, the obtained black dispersion was centrifuged at 8000 rpm for 10 min. Finally, the supernatant after multiple centrifugation was collected and dried in a drying oven at 60 °C to obtain the nanoparticles of GeS-graphene composites. The whole preparation process is shown in figure 1.

Figure 1. The whole preparation process of GeS-G composites.
Download figure:
Standard image High-resolution image2.3. Materials characterization
The GeS-Graphene composites were measured by an x-ray powder diffraction (XRD D/MAX-2500) diffractometer equipped with Cu Kα radiation source. Data were recorded ranging from 5° to 80°. The morphology images and the energy dispersive x-ray spectroscopy (EDX) spectra of the GeS-G composites were obtained from a Hitachi SU 8000 scanning electron microscope (SEM). In order to further explore the detailed structures and the composition of the products. Transmission electron microscopy (TEM) images and energy dispersive x-ray spectroscopy (EDX) mapping were recorded using a Hitachi HF-3300 microscope. Diffuse reflectance UV–Vis spectra were measured on a Hitachi U-4100 instrument employed with a integrated-sphere diffuse reflectance accessory.
2.4. Electrochemical measurements
The active materials, acetylene black, and a polyvinylidene fluoride at a mass ratio of 8:1:1 were thoroughly mixed in N-methyl-2-pyrrolidone (NMP) to form a homogeneous slurry. After the slurry was coated on copper foil and dried at 60 °C in an oven for 12 h to remove the residual solvent. The CR2032-type coin cells were assembled in an Ar filled glove box. The electrolyte was 1 M LiPF6 in 1:1 ethylene carbonate (EC)/dimethyl carbonate (DMC). The discharge–charge test was measured in a potential window of 1.5–3.0 V by a Shenwei-CT2001A battery-testing system. The cyclic voltammetry (CV) measurements were conducted at the scanning rate of 0.1 mV s−1 and scanning voltage range from 1.5 to 3.0 V. The electrochemical impedance spectroscopy (EIS) data of the coin cells were acquired in the frequency ranging from 0.01 Hz to100 kHz by imposing an alternate current with an amplitude of 10 mV on the electrode.
3. Results and discussion
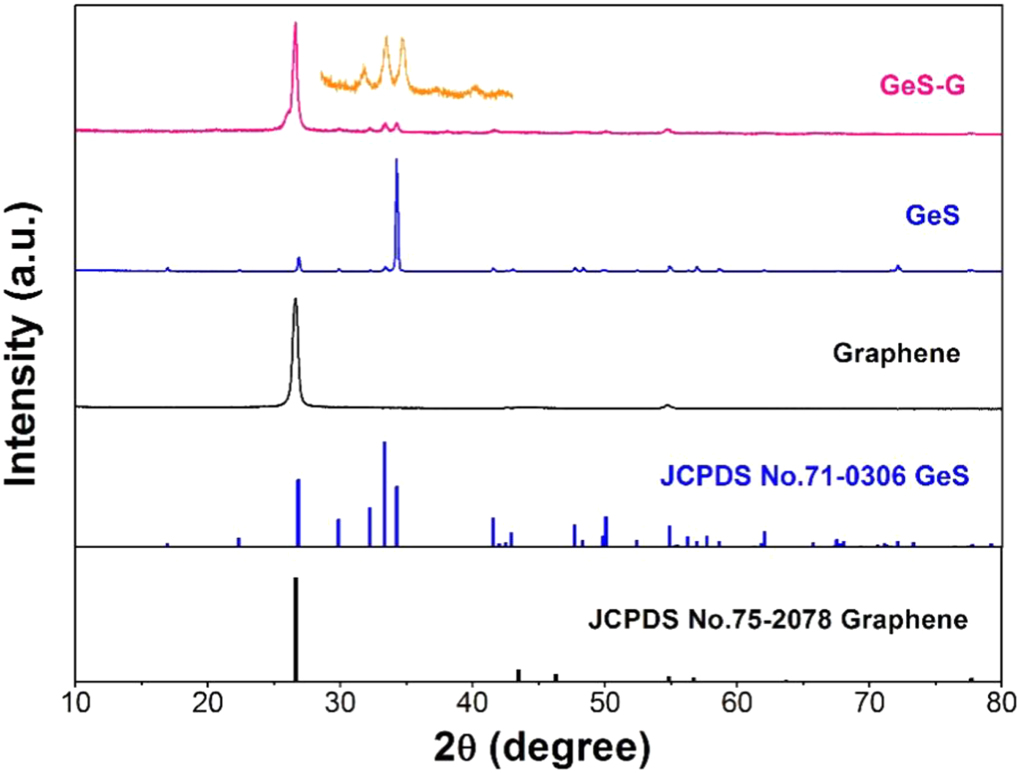
Figure 2 shows the XRD patterns of the GeS, graphene and GeS-G composites. The results clearly show that the synthesized GeS-G composites have the characteristic peaks of both GeS (JCPDS No.71–0306) and graphene (JCPDS No.75-2078). In addition, the diffraction peak is the strongest at 2θ = 27.0 and no any other impurity peaks were detected. The observed strong diffraction peaks for both GeS and graphene nanosheets are oriented along the [111] direction. From this result, the diffraction peak of the GeS is weaker than that of graphene in the GeS-G composites, mainly due to the high proportion of graphene in the test sample than that in GeS.

Figure 2. XRD patterns of GeS, graphene and GeS-G composites. The inset shows the enlarged part.
Download figure:
Standard image High-resolution imageThe morphology of the GeS and GeS-G composite were collaboratively studied by SEM and TEM. Figures 3(a)–(d) show the characterization results of pure GeS. The SEM image (figure 3(a)) clearly exhibit that the synthesis of GeS is in the form of 2D nanosheet. The TEM image (figure 3(b)) further confirms the nanosheet configuration of the synthesized GeS. The corresponding EDS mapping (figures 3(c), (d)) indicates that Ge and S elements are homogenously distributed in the nanosheets. Figures 3(e) and (f) show the characterization results of GeS-G composite. The results show that the GeS and graphene in the GeS-G composite have the lateral dimensions of 75~250 nm and 950~2000 nm, respectively. The graphene nanosheets form a network and well adsorb the highly dispersed GeS nanosheets. The EDX measurements further confirm that the GeS-G composites are composed of S, Ge, and graphene. In addition, it can be seen from figure 3(f) that the atomic ratio of S: Ge: graphene in GES-G composites is 0.9:1:3.
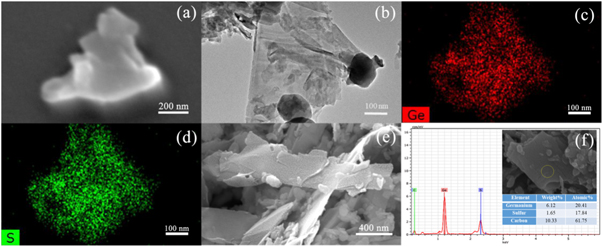
Figure 3. (a) SEM image of GeS nanosheets; (b)–(d) TEM-EDS mapping of GeS nanosheets; (e), (f) SEM and the EDS analysis of GeS-G composites.
Download figure:
Standard image High-resolution imageFigure 4 shows the UV–Vis diffuse absorption spectra of graphene, GeS and GeS-G composite samples. It can be seen that three samples have different absorption capacities in the visible waveband and thus show different colors. It can be calculated that the energy gap of GeS-G is estimated to be about 1.53 eV, which is slightly smaller than that of GeS (1.65 eV). This indicates that the conductivity of GeS-G is slightly higher than that of GeS. In general, the addition of graphene may improve the conductivity of the electrode material.
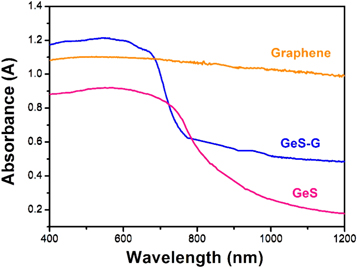
Figure 4. UV–Vis diffuse absorbance spectra of graphene, GeS, and GeS-G composites.
Download figure:
Standard image High-resolution imageFigures 5(a) and (b) show the constant-current charge-discharge curves of GeS and GeS-G composites at the current density of 0.05 A·g−1. In the first cycle, the charge and discharge capacities of GeS-G materials were 513 mAh g−1 and 1125 mAh g−1, respectively, corresponding to 46% initial coulomb efficiency (CE). This is slightly higher than that of GeS (44%). The lower initial Coulombic efficiency is due to the nanocrystallization, which helps to generate more surfaces and interfaces. This type of structure is favorable for the reaction between electrode materials and electrolytes, thus consuming lithium and forming a so-called solid electrolyte interface (SEI) film. However, the charge and discharge curves of GeS-G composites coincide from the second cycle, which indicates that GeS-G composites have good cycle stability. At the same time, it can be seen from figure 5(a) that the GeS-G composite appears a platform of about 0.5 V during the first charge-discharge process. The emergence of the platform is attributed to the decomposition of GeS into Ge and Li2S:  which is consistent with the cyclic voltammetry curve described later. The results show that the addition of graphene can improve the loss of initial capacity of electrode materials, and also indicate that the electrode materials can form Li2S more effectively. As a lithium ion conducting matrix, Li2S allows further alloying and dealloying of germanium [17]. As shown in figure 5(c), GeS-G electrode shows a reversible capacity of 145 mAh·g−1 after 115 cycles of charge and discharge at a current density of 50 mA·g−1, which was much higher than that of GeS electrode (39 mAh·g−1). In addition, the Coulomb efficiency of the two electrode materials is close to 100% during the charge-discharge cycle. Figure 5(d) shows the rate performance of GeS and GeS-G composite electrodes respectively. It is obvious that the charge-discharge specific capacity of GeS-G electrode is higher than that of GeS electrode at the charge-discharge rates of 0.05 A·g−1, 0.1 A·g−1, 0.15 A·g−1 and 0.2 A·g−1. After that, when scanning at a current density of 0.05 A·g−1 again, the reversible capacity of GeS-G electrode almost recovers, indicating the excellent rate performance.
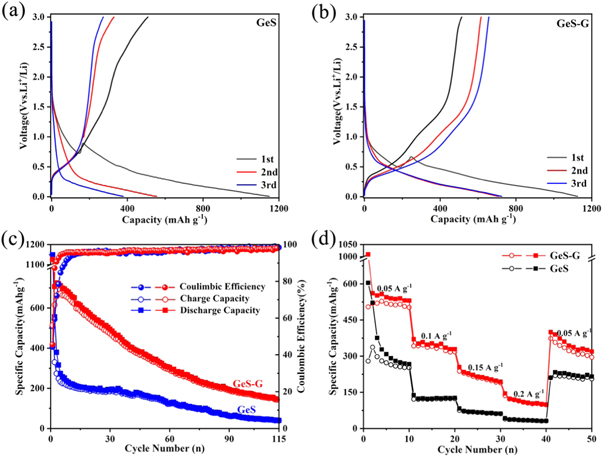
Figure 5. Lithium storage characteristics of GeS and GeS-G composite electrodes in half cells. Constant current discharge-charge curves of (a) GeS and (b) GeS-G composite electrode materials at 50 mA·g−1 current density. (c) The cycling performance and Coulombic efficiency of GeS and GeS-G composite electrode materials. (d) Rate performance of GeS and GeS-G composite electrode materials at various current densities from 0.05 to 0.2 A·g−1.
Download figure:
Standard image High-resolution imageThe cyclic voltammetry curve of the GeS-G composite electrode is shown in figure 6(a). In the initial cathode scanning process, the reduction peak of 0.09 V is clearly visible, which corresponds to the irreversible reaction of GeS into Ge:  which is also an important reason for the large loss of initial battery capacity [18]. The reduction peak of 0.22 V in the subsequent cathode scanning process corresponds to
  The strong oxidation peak of 0.48V in the anodic scanning process corresponds to the lithium removal process of LixGe:
  [16]. In addition, with the increase of cycle times, the shape and peak value of CV curve have no obvious change. This indicates that GeS-G anode material has good reversibility to LIBs. In order to further study the excellent rate performance of GeS-G composite electrode material. The voltammetric tests of GeS-G electrode under different current densities were carried out. Figure 6(b) shows the CV curves of electrode materials at various scanning speeds from 0.1 mv s−1 to 0.5 mv s−1, which shows that the current peak increases with the increase of scanning rate. The pseudo-capacitance behavior of electrode materials can be judged according to the measured relationship between peak current (i) and scanning rate

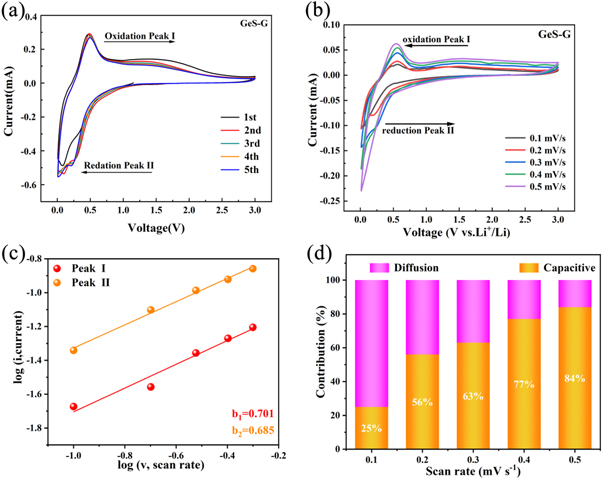
Figure 6. (a) Cyclic voltammetry curves of GeS and GeS-G composite electrode materials. (b) CV curves at different scan rates from 0.1 to 0.5 mV•s−1 and (c) The relationship between peak current (i) and scan rate (v). (d) Bar graph of the proportion of pseudocapacitance contribution at different scanning rates.
Download figure:
Standard image High-resolution imageWhen 0.5 < b < 1, both diffusion behavior and pseudo-capacitance behavior exist in the electrochemical process [18]. The b values of oxidation peak and reduction peak are 0.701 and 0.685 respectively by linear fitting of log i and log v with formula (1) (figure 6(c)). The result shows that the GeS-G composite electrode has both diffusion behavior and pseudo-capacitance behavior during the process of charge and discharge. The current contribution of pseudo-capacitance behavior and diffusion behavior can be obtained respectively by calculating the variable parameters k1 and k2 in formula [21]:

The contribution rate of pseudo-capacitance behavior at different scanning speeds is shown in figure 6(d). It is obvious that the contribution rate of pseudo-capacitance increases with the enhancement of scanning speed, and the contribution rate of pseudo-capacitance behavior is as high as 84% at the scanning rate of 0.5 mv s−1. This result indicates that the electrochemical process is mainly dominated by the pseudo-capacitance behavior. This pseudo-capacitance behavior is beneficial to the rate performance and cycle stability of electrode materials.
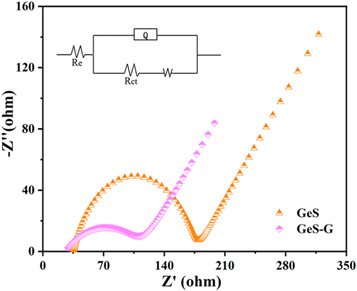
In order to better understand the mechanism behind the excellent electrochemical performance of the GeS-G composites, we analyzed GeS-G and GeS by electrochemical impedance respectively. As shown in the Nyquist diagram of figure 7, the electronic conductivity of GeS-G composite material is better than that of GeS. According to equivalent circuit fitting, both ohmic resistance (Re) and charge transfer resistance (Rct) at the interface between electrode and electrolyte of button cell with GeS-G composite electrode are smaller than those of pure GeS electrode. Therefore, the improvement of electron transport performance may be attributed to the enhanced electrochemical reactivity of GeS material surface by the addition of graphene. The corresponding equivalent circuit is given in the illustration, in which Re represents electrolyte resistance, Rct represents charge transfer resistance between electrode and electrolyte interface [22], W represents Warburg diffusion impedance, and Q represents constant phase element.
Figure 7. The Nyquist plots of GeS and GeS-G composite electrode materials and the corresponding equivalent circuits.
Download figure:
Standard image High-resolution image
4. Conclusions
In this work, we report the synthesis of GeS-G composite material by simple ultrasonic and centrifugal methods. Compared with the pure GeS, GeS-G composite electrode materials show better rate performance, higher reversible specific capacity and lower impedance. On the one hand, the nanocrystallization of GeS powders can effectively overcome the problem of particle crushing, thus improving the electrochemical activity of electrode materials [23]. On the other hand, graphene nanosheets can not only be used as a buffer layer to maintain the structural integrity of electrode materials, but also provide a good conductive network for rapid electron transfer [24]. This experiment not only shows the potential of GeS in lithium anode materials, but also provides a new idea for the future research of germanium-based materials in lithium battery anode.
Acknowledgments
The study was supported by China Postdoctoral Science Foundation (2020M681519), China Postdoctoral Science Special Foundation (2021T140284), the Youth Backbone Teacher of Henan Province (2020GGJS197), the Natural Science Foundation of Henan Province (212300410375), the Key scientific research projects of Henan Province (Grants 21A140018), the college students innovations special project (Grant Nos. S202110482041, 2021104822028, 202110482016 and S202110482037), excellent Team of Spectrum Technology and Application of Henan province (Grant No. 18024123007).
Data availability statement
The data that support the findings of this study are available upon reasonable request from the authors.