
Abstract
NM450 (450 HBW-grade, low-alloy, wear-resistant steel) is an ultrahigh-strength steel, in most cases, the inclusions in NM450 have a negative effect on its toughness, strength, and weldability. However, the detrimental effect of inclusions can be reduced by inclusion modification. In this study, the effect of oxide metallurgy on the evolution of inclusions in NM450 ultrahigh-strength steel was investigated, and it was found that as the O content increased in the steel before treatment, the Ti content in the formed inclusions increased. By extending the deoxidation time after adding Ti, the ratio of inclusions smaller than 10 μm in the steel increased, whereas that of larger inclusions gradually decreased. In the Ti–Ce and Ti–Ca composite deoxidation, the former had a higher and more stable yield, but the Ca treatment was more conducive to the nucleation of sulphides, thus reflecting the oxide metallurgical effect. The addition of Ce was prone to adhesion to the crucible wall, which may have an adverse effect on actual production. This work provides a theoretical reference for broadening the scope of application of high-strength steel products, improving product quality.
Export citation and abstract BibTeX RIS

Original content from this work may be used under the terms of the Creative Commons Attribution 4.0 licence. Any further distribution of this work must maintain attribution to the author(s) and the title of the work, journal citation and DOI.
1. Introduction
It is well known that the inclusions are generally the formation source of cracks and significantly affect the fracture toughness of high-strength steels; therefore, how to modify inclusions and improve fracture toughness are urgent to be solved for high-strength steels [1]. To turn the inclusions in steel into beneficial for performance enhancement, researchers put forward the technical idea of 'oxide metallurgy'. Oxide metallurgy is mainly used to form ultrafine (particle diameter ≤3 μm), uniformly distributed, high-melting-point oxide inclusions in steel, thereby changing the microstructure and grain size of the steel and ultimately improving its toughness, strength, and weldability [2–8]. In addition, oxide metallurgy technology plays a beneficial role in preventing the growth of austenite grains and promoting acicular ferrite nucleation during the welding process [9–12], which has far-reaching significance for welding steel materials.
Among the oxide inclusions that effectively promote heterogeneous nucleation in welding heat affected zone (HAZ), Ti oxides (TiO, TiO2, Ti2O3, and Ti3O5) are the most effective nucleation cores [13]. It is worth noting that among all the Ti oxides, Ti2O3 has the strongest ability to promote intragranular nucleation. Lou et al [14] studied the effect of oxide particles on microstructure and mechanical properties. Their research showed that the microstructure of Ti-Mg oxide metallurgy steel changes from conventional bainite packets to acicular ferrites. Lee et al [15] studied the effect of deoxidation time on deoxidation products. The authors found that reducing the Ti treatment time was beneficial to the formation of more Ti oxides in the steel but that the dispersion of Ti oxides in the steel was more uneven. Hiroki et al [16] also studied the effect of different cooling rates on the precipitation of oxides during solidification. The authors reported that the effect of the cooling rate on the size of oxides in Ti-treated steel was greater than that on the size of oxides in Al–Ca-treated steel, this suggested that the deoxidation effect of Al–Ca composite deoxidation was greater than Ti deoxidation. Janis et al [17] studied the Ti-Ce complex deoxidation, but the effect of the adding intervals time of Ti and Ce was not discussed.
At present, the main processes of oxide metallurgy are as follows: After pretreatment, molten iron is subjected to converter blowing, and Si and Mn are used for weak deoxidation treatment; the Al content and free oxygen content in the molten steel are controlled during deoxidisation. Ti or other deoxidisers are then added to form a large number of fine oxide particles in the steel; the growth of inclusions after deoxidisation can be controlled by limiting the deoxidisation time. Finally, through controlled rolling and cooling, the fine-grain strengthening effect of the fine inclusions is fully exerted.
However, in the actual production process, the influence of the morphology of primary inclusions, inoculation time, and initial oxygen position of Si and Mn weakly deoxidised molten steel on titanium oxide and how to control the high S content in molten steel after Ti addition need to be further studied. This article intends to combine theoretical calculations and experiments to explore the main influencing factors of the formation, precipitation and dispersion of microscopic oxides in smelting, combined with Lianyuan Iron and Steel's existing process conditions, to form an oxide metallurgical technology suitable for Lianyuan Iron and Steel. Therefore, to improve the toughness, strength, and weldability of NM450 ultrahigh-strength steel by oxide metallurgy, this study analysed the evolution behaviour of titanium oxide inclusions in NM450 ultrahigh-strength steel, which provides a reference for the oxide metallurgy process.
2. Materials and methods
NM450 steel produced by Lianyuan Iron and Steel Co., Ltd., was used as the experimental sample. The composition control requirements of this steel in the smelting process are shown in table 1. The experiments were carried out in a high-temperature carbon tube furnace. The power of the carbon tube furnace was 25 kVA, the inner diameter of the carbon tube heating element was 70 mm, the height of the isothermal section was approximately 50 mm, and the heating rate was 50–150 °C min−1. During the heating, reduction, and cooling process, Ar was continuously passed from the bottom to protect the carbon tube, and the temperature was 1600 °C. The sample was placed in a MgO crucible, and the furnace was heated. After the temperature reached 1600 °C, the sample was maintained at that temperature for 10 min to completely melt it. The entire process was protected by N2 gas.
Table 1. Composition control requirements of NM450 steel smelting process, wt%.
| Element | C | Si | Mn | Al | Nb | Ti |
|---|---|---|---|---|---|---|
| NM450 steel | 0.23 | 0.25 | 0.90 | 0.025 | 0.025 | 0.50 |
2.1. Weak deoxidation simulation experiment of converter tapping
The final molten steel simulated that from the converter: The total O content was 200–800 ppm, and the total C content was 0.05%–0.15%. Using pure iron as the raw material, the C and O contents in the steel were adjusted by adding pure carbon powder and Fe2O3 powder, respectively. The amount of pure iron was approximately 500 g, and Fe2O3 powder and pure carbon powder were added according to the oxygen content at different end points. After the raw materials in the high-temperature carbon tube furnace were completely melted, a quartz glass tube was used to absorb the molten steel sample, and electrolytic manganese and ferrosilicon were added for deoxidation and alloying. Sampling was performed every 3–5 min, and the samples were tested for total O content and microscopic inclusions. The change in the total O content in the steel over time was analysed, and the influence of different deoxidising alloying methods on the types and particle sizes of inclusions in the steel was studied. The actual amount of each addition to the alloys is shown in table 2.
Table 2. Actual additions of experimental alloys.
| Sample number | Pure iron/g | Fe2O3/g | C/g | Ferrosilicon/g | Electrolytic manganese/g |
|---|---|---|---|---|---|
| 1 | 500 | 1.25 | 1.35 | 3.41 | 6.10 |
| 2 | 500 | 1.90 | 1.27 | 3.60 | 5.97 |
| 3 | 500 | 2.50 | 1.30 | 3.48 | 6.01 |
| 4 | 500 | 3.75 | 1.36 | 2.73 | 6.47 |
| 5 | 500 | 5.00 | 1.18 | 2.92 | 6.38 |
2.2. Effect of initial oxygen content on titanium oxide inclusions
Using an NM450 continuous-cast billet sample as the raw material, Fe2O3 powder was used to adjust the O content in steel and then pure Ti powder was added for alloying. The experiment was carried out in a high-temperature carbon tube furnace. After Ti powder was added over 5 min, samples were taken for total O content and microscopic inclusion detection. It was found that the initial oxygen content changed the number of inclusions in the steel. The experimental design is shown in table 3.
Table 3. Design of initial oxygen content.
| Sample number | Initial O content/ppm | Ti addition/% |
|---|---|---|
| 6 | 15 | 0.02 |
| 7 | 30 | 0.02 |
| 8 | 40 | 0.02 |
| 9 | 50 | 0.02 |
| 10 | 60 | 0.02 |
| 11 | 80 | 0.02 |
| 12 | 100 | 0.02 |
2.3. Effect of incubation time on titanium oxide inclusions
The NM450 continuous-cast billet sample was used as the raw material, and the addition of Ti was mainly compounded with the original Mn–Si–Al–O inclusions. The influence of the compound incubation time on the morphology, composition, and size of the inclusions was directly related to the oxide metallurgical effect [18]. Thus, three heats of molten steel with different initial O contents after carbon tube furnace treatment were selected, and Ti was added for alloying. The raw material in each molten steel heat was sampled at 3, 6, 9, and 12 min using a quartz tube to analyse the influence of the incubation time on the titanium oxide inclusions. The experimental design is shown in table 4.
Table 4. Actual addition amounts of experimental alloys.
| Sample number | Initial O content/ppm | Si content/% | Mn content/% | Ti content/% |
|---|---|---|---|---|
| 13 | 30 | 0.3 | 1.2 | 0.02 |
| 14 | 50 | 0.3 | 1.2 | 0.02 |
| 15 | 70 | 0.3 | 1.2 | 0.02 |
2.4. Ti–Ca/Ti–Ce composite deoxidation
The effect of Ti–Ca/Ti–Ce composite deoxidisation [19] on the morphology, size of inclusions, and the O and S contents in the steel was studied by changing the alloy addition mode in the carbon tube furnace to explore the best process method. The amount of alloy added in the experiment is shown in table 5. The molten steel at the end of the converter was simulated: The total O content was 200–800 ppm, and the total C content was 0.05%–0.15%. Using pure iron as the raw material, electrolytic manganese and ferrosilicon were used for deoxidation alloying for 5 min, and the O content in the steel was ensured to be greater than 30 ppm. Then, pure Ti powder and Ca/Ce were added; the crucible was quickly removed and cooled for 15 min after all the alloys were added. Subsequently, the total O content and microscopic inclusions were detected in the molten steel samples after cooling, and the changes in the total O content in the steel over time, as well as the changes in the types and particle-size distribution of the inclusions in the steel, were analysed.
Table 5. Actual additions of experimental alloys.
| Sample number | Pure iron/g | Ti/g | Ca/g | Ce/g | Adding mode |
|---|---|---|---|---|---|
| 16 | 500 | 1.30 | 1.25 | Add simultaneously | |
| 17 | 500 | 1.30 | 1.25 | Ti first, then Ca, 3 min interval | |
| 18 | 500 | 1.30 | 1.25 | Ti first, then Ca, 5 min interval | |
| 19 | 500 | 1.30 | 1.15 | Add simultaneously | |
| 20 | 500 | 1.30 | 1.15 | Ti first, then Ce, 3 min interval | |
| 21 | 500 | 1.30 | 1.15 | Ti first, then Ce, 5 min interval |
During the steelmaking process, the temperature and oxygen probe is used to measure the temperature and oxygen of the molten steel. The laboratory uses ONH-3000 oxygen, nitrogen and hydrogen analyzer to determine the oxygen content in steel. After sampling, the surfaces of the abovementioned metal samples were polished. The samples were cut into suitable sizes and then prepared using standard metallographic procedures after inlaying with resin at low temperature. The metallographic specimens were grinded by emery paper down to #1500 and polished by diamond suspension polishing liquid. A Leica microscope and a Aspex Explorer scanning electron microscope were used to statistically analyse the inclusions with non-erosion specimens. The number, size and chemical composition of inclusions were obtained by Aspex Explorer scanning electron microscope.
3. Results and discussion
3.1. Weak deoxidisation of converter tapping
Sampling and analysis showed that the initial oxygen contents of samples 1–5 were 212, 316, 401, 523, and 736 ppm, respectively. After deoxidising and alloying for 15 min, the oxygen content of each sample was reduced to approximately 60 ppm. Figure 1 shows the type and size of microscopic inclusions in samples 1 and 5.
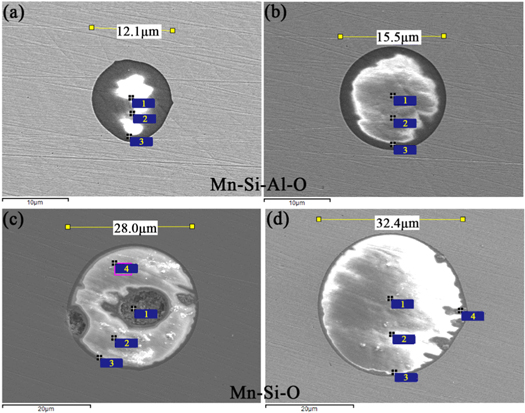
Figure 1. Types and sizes of microscopic inclusions in samples (a), (b) Sample 1 and (c), (d) Sample 5.
Download figure:
Standard image High-resolution imageWhen the low-stretch carbon blowing method was used in the smelting process and the initial oxygen content in the steel was 736 ppm, the inclusions in the steel were Mn–Si–O inclusions. At this time, the average size of the inclusions was 17.69 μm, and the size of the inclusions increased significantly. It can be seen that when the silico-manganese alloy was used to deoxidise the molten steel, the initial inclusions were mainly Mn–Si–O composite inclusions, and there was little difference in the composition and morphology of the inclusions. However, as the initial O content in the steel increased, the size of the initial inclusions generated when the silico-manganese alloy was used for deoxidation increased, and the number of large-sized inclusions gradually increased as the smelting process progressed.
3.2. Effect of initial oxygen site on titanium oxide inclusions
Under different initial oxygen content conditions, the analysis results of oxygen content in the samples before and after Ti alloying are shown in figure 2. The oxygen content in the steel was sampled and analysed after the materials were completely melted, which is consistent with the designed oxygen content (10–100 ppm, see table 3). After adding Ti powder over 5 min, the average oxygen content in the steel was approximately 19 ppm, which increased slightly with an increase in the initial oxygen content in the steel.
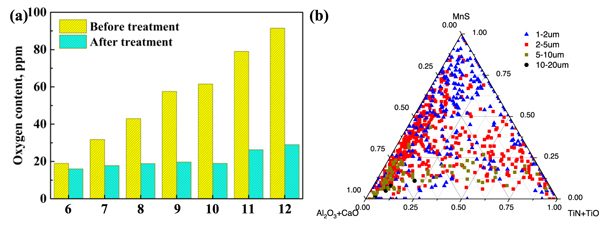
Figure 2. (a) Oxygen content in steel before and after adding Ti and (b) the inclusions statistically analyse of sample 6.
Download figure:
Standard image High-resolution imageWhen the oxygen content in the steel was less than 30 ppm, there was basically no Ti in the inclusions. Combining the figure 3(a), when the oxygen content in the steel was less than 30 ppm, Ti element can still be detected in some inclusions. It is considered that when the oxygen content in the steel is too low, it is difficult to form inclusions containing Ti while competing with other deoxidising elements because the binding force between Ti and O is less than that of Al and Si. Thus, to ensure the formation of titanium oxide inclusions, it is necessary to ensure that the O content in steel is greater than 30 ppm before adding Ti. With increasing O content in the steel before treatment, the Ti content in the inclusions increased.
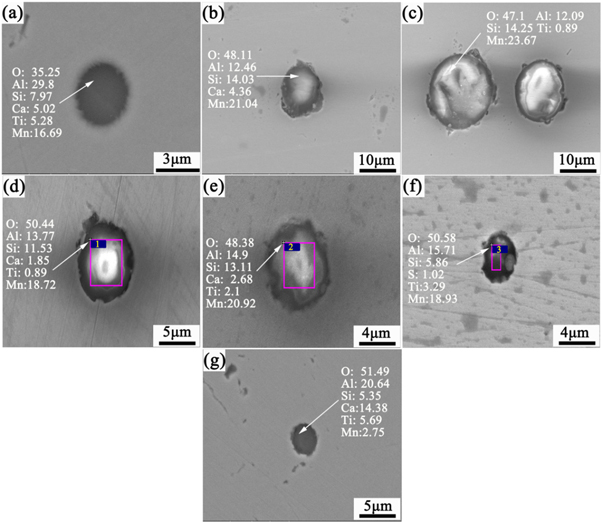
Figure 3. Morphology and energy spectrum analyses of microscopic inclusions for samples (a) 6, (b) 7, (c) 8, (d) 9, (e) 10, (f) 11, and (g) 12.
Download figure:
Standard image High-resolution imageIt can be seen from figure 3 that the inclusions were mainly Mn–Si–Ti–Al–O composite inclusions. Al deoxidation was not carried out at this time, but owing to various auxiliary materials, Al was introduced in the slag. Al was detected in the inclusions, but its content was lower than that of traditional deoxidation by adding Al. The addition of Ti did not form separate titanium oxide inclusions but rather composite inclusions with primary inclusions. With increasing O content, the size of the inclusions did not change significantly, and compared with the inclusions from the simulated deoxidisation at the end of the converter, the size of the inclusions decreased significantly.
3.3. Effect of incubation time on titanium oxide inclusions
The morphologies and energy spectra of the inclusions in the samples after sampling at 3, 6, 9, and 12 min in the three groups of experiments are shown in figure 4. As shown in figures 4(a)–(c), when the three groups of experiments were sampled at 3 min, the inclusions were mainly Al2O3, and there were some composite inclusions containing Mn, Si, and Ca. At this time, no Ti-containing inclusions were found, indicating that an incubation time of 3 min was insufficient to produce Ti-containing inclusions. When sampling at 6 min, the inclusions in the steel contained a small amount of Ti (see figures 4(a6), (b6), and (c6)). Comparing the samples taken at 9 and 12 min, the Ti content in the inclusions in the steel increased, and MnS inclusions gradually began to appear around the original inclusions.

Figure 4. Morphologies and energy spectra analysis of microscopic inclusions for samples (a3–a12) 13, (b3–b12) 14, and (c3–c12) 15.
Download figure:
Standard image High-resolution imageThe statistical results of the number of inclusions and particle-size distribution are shown in table 6. As the time after the Ti treatment increased, the ratio of inclusions smaller than 10 μm in the steel increased, whereas that of the larger inclusions gradually decreased. After 12 min of treatment, the ratio of inclusions smaller than 10 μm in the steel was greater than 95%, and the total amount was much higher than that before Ti treatment. However, the quartz tube retained a small amount of sample during the process, and the total number of inclusions did not show obvious regularity.
Table 6. Particle-size distribution of microscopic inclusions.
| Sample number | Sampling | 0 ∼ 5 μm | 5 ∼ 10 μm | 10 ∼ 15 μm | 15 ∼ 20 μm | >20 μm | Number of inclusions per unit area (Pcs/mm−2) |
|---|---|---|---|---|---|---|---|
| 13 | 3 min | 67.91% | 25.64% | 4.04% | 1.03% | 1.39% | 11.41 |
| 6 min | 79.12% | 14.53% | 3.23% | 1.40% | 1.72% | 15.66 | |
| 9 min | 80.13% | 16.52% | 2.22% | 0.68% | 0.46% | 8.90 | |
| 12 min | 88.13% | 8.52% | 2.22% | 0.68% | 0.46% | 13.20 | |
| 14 | 3 min | 76.91% | 15.64% | 4.04% | 1.03% | 2.39% | 8.47 |
| 6 min | 89.12% | 4.53% | 3.23% | 1.40% | 1.72% | 15.66 | |
| 9 min | 80.13% | 16.52% | 2.22% | 0.68% | 0.46% | 9.41 | |
| 12 min | 89.13% | 7.52% | 1.22% | 0.68% | 1.41% | 18.27 | |
| 15 | 3 min | 76.12% | 14.53% | 7.23% | 1.40% | 0.72% | 12.66 |
| 6 min | 83.13% | 12.52% | 2.22% | 0.68% | 1.46% | 18.70 | |
| 9 min | 87.41% | 6.54% | 4.66% | 0.68% | 0.70% | 17.24 | |
| 12 min | 90.13% | 6.52% | 2.22% | 0.68% | 0.23% | 18.70 |
3.4. Ti–Ca/Ti–Ce composite deoxidation
3.4.1. Evolution of inclusions
Figure 5 shows the microscopic inclusion morphology and energy spectrum analyses of the two Ti–Ca/Ti–Ce composite deoxidation processes for different alloy addition times.

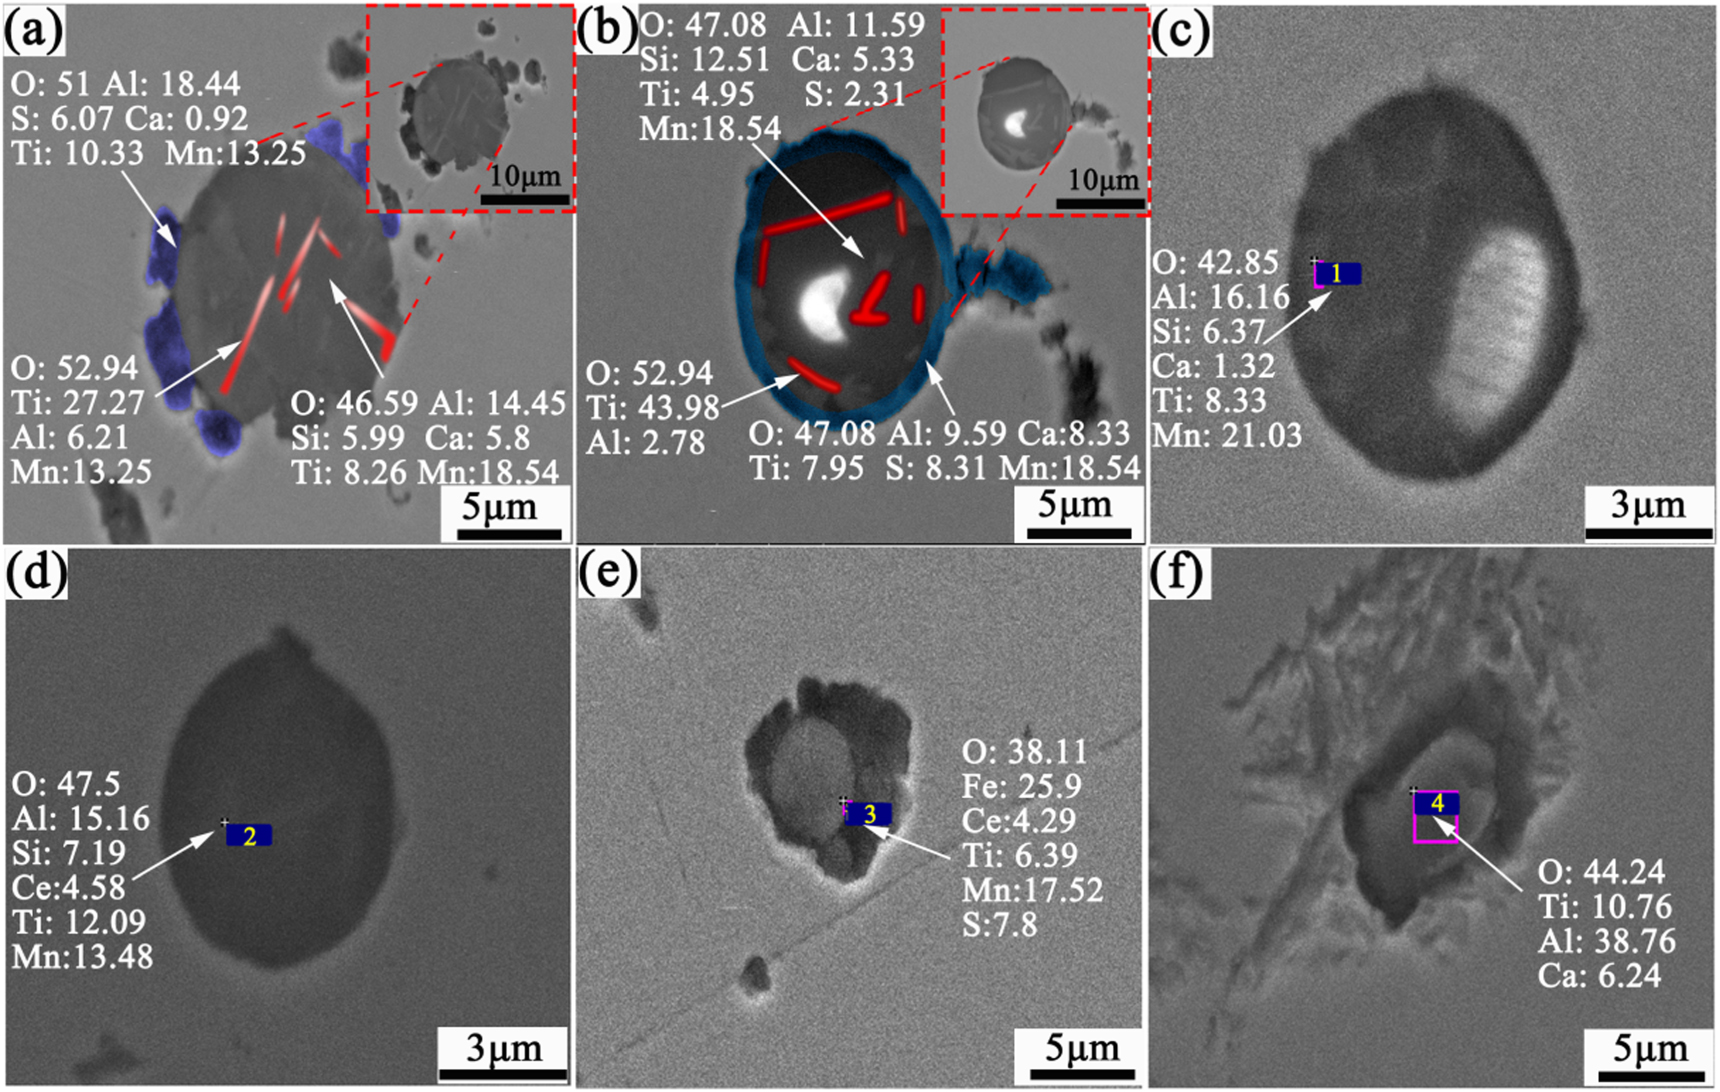
Figure 5. The morphologies and energy spectrum analyses of microscopic inclusions for samples (a) 16, (b) 17, (c) 18, (d) 19, (e) 20, and (f) 21.
Download figure:
Standard image High-resolution imageFigures 5(a)–(c) shows the inclusions obtained in the three groups of experiments when Ti–Ca composite deoxidation is used. Needle-like titanium oxide inclusions were observed in the inclusions, whereas the inclusions wrapped in them were Al–Si–Mn–Ca–Ti–O composite inclusions. There were obvious S-containing inclusions wrapped around the inclusions in samples 16 and 17. In addition to the above composite inclusions, there was a certain amount of MnS. According to the results of the energy spectrum analyses, the MnS content was approximately 20% (see figures 5(a) and (b)). However, in the observation of inclusions for sample 18, no MnS was found outside the composite inclusions (see figure 5(c)). As shown in figures 5(d)–(e), when using Ti–Ce composite deoxidation, needle-like titanium oxide inclusions were also observed in some of the inclusions, and the Al–Si–Mn–Ce–Ti–O composite inclusions were wrapped outside, but the ratio of such inclusions was relatively small. At the same time, sulphide inclusions were observed around some inclusions (see figure 5(e)). However, in sample 21, the inclusions were mainly Al2O3, Ca–Al–O, and a small amount of Ca–Al–O–Ti composite inclusions, and no Ce-containing composite inclusions were found (see figure 5(f)). The analysis suggested that this may be because the inclusions containing Ce easily adhered to the crucible wall, which was consistent with the research results [17, 20, 21]. Meanwhile debonding between the inclusions and the steel matrix can be seen from figure 5, the debonded inclusions initiated micro-cracks or formed butterflies, and the White Etching Areas in the region of the butterfly wing was a damaged material that showed tearing at the debonding gap between the inclusion and steel matrix under rolling contact fatigue [22].
Figure 6 shows the particle-size analysis of the microscopic inclusions in samples 16–21. The ratio of inclusions smaller than 10 μm in the samples under the two types of Ti–Ca/Ti–Ce composite deoxidation was approximately 90%. However, there was a certain difference in the number of inclusions smaller than 5 μm. When Ti–Ca and Ti–Ce were used, the number of small inclusions obtained by the former was obviously larger, which may have been owing to the fact that rare earth inclusions adhered more easily to the crucible wall and could then be removed. Combining table 5 and figure 6, it can be seen that when Ti and Ca/Ce were added at intervals of ≤3 min, the particle-size distribution of the inclusions was similar. When the Ca/Ce addition interval was 5 min, the number of inclusions less than 5 μm decreased rapidly, and the composition of the inclusions changed significantly.

Figure 6. Size analysis of microscopic inclusions in samples 16–21.
Download figure:
Standard image High-resolution image
The fine MnS inclusions during the phase transition can induce the formation of intragranular ferrite (IGF), which in turn improves performance. Genichi et al [23] determined that there was a Mn-poor zone around MnS inclusions that promoted the formation of IGF. The precipitation rate of MnS on different oxide inclusions is mainly affected by the properties of the oxide. Wakoh et al [24] studied the effect of different oxides (Mn–Si–O, Ti–Mn–O, ZrO2, Al2O3) on the precipitation of MnS. The study showed that MnS was more likely to have a high sulphur capacity and low melting point of oxide precipitation under low-sulphur conditions. In addition, the precipitation of MnS is strongly related to the surface composition of the inclusions, and Ti2O3 inclusions have a greater effect on promoting the precipitation of MnS. During the formation of inclusions for samples 16, 17, 19, and 20, where Ti and Ca/Ce were added at intervals of ≤3 min, the Al–Si–Mn–Ca/Ce– Ti–O composite inclusions had a higher Ti content on the surface, which better promoted the nucleation of MnS on the inclusions. However, in samples 18 and 21, because of the longer interval between the Ti and Ca/Ce addition (5 min), most of the Ti formed a composite with the original inclusions, and Ca/Ce mainly formed a coating layer on the surfaces of the composite inclusions, resulting in a lower Ti content on the surfaces of the inclusions. Therefore, when using the Ti–Ca/Ce composite deoxidation treatment, the time interval for adding Ti and Ca/Ce alloy should be as short as possible, preferably within 5 min.
3.4.2. Effect of compound deoxidation on the O and S content in steel
Ca is a better deoxidiser than Al. Its binding force with O and S is very strong, and it has a better desulphurisation and deoxidation effect when Ti–Ca alloying. Studies have shown that retreatment can greatly reduce the O and S content in molten steel and render the inclusions retained in molten steel harmless. When using Ti–Ca and Ti–Ce treatments, they mainly react with O and S in molten steel as follows [25]:


According to the isothermal equation formula, equations (1)–(4) can be transformed as follows:


To simplify the calculation, assuming that the activities of the generated sulphides and oxides were both 0.75, the activity products of the alloying elements and O and S in the steel at 1600 °C are shown in table 7. It can be seen from table 7 that the deoxidation and desulphurisation capabilities of Ca and the rare earth element Ce are similar. At 1600 °C, when the O content in molten steel was 20 ppm, the balanced Ca and Ce contents were 20.3 ppm and 24.4 ppm, respectively. When the S content in molten steel was 70 ppm, the balanced Ca and Ce contents were 14.5 and 25.1 ppm, respectively. In the actual production process, owing to the interaction of other elements in the molten steel, the O and S content in the molten steel should be lower than the equilibrium value during equilibrium.
Table 7. Activity products of alloying elements and O and S in molten steel during deoxidation treatment.
| Parameter | a[Ca] · a[O] | a[Ca] · a[S] | a[Ce] · a3/2 [O] | a[Ce] · a[S] |
|---|---|---|---|---|
| Activity product | 7.21 × 10⁻⁷ | 7.52 × 10⁻⁶ | 1.53 × 10⁻⁹ | 1.36 × 10⁻⁵ |
Table 8 shows the changes in the O and S contents in molten steel before and after Ti–Ca and Ti–Ce treatments. For samples 16–18 in table 8, the O content in molten steel after adding Ti for deoxidation was 19–26 ppm; after adding Ca, the O content was between 14 and 16 ppm, the S content decreased from the average value of 56 to 22 ppm, and the desulphurisation rate was 60%. This shows that the S content in the molten steel was effectively controlled during the Ca treatment. The average O content in the molten steel treated with Ce was 11 ppm, and the average S content of 20 ppm. The Ce content in molten steel was 60 ppm, and the average calculated Ce yield was 55%. The yield of Ce was higher than that of Ca, which may have been due to the fact that the boiling point of Ca is only 1484 °C, whereas that of Ce is 3426 °C. Therefore, Ca is easier to volatilise at high temperatures, and thus the yield is relatively lower.
Table 8. Changes in O and S contents in molten steel before and after calcium treatment, ppm.
| Sample number | OB | OA | SB | SA | CaA | Ca yield/% |
|---|---|---|---|---|---|---|
| 16 | 19 | 14 | 57 | 20 | 27 | 36.6 |
| 17 | 21 | 15 | 49 | 23 | 31 | 41.7 |
| 18 | 26 | 16 | 72 | 24 | 24 | 35.7 |
| Sample number | OB | OA | SB | SA | CeA | Ce yield/% |
| 19 | 24 | 11 | 63 | 18 | 65 | 53.4 |
| 20 | 23 | 12 | 71 | 21 | 71 | 60.8 |
| 21 | 21 | 10 | 69 | 19 | 48 | 57.5 |
B: before, A: after
Comparing the treatment effects of Ti–Ca and Ti–Ce, both alloy methods show that the interval between the Ti and Ca/Ce addition should be as small as possible, preferably not more than 5 min. From the perspective of the yield, the yield of Ce was higher than that of Ca, and the yield was relatively stable. However, Ca treatment was more conducive to the nucleation of sulphides, thus reflecting the effect of oxide metallurgy. The addition of Ce was prone to adhesion to the crucible wall, which may adversely affect the actual production.
4. Conclusions
- (1)To ensure that titanium oxide inclusions can be generated later, it was necessary to ensure that the O content in the steel was greater than 30 ppm before adding Ti.
- (2)With increasing the deoxidation time after adding Ti, the ratio of inclusions smaller than 10 μm in the steel increased, whereas that of larger inclusions gradually decreased.
- (3)After Ti–Ca treatment, the inclusions in the steel were mainly Al–Si–Mn–Ca–Ti–O composite inclusions, and needle-like titanium oxide inclusions were clearly seen inside the inclusions; the inclusions after Ti–Ce treatment were mainly Ca–Al–O–Ti and Al–Si–Mn–Ce–Ti–O composite inclusions. When using the Ti–Ca/Ce composite deoxidation treatment, the time interval for adding Ti and Ca/Ce alloy should be as short as possible, preferably within 5 min.
- (4)The yield of Ce was higher than that of Ca, and the yield was relatively stable. However, Ca treatment was more conducive to the nucleation of sulphides, thus reflecting the effect of oxide metallurgy. The addition of Ce was prone to adhesion to the crucible wall, which may adversely affect the actual production.
Acknowledgments
This work was supported by the National Basic Research Program, China (No. 2017YFB0305100), Foundation of Hunan Province Science and technology innovation plan (No. 2018XK2301), and Natural Science Foundation of Hunan Province, China (No. 2019JJ60062).
Data availability statement
All data that support the findings of this study are included within the article (and any supplementary files).