
Abstract
Ultrasonic vibration can accelerate the curing of epoxy resin. Previous studies have not clarified the mechanism of ultrasonic vibration for accelerating the curing of epoxy resins. And the mechanical and thermal properties of the adhesive after ultrasonic-accelerated curing have not been clearly analyzed. In this study, the conventional thermal and ultrasonic-assisted curing processes of the bicomponent adhesive 3 M DP420 were characterized by tensile testing, thermogravimetric analysis, differential scanning calorimetry, dynamic mechanical analysis and Fourier transform infrared spectroscopy. The results show that the curing rate of the adhesive can be increased by 50% by ultrasonic pretreatment. The tensile test results show that ultrasonic pretreatment can increase the tensile strength by 30.9%. Pulsed ultrasonic treatment can keep the temperature of the adhesive stable during the pretreatment process, and does not excessively raise the temperature. The thermal analysis results show that pulsed ultrasonic treatment can accelerate the curing process without the loss of mechanical properties or thermal stability. It was observed that the glass transition temperature shifted to a higher value when the curing temperature increased. Ultrasonic vibration promotes mass transfer between the epoxy resin and curing agent and increases the collision probability between the reactants, thus increasing the reaction rate. In addition, it was found that the temperature field has a significant effect on the properties of the adhesive, and medium-temperature curing is more suitable for curing the adhesive.
Export citation and abstract BibTeX RIS

Original content from this work may be used under the terms of the Creative Commons Attribution 4.0 licence. Any further distribution of this work must maintain attribution to the author(s) and the title of the work, journal citation and DOI.
1. Introduction
Unlike mechanical connections, adhesive bonding does not require fasteners, such as screws, bolts, rivets and pins, thus avoiding poor toughness, serious anisotropy, and high notch sensitivity in composites. In addition, bonding has the advantages of uniform stress distribution, good damping properties, resistance to corrosion, gases and liquids. Owing to lightweight requirements, structural adhesives are applied in the primary structure joints of vehicles [1] and aircraft [2]. Epoxy resin has been widely used as the matrix because of its excellent mechanical properties, dimensional stability, thermal stability, low shrinkage and easy manufacturability [3]. Adhesive curing is a costly and time-consuming step, and also affects the fatigue and impact resistance of structures [4].
The study of curing behaviors of adhesives has significant importance to optimize the curing process in manufacturing, which has an improved thermal property of final product. Michel [5] studied the effect of temperature curing conditions on the Tg (glass transition temperature) of epoxy polymers. A higher curing temperature reduces the time required to obtain a higher Tg value. Furthermore, the cooling rate, annealing, and curing pressure also have distinct effects on the Tg values of the resin system [6, 7]. Estrada-Royval [8] proposed a post-curing process to ensure nearly complete curing and achieve stable mechanical properties. They found that a post-curing temperature above Tg contributes to achieving thermal stability of the polymer. Sun [9] and Zhou [10] investigated the relationship between cure rate and degree of cure. Following the auto-catalyzed and nth-order models, the time- and temperature-dependent curing kinetics were effectively predicted.
It is of great significance to study the curing and reaction mechanisms under different curing conditions for the establishment of a curing system in actual production. Accelerating the curing of adhesives can be realized by different methods. The most common method is heating. High temperatures not only shorten the curing cycle, but also increase the crosslinking density, which improves the adhesive temperature resistance, dielectric properties and mechanical properties. Some studies have shown that the effects of external fields, such as ultrasonic [11], microwave [12], radio frequency [13], infrared radiation [14], and alternating magnetic fields [15] can shorten the curing cycle of resins and improve their properties. The external field effect changes the kinetics and mechanism of crosslinking reactions, and changes the network structure and physical properties. Compared with traditional oven heating, the field-assisted curing method can save energy, time and space in the manufacturing process [15].
Ultrasonic vibration has been widely used in polymer modification, auxiliary molding, and practical engineering. Cavitation bubbles are formed under ultrasonic vibration. When the bubbles collapse, a large amount of energy is released, which initiates the chemical and physical reactions of the polymers [16]. Sharma [11] and Mohtadizadeh [17] showed that the application of ultrasound in the curing process of an adhesive can improve the reaction rate and shorten the curing cycle to minutes. Kwan [18] achieved rapid curing of a structural adhesive using pulsed ultrasonic technology and studied its curing mechanism and wettability. Wang [19] and Flora [20] reported that ultrasonic curing promotes resin flow in composite manufacturing, thus improving the interlaminar properties. The increase in the crosslinking density and the homogenization of the crosslinking network through ultrasonic vibration reduces the internal stress of the cured adhesives [21, 22]. Kumar [23, 24] developed an ultrasonic dual mixing (UDM) process, which contributes to the matrix morphology modification and improves the thermal stability of epoxy adhesives. At the same time, the storage modulus processed by UDM shows maximum enhancement compared with the neat epoxy resin. Founier transform infrared (FTIR) spectroscopy was used to determine the crosslinking kinetics of epoxy resin with polyamine adduct [25–27].
Previous studies confirmed that ultrasonic vibration can increase the curing rate and shorten the curing time of the adhesive, but there are few studies on the thermal and mechanical properties of cured adhesives. In this study, we implemented an ultrasonic-assisted oven-heating curing process. Tensile test on ultrasonically pretreated specimens obtained the tensile property, which can describe the tensile fracture toughness of the adhesive. The kinetics of the curing process and gelation of the adhesive were studied using differential scanning calorimetry (DSC) tests. Dynamic mechanical analysis (DMA) and thermogravimetric analysis (TGA) revealed the effects of ultrasonic treatment and temperature on the mechanical characteristics and thermal stability, respectively, of the cured adhesives. FTIR was used to analyze the changes in the functional groups in the reaction process of the epoxy/amine system; thus, the mechanism of ultrasonic accelerated curing was explained. Studies on the curing behavior and thermal properties of epoxy adhesives are benificial for the development and optimization of the curing process, thus improving the production efficiency.
2. Materials and methods
2.1. Materials
The bicomponent adhesive Scotch-WeldTM DP420 Off-White provided by 3 M Corporation was used in this study. Component A of the adhesive mainly contains bisphenol A epoxy resin, and component B mainly contains diethylene glycol bis (3-aminopropyl) ether, 2,4,6-tris (dimethylaminomethyl) phenol, and polyacrylic acid. The mix ratio of components A and B was 2:1 by volume. At room temperature, the viscosity of the adhesive was 4.5 Pas, the worklife was 20 min, and the curing time was 24 h. The main parameters are listed in table 1.
Table 1. Material properties of the adhesive used in this study [28].
| 3 M DP420 Off-White | ||
|---|---|---|
| Young's modulus | 2077 MPa | |
| Poisson's ratio | 0.38 | |
| Shear strength | ASTM D 1002-72 | 31 MPa |
| T-Peel strength | ASTM D 1876-61 T | 1071.5 kg· m−1 |
| Shore D hardness | 75-78 HD |
2.2. Preparation of epoxy adhesive specimens
The specimen preparation scheme is illustrated in figure 1. The adhesive specimens were cured at three temperature levels: room temperature (RT, 20 °C), medium temperature (MT, 60 °C), and high temperature (HT, 150 °C). The curing process was carried out in a heating oven. The heating oven was provided by the Shanghai KunTian Laboratory Instrument Co., Ltd. The optimal curing temperature was selected through experimental analysis and comparison. The curing time was determined using isothermal DSC. The specimens cured at RT, MT and HT were labeled as RTC, MTC and HTC, respectively.
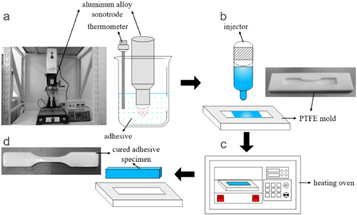
Figure 1. Specimen preparation process diagram: (a) Ultrasonic pretreatment, (b) adhesive injection in the mold, (c) curing in the heating oven, and (d) demolding.
Download figure:
Standard image High-resolution imageThe steps of the ultrasonic pretreatment were as follows. An aluminum alloy sonotrode was partially immersed in the adhesive in a beaker, after which ultrasonic vibration was applied. The MAXWIDE® ME-1800 ultrasonic platform had a rated power of 1800 W and a rated output frequency of 25 kHz. In order to avoid excessive temperature rise, pulsed ultrasonic mode was used, which was applied in a cylce of 2-s load/4-s pause. The ultrasonic vibration duration was 60 s. The adhesive temperature during vibration is shown in figure 2. Within 2 s, the temperature rose rapidly to approximately 80 °C, and was finally maintained at approximately 75 °C. After the pretreatment process, the sonotrode was raised, and the adhesive was injected in a polytetrafluoroethylene (PTFE) mold by a dispenser. Specimens were cured in a heating oven at 60 °C for 30 min. The ultrasonically pretreated specimen was labeled as USP-MTC.
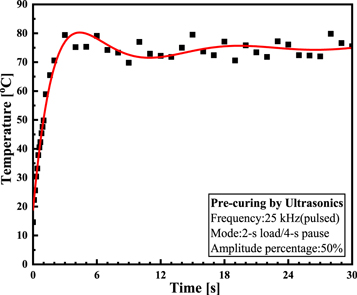
Figure 2. Internal temperature curve of the adhesive under ultrasonic vibration.
Download figure:
Standard image High-resolution image2.3. Tensile test
A universal testing machine (CMT 5205, MTS Systems Co., Ltd.) was used to test tensile strength. According to the ASTM standard D638(V), the tensile test was conducted at a constant crosshead speed (1 mm· min−1) at 20 °C. The tensile strength was determined by the average of three test values.
2.4. Scanning electron microscopy (SEM)
Scanning electron microscopy (SEM) (JSM-IT300, JEOL Ltd., Japan) was used to analyze the cross section of the tensile specimens. The magnification ranged from 5× to 300 000×. To characterize the fracture surface, the specimen was coated with gold and observed by SEM.
2.5. Thermal analysis
2.5.1. Thermogravimetric analysis (TGA)
TGA (TGA55 TA Instruments, USA) was conducted at a heating rate of 10 °C· min−1 under a nitrogen stream. The two components were analyzed in the temperature range of 30 °C–1000 °C, and the cured adhesive was in the range of 30 °C–600 °C. The thermal degradation onset temperature and the thermal degradation weight loss of the specimens were investigated.
2.5.2. Differential scanning calorimeter (DSC)
DSC (214 Polyma NETSCH Group, Germany) was used to measure the heat flow change during the curing process. The test mass was 5–7 mg. An empty aluminum pan with a cover was used as the reference. The DSC experiments were carried out under a nitrogen flow (40 ml· min−1).
2.5.3. Dynamic mechanical analysis (DMA)
The specimens were fabricated into rectangular bars in a PTFE mold with dimensions of 30 mm × 6 mm × 2 mm. DMA analysis was performed using a DMA 8000 (Perkin Elmer). A single cantilever bending mode at a frequency of 1 Hz was used for the analysis. The heating rate was 2 °C· min−1 and temperature range was 0 °C–150 °C.
2.6. Fourier transform infrared (FTIR) spectroscopy
The FTIR spectra of the adhesive in different curing stages were recorded using an intelligent FTIR spectrometer (Nexus 6700, Thermo Nicolet Company, USA). Potassium bromide (KBr) slices were prepared for the spectra. The spectra ranged from 4000 cm−1 to 400 cm−1.
3. Results
3.1. Tensile strength
The tensile specimen and test method are shown in figure 3(a). The maximal tensile strength  is calculated by

where  is the maximal force.
  is the specimen thickness, and
  is the specimen width. The values are shown in figure 3(b).
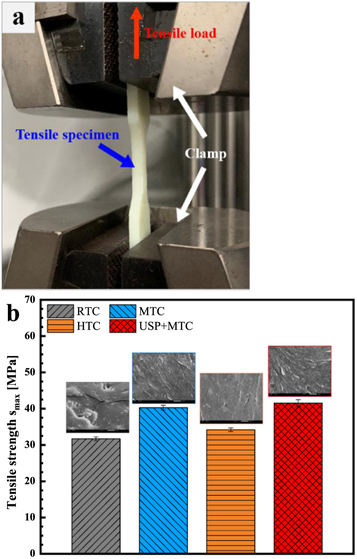
Figure 3. Tensile test: (a) Test setup and (b) tensile strength results and fracture surfaces.
Download figure:
Standard image High-resolution imageThe tensile properties are presented in table 2. The maximal forces of RTC, MTC, HTC, and USP-MTC were 322 N, 410 N, 347 N, and 422 N, respectively. Higher temperatures led to a lower fracture displacement  because of the decreased toughness. Compared with that of RTC, the tensile strength of MTC increased, but the strength of the HTC decreased. USP-MTC showed a maximum enhancement in the tensile strength of approximately 30.9% compared with RTC. The increase of temperature accelerated the crosslinking reaction and its degree, but high curing temperature (150 °C) caused degradation of the epoxy substrate, which decreased the tensile strength [23].
Table 2. Adhesive tensile properties.
| Tensile properties | ||||
|---|---|---|---|---|
 (N) (N) |
 (mm) (mm) |
 (MPa) (MPa) | Increment (%) | |
| RTC | 322 | 2.98 | 31.7 | — |
| MTC | 410 | 2.71 | 40.2 | 28 |
| HTC | 347 | 2.49 | 34.2 | 7.9 |
| USP-MTC | 422 | 2.76 | 41.5 | 30.9 |
3.2. SEM results
Figure 3(b) shows the SEM images of the failure surfaces. The RTC fracture surface was smooth, indicating a typical brittle rupture. Sharp microcracks were observed on the fracture surface, which led to the low tensile strength. The MTC fracture surface was different from that of the RTC. A rough and pitted topography was formed on the MTC surface. This result indicates that MT improves the plasticity of the adhesive. Compared with MTC, HTC showed a smoother fracture surface, indicating brittle fracture. This result can be related to chain scission and elastomer degradation at HT [29, 30]. The USP-MTC fracture mode was similar to that of MTC.
3.3. Thermal properties of the adhesive
3.3.1. Thermostability analysis
Figure 4 shows the TGA results of the adhesive. It can be seen that the component A has high thermal stability, and its mass decreased obviously after approximately 200 °C. High temperature (above 150 °C) led to component B mass loss of more than 2.3%. The thermal degradation behavior was significant. The thermal degradation at HT caused a decrease in tensile strength and fracture toughness. The degradation phenomenon was related to the decrease in crosslinking density and the formation of linear molecules in the network [31].
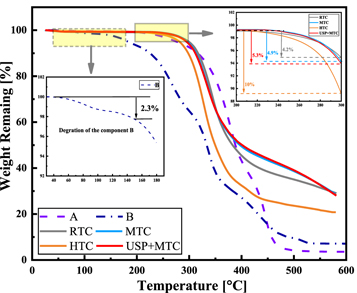
Figure 4. TGA thermogram for components A, B and cured adhesives.
Download figure:
Standard image High-resolution imageThe temperatures for different weight-loss percentages were obtained from the TGA thermograms, as shown in table 3. No significant difference was observed in the initial degradation temperatures. The initial decomposition temperature of the HTC was slightly lower than that of the other specimens. The 50% weight loss for RTC occurred at approximately 383 °C, but higher temperatures of 397 °C and 401 °C were observed for MTC and USP-MTC, respectively. However, from approximately 240 °C, the weight loss rate of the HTC increased, and its thermostability worsened. The weight loss trends in the other three groups were consistent.
Table 3. TGA values for cured specimens.
| Decomposition temperature (°C) | ||||
|---|---|---|---|---|
| Weight loss (%) | RTC | MTC | HTC | USP-MTC |
| 25 | 340.1 | 336.6 | 319.8 | 335.7 |
| 50 | 383.1 | 397.4 | 349.6 | 401.3 |
| 70 | 565.8 | 570.4 | 413.9 | 567.6 |
3.3.2. Curing process analysis
To study the curing reaction behavior of the adhesive, it was subjected to non-isothermal DSC measurements at different heating rates ranging from 5 °C min−1 to 20 °C min−1. The results are shown in figure 5(a). An abrupt drop in heat power at the initial stage was observed because of thermal equilibrium. The curing process is an exothermic reaction because of the crosslinking reaction of the adhesive. The heating range was 20 °C–180 °C. The characteristic parameters (onset temperature  , peak temperature
  , terminal temperature
  and total exothermic reaction heat
  ) can be obtained from the non-isothermal DSC curves. The data are summarized in table 4. Only one exothermic peak is observed during the entire curing process. As the heating rate increased, the peak temperature shifted to a higher value as well as the enthalpy. This behavior can be attributed to the increased thermal effect [32]. The T-β extrapolation was utilized to determine the theoretical curing temperature by fitting the characteristic temperatures at different heating rates β. The theoretical values of
  ,
,  and
and  for the adhesive were 28.775 °C, 69.625 °C and 118.07 °C, as shown in figure 5(b).
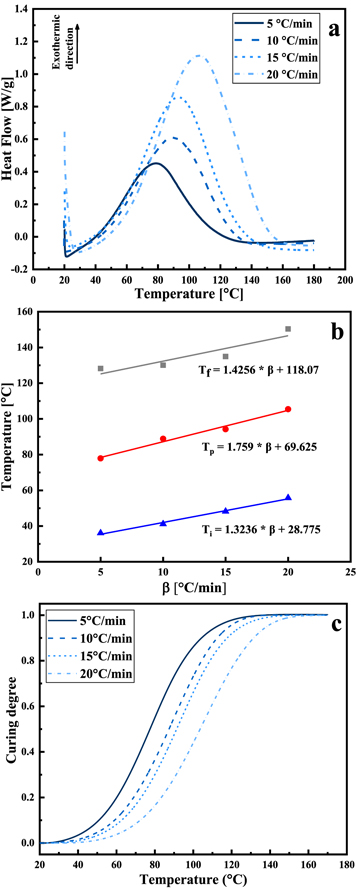
Figure 5. Non-isothermal DSC tests: (a) Heat flow curves at different heating rates, (b) the extrapolated T-β curves, and (c) curing degree versus temperature at different heating rates.
Download figure:
Standard image High-resolution imageTable 4. Characteristic temperatures of the adhesive at different heating rate.
| Heating rate (o C min−1) |
 ( oC) ( oC) |
 ( oC) ( oC) |
 ( oC) ( oC) |
 (oC) (oC) |
 (J· g−1) (J· g−1) |
|---|---|---|---|---|---|
| 5 | 36.08 | 77.91 | 128.2 | 92.12 | 78.6 |
| 10 | 41.18 | 88.87 | 130.1 | 88.92 | 106.9 |
| 15 | 48.23 | 94.23 | 134.9 | 86.67 | 161.1 |
| 20 | 55.79 | 105.44 | 150.4 | 94.57 | 206.0 |
The α-T curves were derived from non-isothermal DSC curves, as shown in figure 5(c). α·is the curing degree, and T is the temperature. The 'S'-shaped curve indicates an autocatalytic reaction. The increased heating rate led to a right shift in the temperature of the maximum curing reaction rate. During the curing reaction, the curing rate first increased and then decreased. The adhesive changed into a gel state as the curing reaction proceeded. It can be observed that the curing rate showed a large increase between 60 °C and 120 °C.
Isothermic tests at 60 °C and 150 °C were carried out, as shown in figure 6(a). In the tests, the heat flow was monitored until the gradient was zero. The adhesive was virtually cured after this time. The curing times at 60 °C and 150 °C were 55.9 and 17.6 min, respectively, but the time of the ultrasonic pretreated adhesive was only 28.4 min Table 5 shows the curing cycles of the different curing schemes from isothermic DSC test results. Compared with the traditional thermal curing, ultrasonic-assisted thermal curing can shorten the curing cycle by 50%.
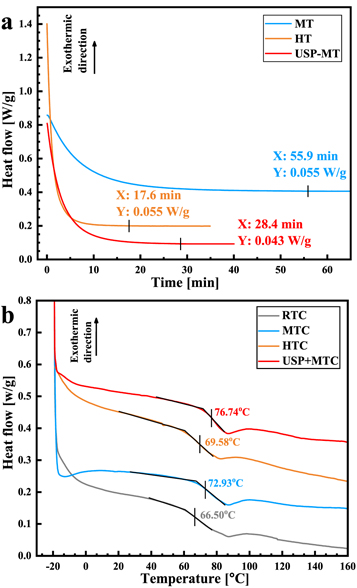
Figure 6. DSC test for (a) Curing times of the adhesives, and (b) Tg values of the cured adhesives.
Download figure:
Standard image High-resolution imageTable 5. Summary of curing cycles utilizing different curing schemes.
| Curing schemes | |||
|---|---|---|---|
| Ultrasonic | Oven heating | Curing cycle | |
| RTC | x | x | 24 h |
| MTC | x | 60 °C/60 min | 60 min |
| HTC | x | 150 °C/20 min | 20 min |
| USP + MTC | 1 min | 60 °C/30 min | 31 min |
Tg value can be used to characterize the thermal stability of the cured specimens. To determine Tg, the heat flow of the cured adhesive specimens was monitored by DSC analysis, as shown in figure 6(b). It is observed that·the Tg values of RTC, MTC, and USP-MTC were 66.5 °C, 72.93 °C and 76.74 °C, respectively. The increase in Tg·indicates that the crosslinking and ordering of the chains increased. The·Tg·value of HTC was 69.58 °C because of chain scission in the crosslinking network at the high temperature.
3.3.3. Dynamic mechanical analysis
Figure 7(a) shows a plot of the storage modulus and loss modulus against temperature for the cured specimens. In the temperature scanning in the DMA test, three states of the adhesive were observed: energy elastic state at low temperatures (0 °C–30 °C), glass transition state at medium temperature (31 °C–80 °C) and entropy elastic state at high temperature (greater than 80 °C). When the state changes from the glass state to the rubber state, the oscillation is mainly converted into internal friction and non-elastic deformation, and the loss modulus also reaches its maximum. The complex modulus E* is the ratio of the stress amplitude to the deformation amplitude, and is calculated by


where E' is the storage modulus, and E'' is the loss modulus. They represent the dynamic elastic properties of the cured adhesive, depending on the frequency and history of the adhesive specimens [33].

Figure 7. Dynamic mechanical properties: (a) Storage modulus (SM) and loss modulus (LM) of the cured specimens, and (b) loss factor of the cured adhesive specimens.
Download figure:
Standard image High-resolution imageCompared with RTC, MTC exhibited a higher storage modulus. The increase in storage modulus at MT can be attributed to the increase in crosslinking. The storage modulus of HTC decreased. This drop in storage modulus indicates an increase in the flexibility of the epoxy system at HT. The movement of molecules and chains has become easier [23, 34].
The damping property of the epoxy adhesive is defined by the ratio of energy dissipation (loss modulus) to energy storage (storage modulus). The loss factor is calculated by

Figure 7(b) shows the loss factor versus temperature. The temperature at the maximum  value is the Tg of the adhesive. The temperature range of
  is used as a criterion to evaluate the damping property of the adhesive [2]. The temperature range for USP-MTC was 54.2° C–72.5 °C, and corresponding peak of
  was 0.79. For RTC, MTC and HTC, the range were 38.3 °C–57.6 °C, 57.1°C –79.4 °C and 45.7 °C–65.1 °C, with corresponding peaks of 0.58, 0.78, and 0.73. The right shift of the temperature range indicates that the adhesive cured at MT has a better damping property.
The Tg value measured by the DMA test showed the same trend as that measured by the DSC test. Compared with the Tg values measured by DSC, the values measured by DMA were lower. This difference is due to the excitation frequency used in the DMA test. The maximal Tg value (69.3 °C) was found for MTC. The RTC showed a lower value of 49 °C. The increase in temperature intensified the intermolecular movement and increased the collision between functional groups, thus increasing the crosslinking degree. HTC showed a lower value of 51.7 °C, because high temperature caused scission of the chain in the crosslinking network, resulting in adhesive aging [1, 34]. USP-MTC showed a value of 65 °C, indicating performance similar to that of MTC.
3.4. Mechanism of ultrasonic accelerated curing
3.4.1. Epoxy-amine curing reaction model
In the curing reaction of the bisphenol A epoxy resin-amine system, the epoxy group and primary amine are gradually consumed to form secondary amines, tertiary amines, and hydroxyl groups. The curing reaction includes three steps. In the first step, an epoxide ring  reacts with a primary amine
  to produce
  , which includes a secondary amine and a hydroxyl group. Second, the secondary amine in the formed product can also react with the epoxy group to produce
  , and thus a tertiary amine and a hydroxyl group are formed. The third possible step is etherification between the hydroxyl group
  and epoxy group, and the reaction product is
  . A tertiary amine connects two straight chains with the N to form a branched structure, so that the tertiary amine content mainly determines the crosslinking degree [26, 35, 36].
3.4.2. FTIR analysis of the curing process
Figure 8 summarizes the partial FTIR spectra during the curing process at 60 °C and the ultrasonic pretreatment process. Compared with the spectrum of the uncured adhesive, a decrease in the epoxy group (-CH(O)CH-) and the amine group (N-H), and an increase in the hydroxyl group (–OH) are observed in the cured adhesive. The peak at 914 cm−1 is attributed to the stretching vibration of the epoxy group [37]. The peaks at 3305 cm−1 and 3361−1 are due to the stretching vibration of N-H. Because of the hydroxyl group (–OH) formation, a characteristic peak at 3423 cm−1 is observed. The peak at 1607 cm−1 was caused by stretching vibration of the aromatic ring, which did not participate in the curing reaction. Compared with those of the thermally cured specimen, the positions of the characteristic absorption peaks of the ultrasonically pretreated specimen did not change. This means that ultrasonic treatment did not change the chemical structure of the adhesive.
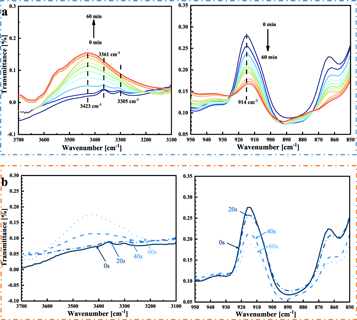
Figure 8. Partial FTIR spectra of the adhesive at (a) curing temperature of 60 °C and (b) ultrasonic pretreatment stage.
Download figure:
Standard image High-resolution imageAccording to the above reaction introduced in section 3.4.1, the ring-opening addition reaction between the epoxy group and amine group produces a hydroxyl group. The decrease in the epoxy group and the increase in the number of hydroxyl groups determine the conversion of the epoxy group into the corresponding polymer, as well as the crosslinking process [27]. OMNIC software (version 9.2) was used to analyze the FTIR results. The peak at 1607 cm−1 (stretching vibration of the aromatic ring) can be used as a benchmark for calculating the absorbency of the epoxy groups according to ISO 20368:

According to equation (6), the epoxy conversion versus time curves at different temperatures was obtained, as shown in figure 9. The increase in temperature not only accelerated the crosslinking reaction rate, but also increased the crosslinking degree. Curing degrees of 92.66%, 94.62% and 96.33% were found at 60 °C, 80 °C, and 100 °C, respectively. As the temperature increased, the slope of the curve increased, indicating an increase in the crosslinking rate. The results show that the curing reaction was completed within 60 min at a curing temperature of 60 °C. This result was consistent with that of the isothermal DSC test. The crosslinking rate was accelerated under the ultrasonic vibration. The epoxy conversion reached 47.5% within 1 min (figure 9).

Figure 9. Conversion of the epoxy functional group in the adhesive followed by FTIR spectroscopy.
Download figure:
Standard image High-resolution image
During the thermal curing process, the consumption rate of the epoxy group was much lower. Ultrasonic vibration promotes mass transfer between the epoxy resin and the curing agent and increases the collision probability between the reactants, thus increasing the reaction rate [25, 26]. During the ultrasonic pretreatment process, the non-thermal effect of the ultrasonic treatment greatly increases the epoxy-amine reaction rate.
4. Conclusions
In this study, ultrasonic vibration was used to accelerate the curing process. The effect of ultrasonic vibration and temperature on the mechanical and thermal properties of the adhesive was clarified. The main conclusions of this study are as follows:
- 1.Ultrasonic vibration accelerates the curing process. First, the adhesive was pretreated by the ultrasonic. Second, the adhesive was injected in the mold by a dispenser and cured in a heating oven with a temperature of 60 °C. Thermal curing at 60 °C for 1 h was conducted for comparison. The curing rate was increased by approximately 50% by the ultrasonic process. The mechanical and thermal properties were preserved. This process can shorten the bonding process and improve production efficiency.
- 2.Tensile tests showed that the curing temperature had a significant effect on the mechanical properties of the adhesive. Compared with curing at RT, the tensile strength increased by 30.9% by a combination of ultrasonic and thermal curing.
- 3.The relationship between crosslinking time and the degree of resin crosslinking was investigated using FTIR. Ultrasonic vibration promotes mass transfer between the epoxy resin and curing agent and increases the collision probability between the reactants, thus increasing the reaction rate.
- 4.The pulsed ultrasonic pretreatment process can ensure that the temperature of the system does not increase by adjusting the pulse width of the ultrasonic beam for different materials. The stable temperature avoids thermal degradation, heat stress, and other problems of the polymer and prevents performance loss.
Acknowledgments
The authors would like to acknowledge the financial support from the National Natural Science Foundation Council of China (grant numbers 51775398, 51805392), the 111 Project (grant number B17034), the Program for Innovative Research Team in University of Education Ministry (grant number IRT_17R83), and the Natural Science Foundation of Hubei Province (grant number 2018CFB595).
Data availability statement
All data that support the findings of this study are included within the article (and any supplementary files).