
Abstract
Al–Li alloy offersa great advantage over traditional alloys and it is the ideal material for today's aerospace industry. Therefore, here we examined the Al–Cu–Li alloy as the third generation of Al–Li alloy. Deformation and heat treatment on the texture and precipitate type and distribution of Al–Cu–Li alloy were studied by mechanical properties test, XRD, and TEM analysis. The effect of texture and precipitate on the plane anisotropy of yield strength was discussed. The results showed thatBrass texture was mainly formed in the deformation process. On the one hand, increasethe pass deformation or cross rolling,the total volume fraction of the texture (S{123}〈634〉, G{011}〈100〉, {011}〈011〉) was increased, which lowered thesheet anisotropy. While on the other hand, the δ' phase precipitated rapidly during solution treatment and easily caused a coplanar slip, increasing plane anisotropy. However, owing to the difference distribution of the aged precipitated T1 on the two group of {111} habit plane, the strengthening effect of the Al–Cu–Li alloy sheet was weak at 45° direction, but stronger atthe rolling direction (0°) and transverse direction (90°).
Export citation and abstract BibTeX RIS

Original content from this work may be used under the terms of the Creative Commons Attribution 4.0 licence. Any further distribution of this work must maintain attribution to the author(s) and the title of the work, journal citation and DOI.
1. Introduction
Compared with traditional 2xxx and 7xxx aluminum alloys, Al–Li alloyis blessed with astonishing properties including its low density, high elastic modulus, high specific strength and stiffness, and good resistance against damage [1–5]. It is one of the most ideal structural materials for the modernaerospace industry [6, 7]. The current research is mainly on the Al Cu Li alloy which is the third generation of Al–Li alloy. Although its properties are superior tothe previous generations, it still exhibits anisotropy. Anisotropic behavior is the most critical shortcoming in the Al–Li alloybecause it has a criticalnegative effect on the final product quality and causes various problems, such as earing [8]. The crystallographic texture is one of the key factors affecting the anisotropy of mechanical properties, particularly the yield strength anisotropy [9–11]. Besides the grain size, morphology, and distribution of precipitates, the orientation relationship between precipitates and matrix is another significant aspect influencing the anisotropy of mechanical properties for Al–Cu–Li alloy [12–14]. Previousfindings revealed that the strong brass texture is easier to develop in the hot deformation Al–Li alloy sheet than other aluminum alloys, which boosts the anisotropy of mechanical properties [15–19]. Recently, some studies reported that the effect of crystallographic texture, pre-stretching before artificial ageing, precipitates on the anisotropic degree [20]. Engler [21] and Vasudevan [22] examined that the texture evolution is related to δ' phase (Al3Li), T1 phase (Al2CuLi), and T2 phase (Al6CuLi3)in Al–Li alloy. The plane slip produced by δ' phase is the reason for the development of a strong brass texture. However, the literature is not sufficient on the evolution of texture, precipitates, and their effect on anisotropy during rolling and heat treatment of the third generation Al–Li alloy. T Dorin [23] quantitative analyzed theT1 phase (Al2CuLi) morphology and strengthening mechanism in an age-hardenable Al–Cu–Li alloy. Z Ye [24] studied the effect of the T6 and T8 treatment on the T1 phase, θ' phase precipitation state, and mechanical properties. J Sun et al [25–27] systematically studied themechanical properties and microstructure evolution of the Al–Cu–Li alloy under T6 or T8 condition. And J Sun [25] analyzed the effect texture and T1(Al2CuLi) phases distributed on strength of the alloy. X Wang [28] examined that effects of coarse T1(Al2CuLi) phase on the hot deformation behavior of Al–Li alloy. The morphology of main precipitates such as δ' phase (Al3Li) [29–31], θ' phase (Al2Cu) [32–34] and T1 phase (Al2CuLi) [35–37] in Al–Cu–Li alloy and their habitual relationship with matrix reflected a clear understanding, which provides a basis for in-depth analysis of texture, precipitation evolution and its effect on the anisotropy of mechanical properties of the alloy during hot working and heat treatment.
The leading goal of this research is to assess the effects of rolling and heat treatment processes on the texture, type, and distribution of precipitates of alloy sheets, and explore the effects of texture and precipitates on the plane anisotropy of the yield strength of alloy sheets, in order to provide a theoretical basis for the microstructure and anisotropy regulation of Al–Cu–Li alloys.
2. Materials and methods
The chemical composition of the alloy was:Cu 2.42, Li 1.49, Mn 0.28, Mg 0.032, Ti 0.026, Zr 0.092, Si 0.015, Al bal(mass fraction,%). The alloy ingot was homogenized at 460 °C for 20hfollowedby 525 °C for 24h in a resistance furnace to eliminate dendrite segregation. The plate rolling hasconsisted of two high irreversible rolling mills, the starting rolling temperature was 430 °C, and the plate was rolled from 40mm to 11mm. Three rolling processes were designed, as presented in table 1.
Table 1. Three rolling processes.
| No. | Number of passes | Pass deformation | Reversing or not |
|---|---|---|---|
| A | 4 | 20%∼32% | No |
| B | 8 | 10%∼20% | No |
| C | 4 | 20%∼32% | Yes. |
The heat treatment was carried out in aresistance furnace, and the temperature difference was controlled as ±2 °C. After Solution treatment (at 490 °C for 1.5 h and then water cooled), the rolled sheet followed by T6 (175 °C) and T8 (160 °C), in which the pre-deformation of T8 was 2%, 6%, and 8%, respectively. The texture was measured by an X-ray diffractometer with Co-Kα radiation and a Fe filter. The tube voltage was 35kV and the tube current was 20 mA. The three-pole diagrams {111}, {200} and {220}, and the corresponding ODF diagram and orientation distribution function were measured. The test plane was the center layer of the plate. The tensile examination was conductedon a universal testing machine at room temperature. The tensile properties were tested in three directions: 0° (rolling direction), 45°and 90° (transverse direction), and an average of eighttested samplesper state were taken. JEM-2010 high-resolution transmission electron microscope was used to observe the transmission. The transmission sample was sliced to 3 mm by wire cutting, then mechanically ground to 50–60 μm, and punched into a Φ3 mm disc. Later,the MTP-1 double jet electrolysis instrument was used for thinning and the parameters were set as;volume ratio of double jet liquid: HNO3:CH3OH=1:3, thinning voltage: 20 mV, current: 50–60 mA, temperature:−35∼−30 °C.
3. Results and discussion
3.1. Theevolution of yield strength anisotropy indexin Al–Cu–Li alloy
The tensile properties and plane anisotropy index(IPA) of yield strengthin Al–Cu–Li alloy after hot-rolling, solution treatment, and T6 treatmentare shownin tables 2–4. IPA [38] was measured by the following equation:
Xmax, Xmid and Xmin are themaximum,middle and mimiumof the three tested direction respectively.
Table 2. Tensile properties and anisotropy index of hot rolled plate.
| Method | Direction | Rm(MPa) | Rp0.2(MPa) | δ(%) | Deviation(Rp0.2) | IPA(Rp0.2) |
|---|---|---|---|---|---|---|
| A | 0° | 274 | 151 | 14.0 | 0.74 | 3.59 |
| 45° | 261 | 144 | 18.2 | 1.51 | ||
| 90° | 270 | 147 | 16.6 | 1.01 | ||
| B | 0° | 303 | 199 | 14.6 | 0.90 | 4.37 |
| 45° | 290 | 189 | 13.9 | 0.36 | ||
| 90° | 295 | 192 | 13.8 | 2.57 | ||
| C | 0° | 283 | 153 | 13.0 | 0.75 | 2.75 |
| 45° | 272 | 146 | 19.0 | 2.07 | ||
| 90° | 282 | 151 | 15.3 | 1.04 |
Table 3. Tensile properties and anisotropy index of solid solution quenched state plate.
| Method | Direction | Rm(MPa) | Rp0.2(MPa) | δ(%) | Deviation(Rp0.2) | IPA(Rp0.2) |
|---|---|---|---|---|---|---|
| A | 0° | 271 | 121 | 21.4 | 1.69 | 4.87 |
| 45° | 253 | 114 | 22.3 | 2.05 | ||
| 90° | 262 | 117 | 23.3 | 1.49 | ||
| B | 0° | 272 | 126 | 19.7 | 1.59 | 5.41 |
| 45° | 251 | 117 | 23.7 | 1.24 | ||
| 90° | 262 | 121 | 22.8 | 2.01 | ||
| C | 0° | 269 | 123 | 20.8 | 1.45 | 3.95 |
| 45° | 257 | 115 | 22.9 | 1.38 | ||
| 90° | 271 | 125 | 17.4 | 0.50 |
Table 4. Tensile properties and anisotropy index ofT6 state plate.
| Method | Direction | Rm(MPa) | Rp0.2(MPa) | δ(%) | Deviation(Rp0.2) | IPA(Rp0.2) |
|---|---|---|---|---|---|---|
| A | 0° | 431 | 355 | 10.4 | 0.24 | 2.40 |
| 45° | 413 | 339 | 9.3 | 1.28 | ||
| 90° | 424 | 357 | 7.5 | 1.48 | ||
| B | 0° | 433 | 361 | 10.4 | 1.27 | 2.58 |
| 45° | 412 | 344 | 9.9 | 0.53 | ||
| 90° | 428 | 360 | 6.4 | 1.64 | ||
| C | 0° | 437 | 355 | 7.4 | 1.32 | 2.07 |
| 45° | 417 | 344 | 8.4 | 1.72 | ||
| 90° | 434 | 353 | 8.0 | 0.97 |
It can be seen from tables 2 and 4 that the strength of hot-rolled sheet with different orientations after different heat treatment processes was in the order of 0° > 90° > 45° and IPA%was in the order of B > A > C, which indicates that increasing pass deformation or cross rolling can reduce the plane anisotropy of yield strength of alloy sheet in varying degrees. Figure 1 demonstrates the plane anisotropy index of yield strength of three kinds of plates after heat treatment. It was observedthat the solution treatment enhanced the plane anisotropy index of yield strength, while the T6 treatment was on the contrary.
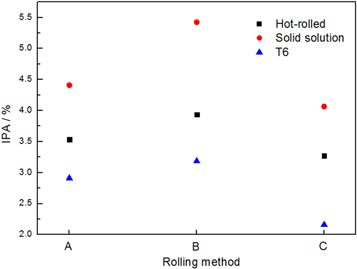
Figure 1. Yield strength anisotropy index of different rolling processes and heat treatmentconditionsof hot rolled and heat-treated alloy sheets, respectively.
Download figure:
Standard image High-resolution imageTable 5 displays the tensile properties and yield strength plane anisotropy index of the sheet rolled by a process after T8 treatment. With the increase of pre-deformation from 2% to 8%, IPA(Rp0.2) of the alloy increased from 2.64% to 6.01%.
Table 5. Tensile properties and anisotropy index of Al–Cu–Li alloy at T8.
| Pre-deformation | Direction | Rm(MPa) | Rp0.2(MPa) | δ(%) | Deviation(Rp0.2) | IPA(Rp0.2) |
|---|---|---|---|---|---|---|
| 2% | 0° | 462 | 404 | 12.2 | 4.04 | 2.64 |
| 45° | 445 | 386 | 11.3 | 0.58 | ||
| 90° | 459 | 401 | 10.2 | 3.46 | ||
| 6% | 0° | 493 | 449 | 10.5 | 1.53 | 3.89 |
| 45° | 472 | 425 | 10.5 | 0.58 | ||
| 90° | 484 | 438 | 9.5 | 1.15 | ||
| 8% | 0° | 503 | 463 | 10.7 | 1.00 | 6.01 |
| 45° | 473 | 431 | 10.2 | 1.15 | ||
| 90° | 481 | 440 | 8.2 | 1.15 |
3.2. The texture and microstructureevolution in Al–Cu–Li alloy
3.2.1. Textureevolution
To analyze the influence of rolling and heat treatment on the anisotropy of the alloy, metallographic structure and texturewereinvestigated on the solid solution plates of different rolling processes, as shown in figures 2–4. The ODF diagram and α, β grain orientation line distribution of hot rolled plates after solution quenching treatment are described in both figures. The difference between A, B, and C rolling processes are not visible clearly, as shown in figure 2. Figure 3 illustratesthat the plates prepared by the A/B/C process mainly formed theBrass texture. Also, S{123}〈634〉, C{112}〈111〉 texture and a small amount of G{011}〈100〉 texture were formed in the A and B process, and a small amount of G texture and {011}〈011〉 texture were formed in C process. Figure 4 indicatesthat increasing pass deformation(A)or reversing rolling(C) changes the orientation density of the main texture components of α and β grain orientation line. Moreover, the total volume fraction of the texture (S{123}〈634〉, G{011}〈100〉, {011}〈011〉〉) was increased,which greatly reduced the anisotropy of the sheet. This is one of theleading causes for the declineof the plane anisotropy index of yield strength.

Figure 2. Effect of solid solution temperature on the metallurgical structure of Al–Cu–Li alloy: (a) A process; (b) B process; (c) C process.
Download figure:
Standard image High-resolution image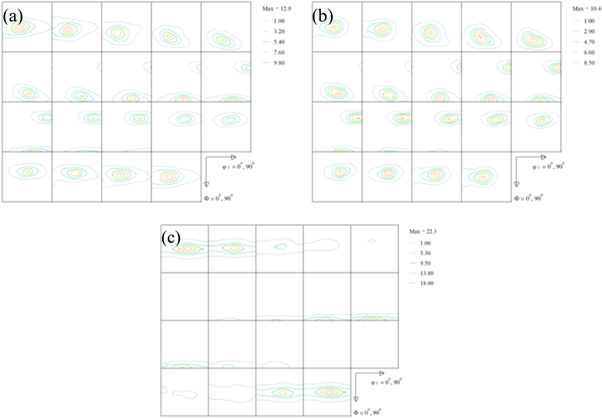
Figure 3. ODF maps of the hot plate after solid solution quenching under different rolling process: (a) A process; (b) B process; (c) C process.
Download figure:
Standard image High-resolution image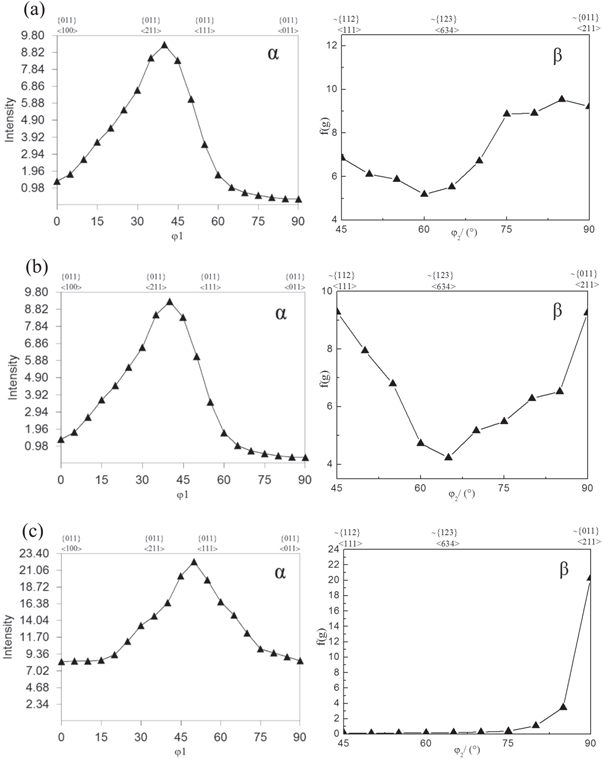
Figure 4. Grain orientation distribution of Al–Cu–Lialloy after solution treatment under different hot deformation conditions: (a) A process; (b) B process; (c) C process.
Download figure:
Standard image High-resolution image3.2.2. Microstructureevolution
The alloy was hot rolled at 430 °C and immediately cooled down by water and the images were taken by TEM and arepresented in figure 5. It can be seen from figure 5 that a large amount of T1 phase has been precipitated, and δ' and θ' phasewere not present in larger amounts. The content of brass texture in a hot rolled plate of Al–Cu–Li alloy is closely related to the T1 phase [39, 40]. The precipitation of the T1 phase during hot deformation may causethe formation of brass texture.
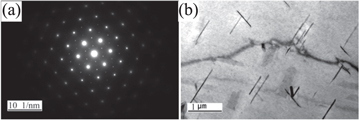
Figure 5. TEM images of Al–Cu–Li alloy deformation at430 °C, B = [110]Al (a) Selected area electron diffraction;(b) Darkfield image of T1 phase.
Download figure:
Standard image High-resolution imageFigures 6 and 7 are theTEM images and selected area electrondiffraction in the Al–Cu–Li alloy after solution-treated at490 °C for 1.5 h and aged at 175 °C for48 h (T6 treatment). In figure 6 all T1 phase precipitated during hot rolling has been dissolved back to the alloy matrix, only δ' phase precipitated in the solution-treated alloy. The δ' phase and matrix have a low mismatch, about 0.08 ∼ 0.3%, and the interfacial energy between them is about 14 mJm−2. Thus, theδ' phasewasprecipitated easily in the solution stage due to the low mismatch and interfacial energy. However, the δ' phase, which is coherent with the matrix,was sliced by dislocations and induces coplanar slip, which limits the deformation of the alloy to a few movable slip surfaces. The slip surfaces were softened and the anisotropy of the alloy plate was raised. After T6 treatment, a large number of T1 and θ' phases precipitateas exhibited in figure 6, and thus consume a large number of Li atoms in the Al solid solution, which results in adecrease in number density of δ' precipitates. Compared with δ' precipitates, T1 and θ' precipitates can impede the dislocation movementmore efficiently, and exhibit a stronger strengthening effect. Thus the precipitation of the T1, θ' and δ' phase results in the decrease of the coplanar slip compared with the solid-solution-treated alloy, reducing the anisotropy index of the alloy, as shown in tables 3 and 4.

Figure 6. Dark field images of δ' phase solution treatment after 490 °C for 1.5 h.
Download figure:
Standard image High-resolution image
Figure 7. TEM images of Al–Cu–Li alloys after 175 °C for 48h aging treatment: (a) Selected area electron diffraction, B = [110]Al; (b) Darkfield image of δ' phasecorresponding to diffraction spot 1; (c), (d) Darkfield images of the T1 variant corresponding to diffraction line 2 and 3, respectively.
Download figure:
Standard image High-resolution imageThe results of TEM analysis of the plate prepared by a process after T8 treatment are demonstrated in figure 8. After T8 treatment, the strengthening phases were still δ', θ' and T1 phases, but T1 phase was the main strengthening phase. With the increase of pre-deformation, the size of the T1 phase graduallydecreased, but the number and density were expanded, and the distribution becomesmore dispersed. The number and distribution of T1 phase nucleation on the four {111} planes depend on the density and distribution of dislocation defects [41, 42]. According to the difference of critical shear stress, four {111} faces can be divided into two groups: 'Vertical plane' and 'Inclined plane', as shown in table 6. The two groups of {111} planes exhibit large difference in dislocation distribution due to the pre-deformation before aging, which led to the discrepancy of the T1 phase on the four {111} planes. The texture component of the three processes was mainly brass texture. If the only brass texture is assumed in Al–Cu–Li alloy, the relationship between {111} four crystal planes and Brass texture is shown in figure 9 [43]. Two {111} planes are perpendicular to the rolling surface, and the other two {111} planes are at an angle of 35.3° with the rolling surface. This orientation relationship urged different {111} faces to obtaininconsistentshear stress during the pre-deformation. The faces with higher shear stress have higher dislocation density and provided more nucleation sites forthe T1 phase; on the contrary, the nucleation sites were less.

Figure 8. TEM images of Al–Cu–Li alloys after T8 treatment: (a) 2% + 160 °C × 24 h; (b) 6% + 160 °C × 24 h;(c) 8% + 160 °C × 24 h; (d) Selected area electron diffraction, B = [110]Al.
Download figure:
Standard image High-resolution imageTable 6. Schmid factor of {111}〈110〉 slip system only containing {110}〈112〉 texture.
| Slip system | Schmid factor | ||||
|---|---|---|---|---|---|
| Calassification of crystal planes | Slip plane | Slip direction | 0° | 45° | 90° |
| Vertical plane | 1–11 | 110 | 0 | 0 | 0 |
| 011 | 0.272 | 0.337 | 0.272 | ||
| −101 | 0.272 | 0.337 | 0.272 | ||
| −111 | 110 | 0 | 0 | 0 | |
| 0–11 | 0 | 0.433 | 0 | ||
| −101 | 0 | 0.433 | 0 | ||
| Inclined plane | 111 | 1–10 | 0.272 | 0.096 | 0.272 |
| 0–11 | 0.408 | 0.060 | 0 | ||
| −101 | 0.136 | 0.036 | 0.272 | ||
| 11–1 | 1–10 | 0.272 | 0.096 | 0.272 | |
| 011 | 0.136 | 0.036 | 0.272 | ||
| 101 | 0.408 | 0.060 | 0 | ||
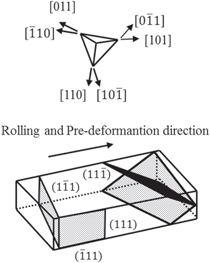
Figure 9. Orientation relationship of between {111} and Brass texture ({011}〈211〉).
Download figure:
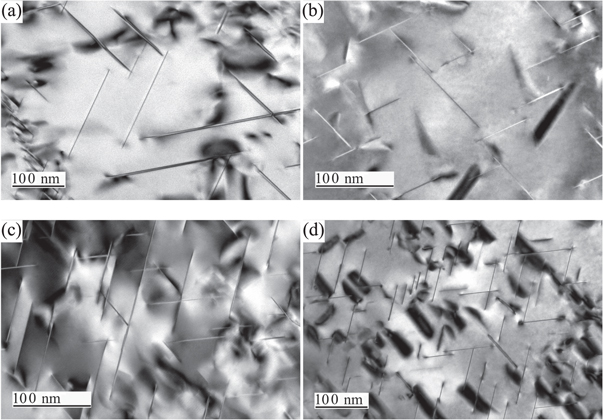
Standard image High-resolution imageIf there is only Brass texture in the plate, the Schmid factors of the slip systems at different orientations are displayed in table 6. The {111} plane inclined to the rolling plane achievedgreater critical shear stress than the vertical plane, which causes the formation of a higher density T1 phase in the aging process of the inclined plane after pre-deformation. The higher the pre-deformation degree, the larger the T1 phase distribution difference on two groups of {111} planes. T1 precipitates shown in figures 10(a), (c) (when thefoil plane is parallel to rolling plane) can be regardedas the ones perpendicular to the rolling plane (designated as 'Vertical plane' type) and those shown in figures 10(b), (d) (when the foil plane is perpendicular to rolling plane) as the ones inclined to rolling plane (designated as 'Inclined plane' type). As can be seen in figure 10 and table 7, there are large differences in the size and density of T1 precipitates between the 'Vertical plane' and 'Inclined plane' types. The density of T1 precipitate formed on the 'inclined plane' {111} planes is higher than that formed on the 'Vertical plane' {111} planes. It is indicated that the T1 precipitates exhibits a more uniformly distributionon the 'inclined plane' {111} planes.
Figure 10. TEM images of Al–Cu–Li alloys after T8 treatment: (a), (b) 2% + 160 °C × 24h; (c), (d) 8% + 160 °C × 24 h; (a), (c) TEM foil plane parallel to rolling direction and (b), (d) TEM foil plane perpendicular to rolling direction.
Download figure:
Standard image High-resolution image
Table 7. Size and density(the average number of T1 phases in five fields of view) of T1 precipitates formed on 'Vertical plane' and 'Inclined plane' {111} planes.
| Vertical plane | Inclined plane | |||
|---|---|---|---|---|
| T8 treatment | T1 density | Length of T1(nm) | T1 density | Length of T1(nm) |
| 2%+160 °C × 24 h | 15 | 220.2 | 20 | 87.4 |
| 8%+160 °C × 24 h | 26 | 94.7 | 41 | 78.5 |
In the process of stretching along the rolling direction (0°), the deformation is mainly concentrated on the inclined plane,and the high-density T1 phase precipitated on the inclined plane. T1 phase can effectively hinder the dislocation movement, resulting in relatively uniform deformation on the plane, and the transverse (90°) stretching also has a similar effect. However, when the stretching occurred along the 45° direction, the shear stress on the vertical {111} plane was higher than that on the inclined plane, and the deformation was concentrated on the vertical plane. Meanwhile, the T1 phase was the main barrier for the dislocation movement on the vertical {111} plane. But, due to the limited number of T1 phases on the vertical {111} plane, there was a coplanar slip. This also revealed that the strengthening effect of T1 is weaker in the 45° direction but stronger in the rolling direction (0°) and transverse direction (90°). As presented in table 5, the tensile strength was lower in the 45° direction, but higher in the 0° and 90° direction. With the rise of pre-deformation, the anisotropy index of yield strength was elevated.
4. Summary
In the current research work, we explored the evolution of texture and precipitates in Al–Cu–Li alloy sheets during different rolling processes(A/B/C) and heat treatment. The mechanism of the effect of texture and precipitation on the plane anisotropy of yield strength was assessed. The main findings of our study are as follows.
- (1)Increasing pass deformation (A) or cross rolling (C) changed the orientation density of main texture components of α and β grain orientation lines, and increased the total volume fraction of the texture (S{123}〈634〉, G{011}〈100〉, {011}〈011〉), which causes to decrease the sheet anisotropy.
- (2)A large amount of T1 phase was precipitated during hot rolling and δ' phase precipitates rapidly during solution treatment. The δ' phase was easily sliced by dislocation, which resulted in a coplanar slip and heightened the plane anisotropy of yield strength.
- (3)The T6 strengthening phase was mainly δ', θ' and T1 phase. The T8 strengthening phase was mainly the T1 phase, and the larger the amount of pre-deformation, the more conducive to the fine precipitation of the T1 phase. The discrepancy distribution of the T1 phase in two group of {111} habit plane causes the weak strengthening effect in 45° direction and the stronger in the 0° and 90° direction.
Acknowledgments
The present work is financially supported by the 'Sponsored by Natural Science Foundation of Henan')(Grant No.202300410005).
Data availability statement
All data that support the findings of this study are included within the article (and any supplementary files).