

Abstract
Choline is employed as cholinergic activity marker in brain tissue in the field of clinical detection of diseases. Although, chromatographic methods and biosensors are the most commonly used techniques for choline detection, there is also an interest in exploring the efficacy of a cost effective non-enzyme based sensor for choline detection. Here, electrochemical sensors based on green synthesized metal oxides (iron (III) oxide nanoparticles) from Callistemon viminalis leaves and flowers extract (Fe3O4NPL and Fe3O4NPF) in combination of functionalized multi-walled carbon nanotube (f-MWCNT) supported on glassy carbon electrodes (GCE/f-MWCNT/Fe3O4NPL and GCE/f-MWCNT/Fe3O4NPF) were fabricated for choline detection. Morphological, structural and optical analysis of the nanocomposites were studied using scanning electron microscopy (SEM), fourier transform infrared spectroscopy (FTIR), X-ray diffractometer (XRD) and ultra violet-visible (UV–vis) spectroscopy accordingly. In contrast, electron transport properties on bare glassy carbon electrode (GCE) and nanocomposite modified electrodes (GCE/f-MWCNT/Fe3O4NPL and GCE/f-MWCNT/Fe3O4NPF) was examined through electrochemical characterization using cyclic voltammetry (CV) and electrochemical impedance spectroscopy (EIS). Electrochemical oxidation of choline was also studied through CV, EIS, square wave voltammetry (SWV) and chronoamperometry (CA). The result proved that f-MWCNT enhanced the reactivity of Fe3O4NP towards choline oxidation with voltammetric limit of detection (0.83 and 0.36 μM) for choline at GCE/f-MWCNT/Fe3O4NPL and GCE/f-MWCNT/Fe3O4NPF electrodes respectively. Designed sensors proved selective, reproducible, stable and applicable for real sample sensing in choline dietary supplements.
Export citation and abstract BibTeX RIS

Original content from this work may be used under the terms of the Creative Commons Attribution 4.0 licence. Any further distribution of this work must maintain attribution to the author(s) and the title of the work, journal citation and DOI.
1. Introduction
Choline belongs to the family of water-soluble quaternary amine (trimethyl-β-hydroxyethyl ammonium), and officially choline is seen by the Institute of Medicine (IOM) as a vital nutrient for human with functions similar to vitamin B [1–3]. Choline is a precursor for neurotransmitter acetylcholine which participates in memory and muscle control, cell membrane signalling and transport of lipids [1, 4, 5]. In the area of clinical detection of diseases such as Parkinson's, Alzheimer's, multiple sclerosis and myasthenia gravis, choline is employed as a diagnostic of cholinergic activity in brain tissue [1, 6, 7]. Choline (Cho) aids the regulation of water transport in and out of the cells (Kidney glomerular) through oxidation process into osmolyte betaine [7, 8]. Choline protects the foetus from environmental abuse such as alcohol that can lead to abnormalities in behaviour, organ structures, foetal loss and congenital disabilities [3, 7]. Choline is obtained via intake of choline-rich food, supplements and de novo synthesis by the human body [2, 3, 7]. However, to sustain proper choline function in the body and meet the requirement established by IOM in lactating mothers (550 mg day−1), pregnant mothers (450 mg day−1), males (550 mg day−1) females (400–425 mg day−1), infants (125–150) and children (200–325 mg day−1), there is a need for dietary supplementation [2, 9–11].
Inadequate choline intake results in organ dysfunction, neural tube defects, increases the risk of cardiovascular disease, cancer, cognitive decline, bone fracture and modification of structures which result to the breaking of deoxyribonucleic acid (DNA) strands [2, 3, 7, 12]. Therefore, there is the need for quantitative detection of choline in food, supplements, body fluids, and tissues. A variety of analytical methods such as radio enzymatic, proton nuclear magnetic resonance (1H-NMR) [13], capillary zone electrophoresis with indirect ultraviolet detection (CE-UV) [14], chromatography [9, 15–20], flow injection analysis with electrochemiluminescence (FIA-ECL) [21], enzyme base chemiluminescence [22, 23], biosensors [4, 6, 24 – 25] and electrochemistry at liquid/liquid interface (ITIES) [26] are use for choline detection. Among these methods, great attention is drawn to chromatography and biosensors. Although these methods are reliable, chromatographic assays are time and labour demanding. Also, chromatographic methods require large volume of eluates and expertise while difficulties in immobilization of enzymes, the costs of enzymes and their instability are associated with biosensors [1, 9, 15, 27–29]. These limitations make both techniques uneconomical for routine analysis.
Unique properties of carbon nanotubes (MWCNT) such as electrocatalytic effect, stability, rapid transport of electrons between biomolecules and surface of electrode, high surface area make them useful for fabrication of sensors [4, 30, 31]. Functionalization of MWCNT improves dispersion feasibility, activates MWCNT surface for efficient application and increases ion-exchange capacity [32–34]. Iron (III) oxide nanoparticles (Fe3O4NP) also known as magnetite have excellent biocompatibility, high surface area to volume ratio and ferromagnetic properties [35]. Thus, Iron (III) oxide nanoparticles in combination of carbon nanomaterials such as multi-walled carbon nanotube and graphene are used by researchers in sensors and catalysis [35–39]. Ferromagnetic nanoparticles possess intrinsic enzyme mimetic properties related to that found in natural peroxidase for choline detection [1]. There is a growing interest in the research of carbon nanomaterials (carbon nanotube, graphene)/metal oxide nanocomposite electrodes due to improved optic, electric and magnetic properties resulting from the synergy between the two materials [34, 40, 41]. Also, CNTs aid and enhance the catalytic activity of metal oxide nanoparticles [34].
This study for the first time, aims at investigating the electron transport (ET) properties of the proposed sensors (GCE/f-MWCNT/Fe3O4NPL and GCE/f-MWCNT/ Fe3O4NPF), their electrocatalytic activity towards choline and their practical applicability in real sample sensing of choline. Developed sensors displayed excellent sensitivity, rapid response, good reproducibility and storage stability when stored under dry conditions. Also, excellent selectivity to choline (0.1 mM) in the presence of 0.1 mM dopamine (DA) and 10 mM ascorbic acid (1000 times the concentration of choline-100 mM) was recorded. Good recoveries were obtained in real samples analysis.
2. Materials and methods
2.1. Reagents and materials
Potassium hexacyanoferrate (III) (K3[Fe(CN)6]) purchased from Sigma-Aldrich, a product of Germany was prepared in 0.1 M phosphate buffer solution (PBS) pH 7.4 using 0.1 M sodium phosphate dibasic (NaH2PO4; 99%) and sodium phosphate monobasic (Na2HPO4; 99%), glass world and LABCHEM, Edenvale, South Africa.; dimethylformamide (CH3)2NC(O)H); methanol (HCOH); 10 mM lithium chloride (LiCl) solution pH 7.3; choline chloride (C3H11CINO); dopamine hydrochloride (C8H11NO2.HCl). All reagents were of analytical grade. Choline dietary supplements (ReVite(R) super B, energy injection fizzy tablet) product of pharma mark South Africa; CDP choline (dietary supplement) manufactured by RT Labs Ltd South Africa were used for real sample analysis. All solutions were prepared using distilled water. Multi-walled carbon nanotube (MWCNT) procured commercially from Aldrich (Multiwall Carbon Nanotubes 773810-25G MWCNTs) was used in this study. The purity of MWCNT is ≥98%, with a 10 nm ± 1nm and 4.5 nm ±0.5 nm outside and inside diameters accordingly and a length of 3–6 μm. Iron (III) oxide nanoparticles were synthesized from Callistemon viminalis (C. viminalis) leaves and flowers extract (Fe3O4NPL, Fe3O4NPF). GCE of 3 mm diameter, silver-silver chloride (Ag/AgCl) saturated with potassium chloride (reference electrode) and a platinum disk (counter electrode).
2.2. Synthesis of iron (III) oxide nanoparticles
Iron (III) oxide nanoparticles (Fe3O4NPL and Fe3O4NPF) were synthesized from C. viminalis leaves and flowers extract. Extracts were mixed in separate beakers with a precursor (0.1 M iron (III) chloride hexahydrate solution) in 1:1 volume ratio following an assay prescribed in the literature [42].
2.3. Functionalization of multi-walled carbon nanotubes (MWCNT)
MWCNT was functionalized by following a prescribed method with slight modification using a mixture of concentrated acid (H2SO4/HNO3; 75:25) in a 3:1 ratio volume [43]. MWCNT (0.5 g) was mixed with 100 ml acid mixture stirred at constant temperature (50 °C) for 30 min and centrifuged. The MWCNT suspension was washed several times with distilled water using a sintered glass until a pH of 7 was obtained and thereafter dried at 70 °C for 12 h.
2.4. Preparation of nanocomposites (f-MWCNT-Fe3O4NP)
A 4.5 mg of Fe3O4NPL and 1.5 mg of functionalized MWCNT (f-MWCNT) were weighed into a glass vial with an addition of 1 ml dimethylformamide (DMF). The combination was ultrasonicated for 24 h at 25 °C and oven dried at 55 °C for 2 h to give f-MWCNT/Fe3O4NPL. Same step was followed in the preparation of f-MWCNT/Fe3O4NPF composite.
2.5. Characterization of nanocomposites
Structural properties of nanocomposites were studied with fourier transform infrared spectroscopy, a product of Opus Alpha-P, Brucker Corporation, Billerica, MA, USA. Ultraviolet visible spectra were obtained with Cary series UV–vis spectrophotometer, 300 UV–vis model, crystalline structures were studied on D8 advance x-ray diffractometer while morphological studies were conducted on a scanning electron microscopy.
2.6. Electrochemical studies
Electrochemical characterization of bare and modified glassy carbon electrodes was carried out using cyclic voltammetry (CV) at scan rate of 25 mVs−1 and electrochemical impedance spectroscopy (EIS) in 5 mM K3[Fe(CN)6] solution prepared in 0.1 mM PBS, pH 7.4 at +0.2 V constant potential between 100 kHz and 0.1Hz frequency range. Electrochemical oxidation of choline was investigated in pH 7.3 lithium chloride solution using CV, EIS (at 0.5 V fixed potential), chronoamperometry (CA) and square wave voltammetry (SWV) at a frequency of 25 Hz. Selectivity studies were conducted using SWV and CA. Voltammetric and chronoamperometric experiment were conducted with an AUTO LAB potentiostat PGSTAT 302 (Eco Chemie, Utrecht, and The Netherlands) powered by the general purpose electrochemical system (GPES) software version 4.9 while EIS experiment was controlled by metrohm AUTOLAB frequency response analyser (FRA 32) controlled by NOVA software version 1.10.1.9.
2.7. Electrode modification
The modified electrodes were prepared by drop-drying method. Prior to the modification, GCE was cleaned by gentle polishing in aqueous slurry of alumina nano powder on a micro cloth pad followed by ultrasonically cleaned in methanol, thereafter in distilled water so as to remove particles of alumina nano powder and obtain a mirror like surface. The electrode was further sonicated in methanol, finally in distilled water and dried at 40 °C for 3 min. Separate suspension of functionalized multi-walled carbon nanotube (f-MWCNT), metal oxide nanoparticles (iron (III) oxide nanoparticles representing Fe3O4NPL and Fe3O4NPF) were prepared by dispersing 0.5 mg MWCNT and 1.5 mg of Fe3O4NP in 5 drops of DMF while suspensions of MWCNT/Fe3O4 nanocomposites were prepared by mixing 1.5 and 0.5 (mg) of Fe3O4NP and MWCNT sequentially in 0.5 ml DMF. The various suspensions were stirred for 24 h at 60 °C and thereafter dropped on bare GCE, dried in an oven at 40 °C for some minutes to give GCE/f-MWCNT; GCE/Fe3O4NPL; GCE/Fe3O4NPF; GCE/f-MWCNT/Fe3O4NPL; and GCE/f-MWCNT/Fe3O4NPF electrodes.
2.8. Preparation of real samples
An opened capsule (powder) of CDP choline (citicholine) was dissolved in 2 ml LiCl solution and thereafter diluted 100 times using lithium chloride (LiCl) solution of pH 7.3. Same step was followed in the preparation of super B energy injection fizzy tablet containing choline bitartrate. A 2 ml of the diluted samples were further diluted in 100 ml standard flask and spiked with different concentrations of choline using addition methods. The amount of the analyte (choline) present in each aliquot solution was determined at GCE/MWCNT/Fe3O4NPL and GCE/MWCNT/Fe3O4NPF electrodes using SWV.
3. Results and discussions
3.1. Characterization of f-MWCNT/Fe3O4NP nanocomposites
3.1.1. FTIR studies
FTIR spectra of raw MWCNT, f-MWCNT, and f-MWCNT/Fe3O4 nanocomposites are shown in figure 1 while the observed vibrational bands (cm−1) and their assignment are presented in table 1 [44]. Slight red shifts of O–H, -COOH, and C=O bonds was observed on f-MWCNT spectrum as compared with raw MWCNT spectrum. There was an increased intensity of absorption peaks of O–H, -COOH, and C=O functional groups in f-MWCNT spectrum which could be attributed to increase number of these groups on MWCNT surface after functionalization as shown in figure 1(a). In figures 1(b) and (c), the red and blue shifts of distinct major peaks found in the f-MWCNT spectrum and the presence of new peaks around 553 − 1214 cm−1 in nanocomposites spectra, is an evidence of successful formation of f-MWCNT/Fe3O4NP composites (f-MWCNT/Fe3O4NPL and f-MWCNT/Fe3O4NPF).
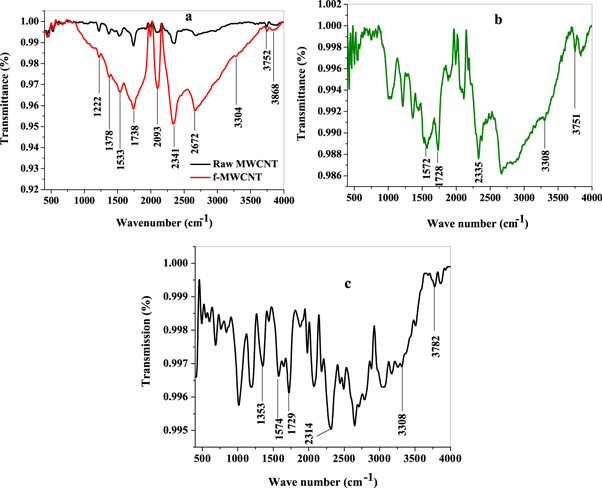
Figure 1. FTIR spectra of (a) Raw MWCNT and f-MWCNT (b) f-MWCNT/Fe3O4NPL and (c) f-MWCNT/Fe3O4NPF respectively.
Download figure:
Standard image High-resolution imageTable 1. Summary of the FTIR vibrational bands.
| Raw MWCNT | f-MWCNT (cm−1) | f-MWCNT/Fe3O4NPL (cm−1) | f-MWCNT/Fe3O4NPF (cm−1) | Assignment |
|---|---|---|---|---|
| 3743 | 3772* | 3751 | 3782 | Free hydroxyl group O-H |
| 3298 | 3304* | 3308 | 3308 | O-H stretch mode from carboxyl groups (O=C-OH and C-OH) |
| 2351 | 2341* | 2335 | 2314 | O-H stretch from strongly hydrogen–bonded-COOH |
| 1735 | 1738 | 1728 | 1729 | Stretching vibration of carboxylic group (C=O) |
| 1510 | 1533* | 1572 | 1574 | Carboxylate anion (COO−) stretch vibration |
| 1370 | 1378 | 1354 | 1353 | Bending deformation in carboxylic groups (-COOH) due to the formation of CN bond in amino functional group. |
Major peaks represented by asterisk (*).
3.1.2. Ultraviolet visible (UV–vis) spectroscopic studies
Strong absorption bands at 296 and 294 nm were noticed in the UV–vis spectra of f-MWCNT/Fe3O4NPL and f-MWCNT/Fe3O4NPF accordingly (figure 2). There was no significant change in the absorption bands of the nanocomposites (MWCNT/Fe3O4NPL and f-MWCNT/Fe3O4NPF) with that of nanoparticles alone (Fe3O4NPL = 297; Fe3O4NPF = 304 nm) reported in our previous work [42], suggesting that Fe3O4NP entrapped in f-MWCNT retained its vital conformation, and has been successfully adsorbed on f-MWCNT [45].

Figure 2. UV–vis spectra of the nanocomposites.
Download figure:
Standard image High-resolution image3.1.3. X-ray diffraction studies
Figure 3 to (c) represents the XRD pattern of f-MWCNT and nanocomposites (f-MWCNT/Fe3O4NPF and f-MWCNT/Fe3O4NPL) respectively conducted from 18° to 70° at 2 theta. Characteristics diffraction peaks of f-MWCNT at the position of 25.69° and 53.79° indexed to 100 and 004 reflections disappeared in the XRD pattern of f-MWCNT/Fe3O4NPF and f-MWCNT/Fe3O4NPL which could be due to overlap of peaks in the nanocomposite by Fe3O4NP peaks [46]. It also suggest successful adsorption of Fe3O4NP on f-MWCNT which is also confirmed by the absence of the broad hump observed in the XRD pattern of Fe3O4NPL and Fe3O4NPF at 28.56° and 26.62° respectively reported in our previous work [42].
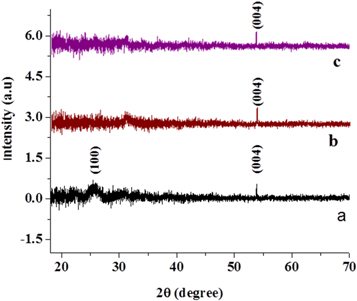
Figure 3. XDR pattern of (a), f-MWCNT (b), f-MWCNT/Fe3O4NOF and (c) f-MWCNT/Fe3O4NPL.
Download figure:
Standard image High-resolution image3.1.4. SEM studies
Figure 4(a)–(c) represents the morphology of SEM images of f-MWCNT, f-MWCNT/Fe3O4NPL and f-MWCNT/Fe3O4NPF accordingly. The micrograph showed the attachment of Fe3O4NP particles on f-MWCNT surface and the formation of inter particle agglomeration by Fe3O4NP due to the inter particle magnetic force [47].
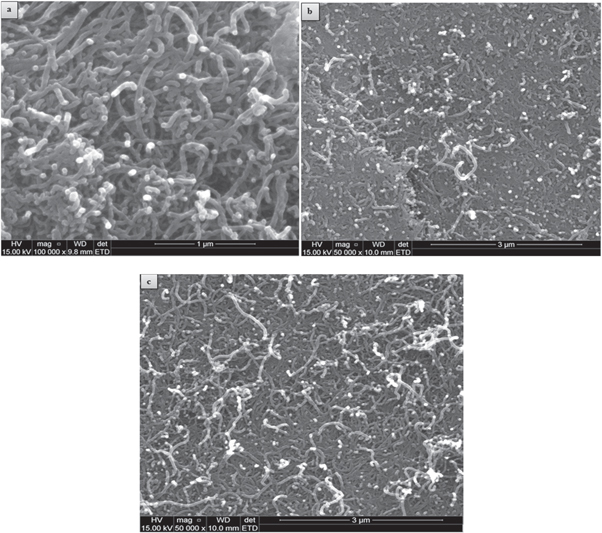
Figure 4. Scanning electron microscopic images of (a) f-MWCNT (b) f-MWCNT-Fe3O4NPL and (c) f-MWCNT-Fe3O4NPF.
Download figure:
Standard image High-resolution image3.2. Electrochemical studies
3.2.1. Electrochemical properties of MWCNT and f-MWCNT
Cyclic voltammetry was used to investigate the electrochemical properties of raw multi-walled carbon nanotube (MWCNT) and functionalized multi-walled carbon nanotube (f-MWCNT) doped on glassy carbon electrodes (GCE/MWCNT and GCE/f-MWCNT). Figure 5 shows the cyclic voltammograms of unmodified glassy carbon electrode (GCE) and modified electrodes (GCE/MWCNT and GCE/f-MWCNT) in 0.1M phosphate buffer solution (PBS) of pH 7.4 containing 5 mM K3[Fe(CN)6] at scan rate of 25 mVs−1. Redox peaks were observed in all the electrodes with peak-potential separations (∆Ep) of 0.081, 0.064, and 0.086 V for GCE, GCE/MWCNT and GCE/f-MWCNT respectively. Obtained ∆Ep values are greater than the theoretical value (0.059 V) expected for a fast one—electron transport. Also, the anodic current response observed at GCE/f-MWCNT was 2.1 and 3.5 times greater than GCE/MWCNT and GCE accordingly. This proved that GCE/f-MWCNT has faster electron transport property and a larger electroactive surface area compared with GCE and GCE/MWCNT. Thus, f-MWCNT was employed in the experiments. Current response of the electrodes follows the order: GCE/f-MWCNT (82.22 μA) > GCE/MWCNT (38.42 μA) > GCE (23.34 μA).

Figure 5. Comparative cyclic voltammograms of bare and modified electrodes recorded at 25 mVs−1 scan rate in 5 mM K3[Fe(CN)6] solution prepared in 10 mM PBS (pH 7.4).
Download figure:
Standard image High-resolution imageThe effect of potential scan rate (v) in the range of 25–300 mVs−1 on the electrochemical properties of GCE/MWCNT and f-MWCNT was studied by cyclic voltammetry in 5 mM K3[Fe(CN)6] solution prepared in 10 mM PBS (figures 6(a) and (b)). Plots of anodic and cathodic peak currents versus square root of scan rate (v1/2) displayed a linear relationship with 0.99 regression coefficients at both modified electrodes as shown in figures 6(c) and (d), indicating a diffusion controlled redox process. The electrochemical active surface area for GCE/MWCNT and GCE/f-MWCNT was found to be 0.148 and 0.322 cm2 accordingly employing Randle-Servcik equation (equation (1)) from the slope value of the linear plots shown in figures 6(c) and (d).

Where Ip = Peak current in ampere, n = is the number of electron transferred, α = Charge transfer coefficient, A = surface area of the electrode (cm2), C = Concentration of the analyte (molcm−3), D1/2 = gas constant (Jmol−1 K−1) and V1/2 = Square root of scan rate (v/mVs−1)1/2.
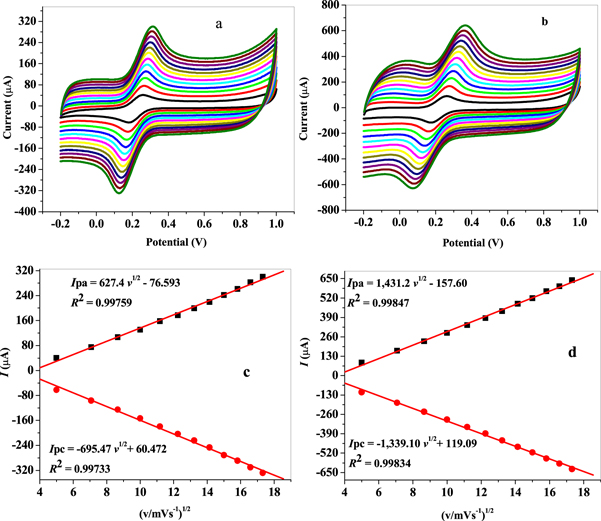
Figure 6. Cyclic voltammograms of (a) GCE/MWCNT and (b) GCE/f-MWCNT) in 5 mM solution prepared in 0.1 PBS (scan rate: 25–300 mVs−1; inner to outer); linear plots of peak currents versus square root of scan rate.
Download figure:
Standard image High-resolution imageThe values of electrochemical active surface area for GCE/MWCNT and GCE/f-MWCNT agreed with the experimental result in figure 5.
3.2.2. Electrochemical characterization of f-MWCNT/Fe3O4NP using cyclic voltammetry
The investigation of charge transfer properties of bare GCE, GCE/f-MWCNT, GCE/Fe3O4NPL, GCE/Fe3O4NPF and the nanocomposite modified (GCE/f-MWCNT/Fe3O4NPL, and GCE/f-MWCNT/Fe3O4NPF) electrodes was carried out by cyclic voltammetry in 5mM K3[Fe(CN)6] solution prepared in 0.1 M PBS, pH 7.4 at 25 mVs−1 scan rate. The voltammograms obtained over a potential window of −0.2 to 1. 0 V with 0.02 V step potential is shown in figure 7. GCE/f-MWCNT/Fe3O4NPL and GCE/f-MWCNT/Fe3O4NPF electrodes gave greater current response compared to other electrodes investigated which is attributed to a successful modification of the nanocomposites electrodes and good synergy between f-MWCNT and Fe3O4NP. However, electron transport properties were optimal at GCE/f-MWCNT/Fe3O4NPL than GCE/f-MWCNT/Fe3O4NPF considering its current response which was approximately twice higher. Sequential order of oxidation peak current response of the electrodes is; GCE/f-MWCNT/Fe3O4NPL (74.3 μA) > GCE/f-MWCNT/Fe3O4NPF (44.1μA) > GCE/f-MWCNT (27.7 μA) > GCE (17.3 μA). The ratio of anodic to cathodic peak current response (Ipa/Ipc) for GCE/f-MWCNT/Fe3O4NPL and GCE/f-MWCNT/Fe3O4NPF electrode was calculated to be 1.05 and 1.14 respectively which is greater 1. Peak potential separation (∆Ep) values of 163 and 102 mV were obtained at the respective nanocomposite modified electrodes which are greater than the theoretical value (59 mV) for a fast one-electron transport, indicating a quasi reversible reaction at the electrodes [48, 49].
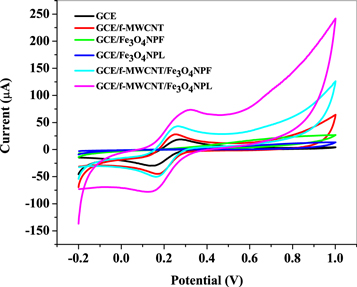
Figure 7. Comparative cyclic voltammogram of bare GCE, and modified electrodes in 5 mM K3[Fe(CN)6] solution prepared in 10 mM PBS.
Download figure:
Standard image High-resolution image3.2.2.1. Effect of varying scan rate at GCE/f-MWCNT/Fe3O4NP electrodes
The influence of scan rate on the redox process of the nanocomposite modified electrodes surface was studied by CV (cyclic voltammetry) in 5 mM K3[Fe(CN)6] solution in the range of 25–500 mVs−1 potential sweeps. An increase in peak currents with increasing scan rate was noticed as shown in figures 8(a) and (b). Also, anodic and cathodic peak potentials shifted more to the positive and negative values accordingly as scan rate (v) increases. The graph of peak currents ( ) against square root of scan rate (v1/2) gave 0.99213 and 0.9968 regression values for GCE/f-MWCNT/Fe3O4NPL and GCE/f-MWCNT/Fe3O4NPF electrodes as shown in figures 8(c) and (d) respectively, indicating a diffusion controlled process expected for a direct proportional relationship. Using Randles-Sevick equation (equation (1)) the electroactive surface area for GCE/f-MWCNT/Fe3O4NPL and GCE/f-MWCNT/Fe3O4NPF was found to be 0.15 and 0.32 cm2 respectively.
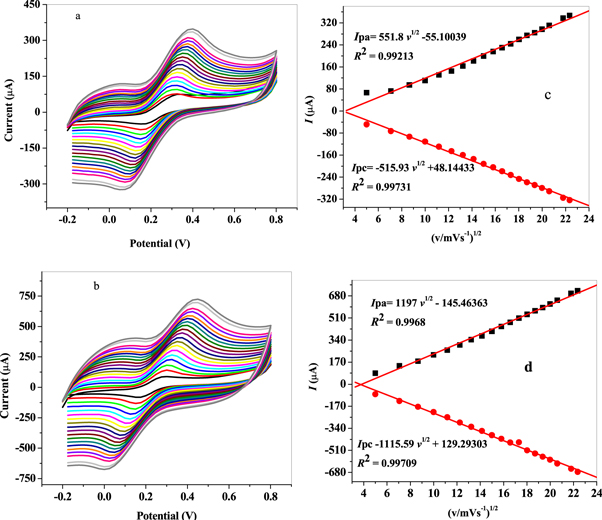
Figure 8. Cyclic voltammograms of (a) GCE/f-MWCNT/Fe3O4NPL and (b) GCE/f-MWCNT/Fe3O4NPF (scan rate: 25–500 mVs−1; inner –outer); linear plot of Ip versus square root of scan rate (v1/2) in 5 mM K3[Fe(CN)6] solution prepared in 0.1M M PBS.
Download figure:
Standard image High-resolution imageA plot of peak potentials (Ep) against logarithm of scan rate (v) (plot not shown) yielded two straight lines with slope equal to  and
and  assigned to cathodic and anodic peak according to Laviron [50]. Linear equations (2)–(5) were obtained for GCE/f-MWCNT/Fe3O4NPL and GCE/f-MWCNT/Fe3O4NPF electrodes with their corresponding regression coefficients.
GCE/f-MWCNT/Fe3O4NPL


GCE/f-MWCNT/Fe3O4NPF


Based on the slope values, coefficient of electron transferred (α) was calculated to be 0.47 for GCE/f-MWCNT/Fe3O4NPL) and 0.44 for GCE/f-MWCNT/Fe3O4NPF. One number of electron was calculated for the electrodes. Tafel value 'b' was found to be 0.168 and 0.261 Vdec−1 for GCE/f-MWCNT/Fe3O4NPL and GCE/f-MWCNT/Fe3O4NPF accordingly using equation (6).

b values were quite higher than the theoretical value (0.118 Vdec−1) for one-electron process in the rate determining process which could be due to surface adsorption of reactants at the electrode surface [51]. Electron transfer rate constant (ks) for GCE/f-MWCNT/Fe3O4NPL and GCE/f-MWCNT/Fe3O4NPF was found to be 0.09 and 0.29 s−1 respectively using equation (7).

Where; R = gas constant (8.314 Jmol−1 k−1),
A = surface area of glassy carbon electrode
T = operating temperature (298K)
 = potential peak separation (
 )
)
3.2.3. Electrochemical characterization of electrode using electrochemical impedance spectroscopy (EIS)
Further investigation on the process of electron transfer at the electrode-electrolyte surface was carried out by EIS via AUTOLAB FRA 32 PGSTART 302 with NOVA software version 1.10.19 in 5 mM K3[Fe(CN)6] solution in 0.1 M PBS at fixed potential of 0.2 V versus Ag/AgCl, sat'd 3 M KCl in a frequency range of 100 kHz–0.1Hz. Ideal Nyquist plots obtained on fitting are shown in figures 9(a) and (b). Randle's current model of NOVA 1.10.1.9 was used in the fitting of experimental impedance data (figures 9(c) to (e)). Rs is the solution resistance, Rct is electron transfer resistance reflected on the semicircle diameter relating to electron transfer of K3[Fe(CN)6] at the electrode surface [45]. Zѡ is warburg impedance which appeared as a semicircle-infinite linear diffusion [45], Cdl is the double layer capacitance and Q is the constant phase element. Summary of the fitted impedance data is shown in table 2 where x2 is the chi-square. The negative chi-square values and the percentage errors in parentheses confirmed successful fitting of EIS data. A large Rct value of 1402 Ω was obtained for bare GCE at the semicircle while smaller values of 345 Ω and 249 Ω was obtained for GCE/f-MWCNT/Fe3O4NPF and GCE/f-MWCNT/Fe3O4NPL electrodes, suggesting a more rapid electron transport at the nanocomposite modified electrodes which is attributed to good conductivity of functionalized MWCNT acting as an excellent electron conductor between Fe3O4NP and the electrode surface. From the result, electron transport was much easier at GCE/f-MWCNT-Fe3O4NPL electrode which agreed with cyclic voltammetric data.

Figure 9. Obtained Nyquist plot for (a) bare GCE and modified electrodes at fixed 0.2 V potential in 5 mM K3[Fe(CN)6] solution prepared in 0.1 mM PBS of pH 7.4; circuits used for fitting of EIS data (c) [R(Q[RW]—bare GCE (d) [R(C[RC]—GCE/f-MWCNT, GCE/f-MWCNT/Fe3O4NPL and GCE/f-MWCNT/Fe3O4NPF and (e) [R(Q[RC])—GCE/Fe3O4NP.
Download figure:
Standard image High-resolution imageTable 2. Summary of fitted impedance data studied.
| Electrodes | Rs (Ω) | Rct (Ω) | k0 (cms−1) | i0 (A cm−2) | x2 |
|---|---|---|---|---|---|
| GCE | 123 (3.04) | 1402 (4.74) | 1.2 × 10⁻³ | 3.63 | 0.404 |
| GCE/Fe3O4NPF | 132 (2.41) | 22700 (3.67) | 2.4 × 10⁻³ | 7.2 | 0.298 |
| GCE/Fe3O4NPL | 116 (5.89) | 22862 (6.96) | 7.4 × 10⁻⁵ | 0.224 | 0.906 |
| GCE/f-MWCNT | 123 (1.97) | 699 (7.09) | 7.4 × 10⁻⁴ | 2.241 | 0.665 |
| GCE/f-MWCNT/Fe3O4NPF | 148 (1.57) | 345 (14.6) | 4.9 × 10⁻³ | 14.845 | 0.431 |
| GCE/f-MWCNT/Fe3O4NPL | 114 (1.69) | 249 (9.72) | 6.8 × 10⁻³ | 20.601 | 0.502 |
Furthermore, electron transfer rate constant (k0) and exchange current density ( ) for the electrodes was determined using equations (8) and (9) accordingly with estimated values represented in table 2. EIS k0 values were lower than that obtained via cyclic voltammetry (0.09, 0.29 cms−1) for GCE/f-MWCNT/Fe3O4NPL and GCE/f-MWCNT/Fe3O4NPF which could possibly be alluded to a faster overall impedance. The exchange current density was highest at the nanocomposite electrode which correlates with the CV data.


3.2.4. pH influence on the electrocatalytic activity of nanocomposite modified electrodes
The impact of the electrolyte solution pH on the electrochemical behaviour of GCE/f-MWCNT/Fe3O4NPL and GCE/f-MWCNT/Fe3O4NPF electrodes towards choline in 10 mM lithium chloride solution was investigated using cyclic voltammetry with various pH values ranging from 3.1–8.9 with the aim of obtaining the best oxidation peak resolution and utmost sensitivity in choline detection. A negative and positive shift in anodic peaks potentials was noticed with increasing pH of the electrolyte (figures 10(b) and (c)) which suggest that, the redox reaction of choline involves some proton transferred at the nanocomposite modified electrodes [49]. The anodic peak current of choline reached maximum at pH 7.3 as depicted in the histogram and then decreased gradually with increasing pH (figure 10(a)). Therefore, pH of 7.3 was used all through the experiment.
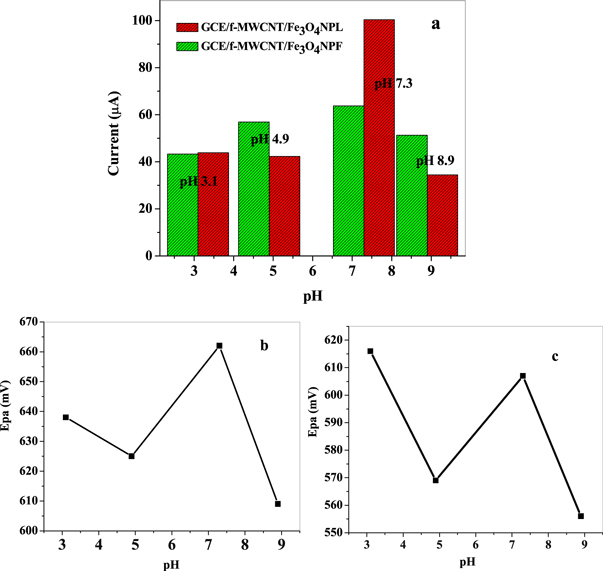
Figure 10. Impact of electrolyte (LiCl) pH on the peak current of 2 mM choline prepared in pH 3.1, 4.9, 7.3 and 8.9 at 25 mVs−1 sweep rate using nanocomposite electrodes. Plots of Epa versus pH obtained for (b) GCE/f-MWCNT/Fe3O4NPL and (c) GCE/f-MWCNT/Fe3O4NPF.
Download figure:
Standard image High-resolution image3.2.5. Cyclic voltammetric study of choline at nanocomposite modified electrodes
The electrochemical properties of bare GCE, GCE/f-MWCNT, GCE/Fe3O4NPL, GCE/Fe3O4NPF, GCE/f-MWCNT/Fe3O4NPL, and GCE/f-MWCNT/Fe3O4NPF (nanocomposite modified) electrodes in 2 mM choline (Cho) solution prepared in 10 mM lithium chloride solution pH 7.3 were studied using cyclic voltammetry at scan rates of 25 mVs-1 (figure 11) over −0.2 to 1. 0 V potential windows and 0.02 V step potential. Redox peak for choline was seen at nanocomposite modified electrodes and absent in metal oxide nanoparticles while bare GCE and GCE/f-MWCNT showed no voltammetric response to choline but a capacitive current. From the cyclic voltammetric experiments, choline oxidation peak current ( ) and potential
  were 0.58 V (47.8 μA) and 0.50 V (41.0 μA) for GCE/f-MWCNT/Fe3O4NPL, and GCE/f-MWCNT/Fe3O4NPF electrodes. Both electrodes had better electrocatalytic response towards the oxidation of choline than other electrodes owing to the electronic conductivity of nanocomposites (f-MWCNT and Fe3O4NP), their interaction with enhanced electrocatalytic properties, their biocompatibility with the analyte (choline) and their high surface area. Figure 12 represents possible electrochemical redox reaction mechanism of choline at nanocomposite modified electrodes.
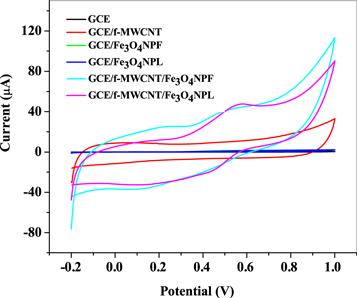
Figure 11. Comparative cyclic voltammogram for unmodified (GCE) and modified electrodes in 10 mM LiCl pH 7.3 containing 2 mM choline.
Download figure:
Standard image High-resolution image
Figure 12. Proposed reaction mechanism for choline oxidation at the surfaces of nanocomposite modified electrodes.
Download figure:
Standard image High-resolution image3.2.6. Effects of varying scan rate at constant choline concentration (2 mM) in LiCl solution
Scan rate has great impact on the redox process of electrode surface. Hence, cyclic voltammograms of nanocomposite modified electrodes (GCE/f-MWCNT/Fe3O4NPL and GCE/f-MWCNT/Fe3O4NPF were recorded in the scan rate range from 25 400 mVs−1 ((figures 13(a) and (b)) in 10 mM LiCl solution containing 2 mM choline (Cho) concentration. Oxidation (anodic) peak currents increased linear with increase in scan rate, confirming a diffusion controlled process (figures 13(a) and (b)) while the peak potentials shifted to the more positive values with increasing scan rate. Disappearance of peak potentials (redox peaks) noticed from 250 mVs−1 scan rate in figure 13(b) could be ascribed to great polarization since the redox reaction potential surpasses the scan potential range [52] and saturation of choline at the electrode [53]. ∆Ep increased at GCE/f-MWCNT/Fe3O4NPL (94–514 mV) and GCE/f-MWCNT/Fe3O4NPF (3.4–474 mV) with variation of scan rate, suggesting a quasi- reversible process [54]. From the cyclic voltammetric result, plot of peak currents (Ip) versus square root of scan rate (v1/2) showed the existence of a linear relationship with regression values of 0.99831 and 0.9958 for GCE/f-MWCNT/Fe3O4NPL and GCE/f-MWCNT/Fe3O4NPF electrodes respectively as can be seen in figures 13(c) and (d). Regression values further confirmed electrochemical process at the modified nanocomposite electrodes to be diffusion controlled. Diffusion coefficient for choline was calculated to be 7.9 × 10⁻⁵ and 1.5 × 10⁻⁴ cm2s-1 for GCE/f-MWCNT/Fe3O4NPL and GCE/f-MWCNT/Fe3O4NPF electrodes accordingly from equation (10).


Figure 13. Cyclic voltammogram for (a) GCE/f-MWCNT/Fe3O4NPL (b) GCE/f-MWCNT/Fe3O4NPF (25–400 mVs−1; inner to outer); linear plots of Ip versus square root of scan rate (v/mVs−1)1/ in 10 mM LiCl pH 7.3 containing 2 mM choline.
Download figure:
Standard image High-resolution imageSurface concentration (Γ) of the electroactive specie (choline) was found to be 0.003 and 0.004 molcm-2 at the respective electrodes using equation (11) from the slope values of peak current ( ) versus scan rate (v) graph represented in figures 14(a) and (b).

n is the number of electrons transferred (1), F is faraday constant (96500 C), A is the surface area of glassy carbon electrode (0.0314 cm2).
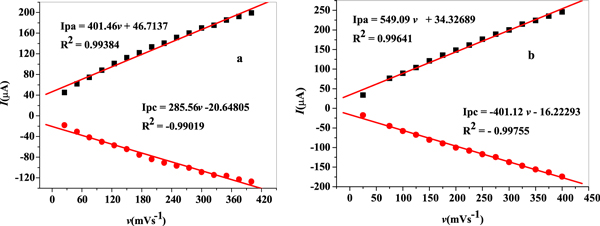
Figure 14. Linear plots of Ipa versus scan rate v(mVs−1) obtained for (a) GCE/f-MWCNT/Fe3O4NPL and (b) GCE/f-MWCNT/Fe3O4NPF in 10 mM LiCl pH 7.3 containing 2 mM choline.
Download figure:
Standard image High-resolution imageFurthermore, from the cyclic voltammetric experiments in figures 13(a) and (b), A plot of  (peak potentials) against natural logarithm (In v) of scan rate yielded two regression straight lines as shown in figures 15(a) and (b) for GCE/MWCNT/Fe3O4NPL and GCE/MWCNT/Fe3O4NPF electrodes respectively. Based on the slope values, charge transfer coefficient (α) for electroxidation of choline was found to be 0.50 and 0.51 for GCE/f-MWCNT/Fe3O4NPL and GCE/f-MWCNT/Fe3O4NPF respectively which is quite close to that (0.52) reported in literature [5]. Number of electrons transferred at the electrodes was calculated to be 1.5 approximately 2 for GCE/f-MWCNT/Fe3O4NPL which supports the number of electrons obtained in the proposed mechanism of choline electroxidation (figure 12). However, number of electron obtained for GCE/f-MWCNT/Fe3O4NPF was 1.3. Electron transfer rate constant (ks) for GCE/f-MWCNT/Fe3O4NPL and GCE/f-MWCNT/Fe3O4NPF electrodes was computed to be 1.7 × 10⁻¹ and 1.7 × 10⁻³ cms−1 accordingly (equation (7)). The disparity in Ks value as well as the number of n could be ascribed to different levels of catalysis at the modified nanocomposite electrodes surface and the electrode materials [55]. Tafel slope (b) values of 163 and 182 mVdec-1 were obtain for GCE/f-MWCNT/Fe3O4NPL and GCE/f-MWCNT/Fe3O4NPF) employing equation (6). The values were quite higher than the theoretical value (118 mVdec-1) which could possibly be attributed to adsorption of choline on the surface of the electrodes.

Figure 15. Linear plots of the peak potential (Ep) and the natural logarithm of scan rate (ln v) for (a) GCE/f-MWCNT/Fe3O4NPL and (b) GCE/f-MWCNT/Fe3O4NPF (scan rate of 25–400 mV s−1) in 10 mM LiCl pH 7.3 containing 2 mM choline.
Download figure:
Standard image High-resolution image3.2.7. Electrochemical Impedance spectroscopic study of choline at modified nanocomposite electrode
Impedance measurement was conducted with metrohm AUTOLAB frequency response analyser (FRA 32) NOVA software version 1.10.1.9 between 100 kHz and 0.1Hz frequency to gain an insight on the electron transfer mechanism and the behavior of the electrode-electrolyte interface during the oxidation of 2 mM choline at constant potential +0.50 V versus Ag/AgCl, single sine wave, and 0.01 V amplitude. Experimental data for GCE/f-MWCNT/Fe3O4NPF and GCE/f-MWCNT/Fe3O4NPL electrodes were successfully fitted with Randle's circuit model same as figure 9(d)-([R(C[RC])] for GCE/f-MWCNT/Fe3O4NPL and GCE/f-MWCNT/Fe3O4NPF, Circuit [R(Q[RC])] as presented in figure 9(e) for bare GCE, GCE/f-MWCNT, GCE/Fe3O4NPL electrodes while [R(R[QC])] was used for GCE/Fe3O4NPF (figure 16(c)). Rct values of bare GCE was 349 kΩ as compared to GCE/f-MWCNT/Fe3O4NPF (0.795 kΩ) and GCE/f-MWCNT/Fe3O4NPL (0.587 kΩ) indicating exchange of electrons to be easier at the later electrode than former and this correlates with the obtained cyclic voltammogram data (figure 11) [4]. The values of the double layer capacitance (Cdl) was higher at GCE/f-MWCNT/Fe3O4NPL (1,040 μF) compared to the bare GCE (605 μF) and GCE/f-MWCNT/Fe3O4NPsF (213 μF) suggesting greater accumulation of charge and better conductivity [4]. The order of electron transfer process is, GCE/f-MWCNT/Fe3O4NPL > GCE/f-MWCNT/Fe3O4NPF > GCE.
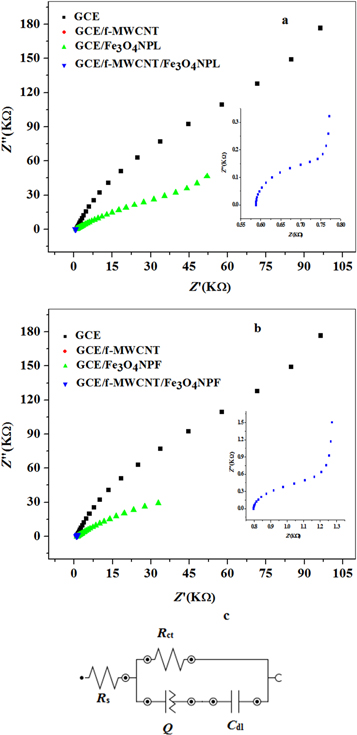
Figure 16. Nyquist plots obtained for (a)–(b) bare GCE and modified electrodes at a fixed 0.5 V potential in 10 mm LiCl containing 2 mM choline and (c) circuit used in the fitting of EIS data.
Download figure:
Standard image High-resolution imageIn addition, estimated electron transfer rate constant of (k0) was found to be 1.99 × 10⁻³ and 3.69 × 10⁻⁵ in cms−1 for GCE/f-MWCNT/Fe3O4NPL and GCE/f-MWCNT/Fe3O4NPL while values of exchange current density  were calculated to be 0.146 and 0.027 Acm-2 for the respective electrodes applying equations (8) and (9) respectively. The magnitude of determined EIS k0 differs with cyclic voltammetry (CV) k0 in cms-1 for GCE/f-MWCNT/Fe3O4NPL (1.7 × 10⁻¹) and GCE/f-MWCNT/Fe3O4NPF (1.7 × 10⁻³) which probably is ascribed to rapid impedance (overall) at the electrode. The value of
  was largest at GCE/f-MWCNT/Fe3O4NPL inferring a more rapid transfer of ions at the electrode which is in agreement with the CV current response.
Further investigations were conducted at GCE nanocomposite modified electrodes since they demonstrated better electrochemical response towards choline.
3.2.8. Square wave voltammetric detection of choline
The sensitivity of the proposed sensors was investigated via concentration study using square wave voltammetry (SWV) technique in 10 mM LiCl solution pH 7.3 over 3 × 10⁻⁷ to 2.2 × 10⁻⁶ M choline concentration range in triplicate from 0.2–0.8 V potential window with 0.005 V, 0.01 V, 25 Hz, 5 s, and +0.58 V versus Ag/AgCl sat'd 3 M KCl potential step, amplitude, frequency, equilibration time and applied potential respectively. The square wave voltammograms obtained for GCE/f-MWCNT/Fe3O4NPL and GCE/f-MWCNT/Fe3O4NPF after subtraction of the supporting electrolyte –LiCl (background current) is presented in figures 17(a) and (b). Choline (Cho) reduction peak currents at 0.43 V increased when series of choline concentrations were added to LiCl solution indicating the reliance of choline reduction peak currents on choline concentration. A linear graph of choline oxidation peak current versus choline concentration was plotted with 0.91795 and 0.9906 regression value obtained at modified electrodes (figures 17(c) and (d)). Detection limit (LoD) of GCE/f-MWCNT/Fe3O4NPL and GCE/f-MWCNT/Fe3O4NPF was 0.83 μM and 0.36 μM using the relationship  Where SD is the standard deviation and m is the slope of same line. Sensitivity of GCE/f-MWCNT/Fe3O4NPL and GCE/f-MWCNT/Fe3O4NPF electrode was 0.107 μA/μM and 0.67μA/μM. The best electrode based on the detection limit was GCE/f-MWCNT/Fe3O4NPF electrode with well-defined peak current. The LoD values were compared with those reported in literature using various electrochemical method and sensors (table 3).
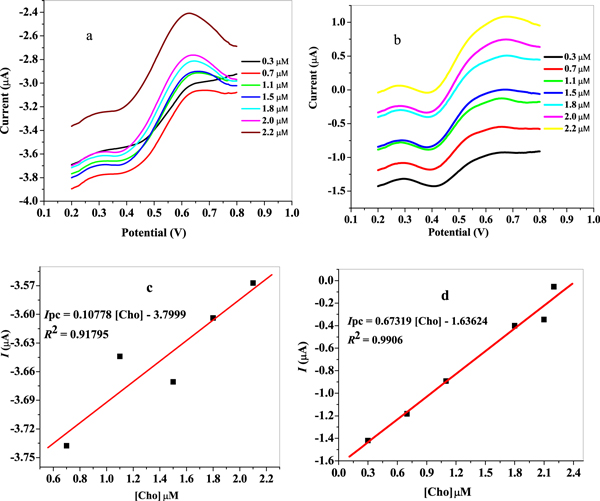
Figure 17. Background subtracted SWVs for (a) GCE/f-MWCNT/Fe3O4NPL and (b) GCE/f-MWCNT/Fe3O4NPF at different choline concentrations (0.3–2.2 μM from down top) in LiCl solution pH 7.3; linear plot of current against choline concentrations for (c) GCE/f-MWCNT/Fe3O4NPL and (d) GCE/f-MWCNT/Fe3O4NPF.
Download figure:
Standard image High-resolution imageTable 3. Comparison of developed sensors with other reported sensors.
| Working electrodes | Methods | Linearity (μM) | LoD ( μM) | References |
|---|---|---|---|---|
| ChO a x/GNP4 b /MWCNT c /GCE d | EIS t | 3–120 | 0.6 | [4] |
| ChOx/MWCNT/Pt e | Amperometry | 5–100 | 0.7 | [25] |
| PVA f /Au g /ChOx/Pt | Amperometry | 20–400 | 10 | [56] |
| ChOx/RTIL h /NH2 i -MWCNT/GCE | Amperometry | 6.9–670 | 2.7 | [31] |
| MCPE j /NiO k | Amperometry | 250–6980 | 25.4 | [5] |
| Nano-W l /GEL/SIM m | DPSV u | 1–100 | 0.92 | [26] |
| Nafion/ChOx/MnO2 n /GCE | CV v | 8 − 1000 | 5 | [24] |
| ChOx/PDDA o )n(PVS p /PAA q )3/MWCNTs/Pt | Amperometry | 5 − 100 | 0.7 | [6] |
| GCE/f-MWCNT/Fe3O4NPsL r | SWV w | 0.3–2.2 | 0.83 | This work |
| Chronoamperometry | 1.19 − 7.45 | 0.16 | ||
| GCE/f-MWCNT/Fe3O4NPsF s | SWV | 0.3–2.2 | 0.36 | This work |
| Chronoamperometry | 1.19–7.45 | 0.05 |
a Choline oxidase b Gold nanoparticles c Multi-walled carbon nanotube, d Glassy carbon electrode e Platinum electrode f Poly vinyl alcohol, g Gold nano rods h Ionic liquid (1-Butyl-3-methylimidazolium) i Amine j Modified carbon pencil paste electrode, k Nickel oxide, l Wire m Silica isoporous membrane n Manganese (IV) oxide o Poly diallyldimethlammonium p Poly vinyl sulphate q Poly allylamine r and s iron (III) oxide nanoparticles synthesized from Callistemon viminalis leaf and flower extract t Electrochemical impedance spectroscopy u ifferential pulse stripping voltammetry v Cyclic voltammetry w Square wave voltammetry.
3.2.9. Chronoamperometric detection of choline
Chronoamperometric technique was also used to determine the applicability of the designed electrode for choline sensing. Figures 18(a) and (b) shows the chronoamperometric response of GCE/f-MWCNT/Fe3O4NPL and GCE/f-MWCNT/Fe3O4NPF electrodes upon stepwise addition of 0.1 mM choline into 10 mM LiCl of pH 7.3 at an applied potential of +0.58 V base on the peak potential obtained from cyclic voltammetry. The decreased in current noticed with increasing choline concentration in the range of 1.19–7.45 μM could be ascribed to the fall in the diffuse layer of analyte (choline) at nanocomposite modified electrode surface. Figures 18(c) and (d) suggests choline response to be linear in the choline concentration range with correlation coefficient values of 0.96138 and 0.98875 at GCE/f-MWCNT/Fe3O4NPL and GCE/f-MWCNT/Fe3O4NPF accordingly. Similar linear response was obtained in literature although with different electrodes [57]. A 0.16 and 0.05 μM LoD with 1.09 and 0.86 μA/μM sensitivity value was obtained at the respective modified electrodes. GCE/f-MWCNT/Fe3O4NPF also proved to be the best electrode considering the LoD value.
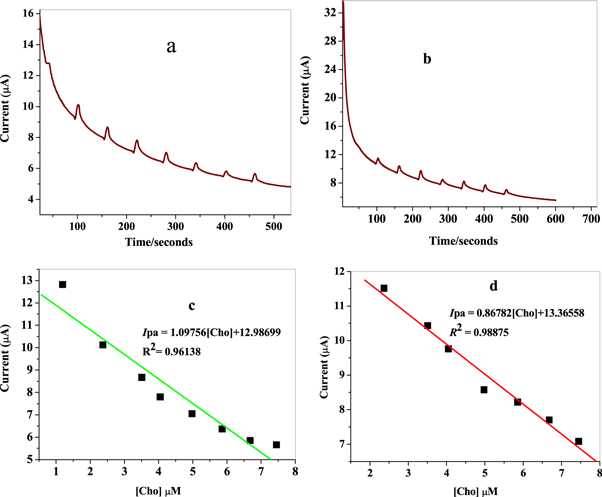
Figure 18. Current-time curve for (a) GCE/f-MWCNT/Fe3O4NPL and (b) GCE/f-MWCNT/Fe3O4NPF upon series of choline addition in 10mM LiCl solution pH 7.3 at + 0.58 V versus Ag/AgCl; linear plot of current against Cho concentration for (c) GCE/f-MWCNT/Fe3O4NPL and (d) GCE/f-MWCNT/Fe3O4NPF.
Download figure:
Standard image High-resolution image3.2.10. Selectivity of designed sensors
The common challenge in the electrochemical detection of choline is the interference from coexisting substances such as ascorbic acid (AA) and dopamine (DA). Selectivity of the designed electrochemical sensors in the presence of these possible interfering species was investigated using square wave voltammetry and chronoamperometry.
Voltammetric response of choline in company of AA and DA was carried out using square wave voltammetry, within −0.2 to 0.8 V potential windows, 0.005 V, 0.01 V, 25 Hz, 5 ss, and +0.58 V versus Ag/AgCl sat'd 3 M KCl potential step, amplitude, frequency, equilibration time and applied potential accordingly in LiCl containing mixtures of 100 mM AA, 0.1 mM choline (Cho) and 0.1 mM DA. Three distinct peaks were observed for AA, DA and Cho at 0.16, 0.31 and 0.40 V accordingly using GCE/f-MWCNT/Fe3O4NPL electrode and 0.10, 0.48 and 0.56 V at GCE/f-MWCNT/Fe3O4NPF shown in figure 19. Peak potentials of AA and DA were found to be more negative than that of Cho. Peak potential separation of 240, 90 and 150 mV between Cho and AA, Cho and DA and DA and AA was estimated at GCE/f-MWCNT/Fe3O4NPL while 460, 80 and 380 mV at GCE/f-MWCNT/Fe3O4NPF electrode, suggesting non-interference of signals. Therefore, the simultaneous detection of choline in existence of AA and DA is possible at the designed sensors.
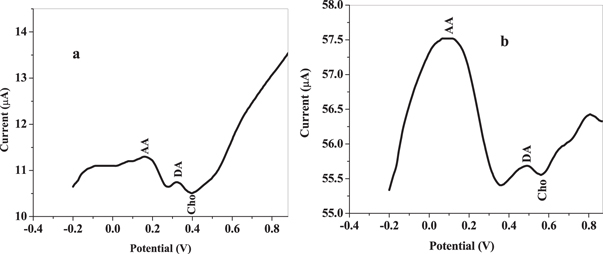
Figure 19. Background subtracted SW voltammogram for (a) GCE/f-MWCNT/Fe3O4NPL and (b) GCE/f-MWCNT/Fe3O4NPF in LiCl containing 100 mM AA, 0.1 mM DA, and 0.1 mM Cho solutions.
Download figure:
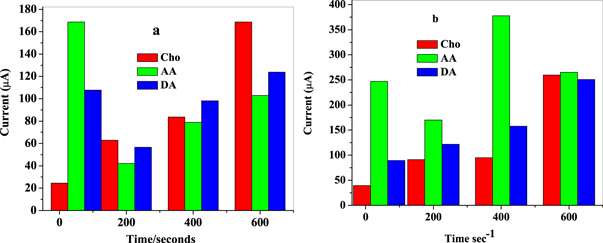
Standard image High-resolution imageChronoamperometric measurement recorded at applied potential set at +0.58 V versus Ag/AgCl at nanocomposite modified electrodes (GCE/f-MWCNT/Fe3O4NPL and GCE/f-MWCNT/Fe3O4NPF) upon successive addition of 1 ml of choline (0.1 mM), AA (100 mM) and DA (0.1 mM) is presented with histogram chart (figure 20). Choline signal was determined prior and after injections each of AA and DA into 10 mM LiCl solution pH 7.3. From the current-time curve represented with a histogram, current response of choline increased significantly after the injection of several concentrations of AA and DA suggesting non-interference of AA and DA signal with that of choline on nanocomposite modified electrodes. It also demonstrates good selectivity of the designed sensor to choline in the presence of AA and DA at the applied potential. However, recovery current was better at GCE/f-MWCNT/Fe3O4NPL compared to GCE/f-MWCNT/Fe3O4NPF.
Figure 20. Histogram from current-time curves for (a) GCE/f-MWCNT/Fe3O4NPL and (b) GCE/f-MWCNT/Fe3O4NPF in 10 mM LiCl pH 7.3 at +0.58 V versus Ag/AgCl at successive injection of 1ml Cho, AA and DA.
Download figure:
Standard image High-resolution image
3.2.11. Reproducibility and stability (storage) of designed sensors
The reproducibility of the electrochemical sensors to 2 mM choline in 10 mM LiCl was determined using cyclic voltammetry. The relative standard deviation (RSD) of the developed sensors was 6.2 and 4.5% respectively for GCE/f-MWCNT/Fe3O4NPL and GCE/MWCNT/Fe3O4NPF for six successive scans at 25 mVs-1 scan rate (graph not shown). The RSD values indicate reasonable reproducibility of the proposed sensors and also the reliability of the sensor. GCE/f-MWCNT/Fe3O4NPF electrode demonstrated better reproducibility than GCE/f-MWCNT/Fe3O4NPsL electrode. Storage stability of the proposed electrochemical sensors (GCE/f-MWCNT/Fe3O4NPL and GCE/f-MWCNT/Fe3O4NPF) was studied by monitoring their response to 2 mM choline in 10 mM LiCl pH 7.3 at intervals of one week using square wave voltammetry technique. The sensors were stored under dry condition when not in use. After two weeks, there was no drop in current response at GCE/f-MWCNT/Fe3O4NPL electrode but rather, an increase of 16.5% while 35% drop was observed at GCE/f-MWCNT/Fe3O4NPF connoting good stability at former than the later electrode.
3.2.12. Analytical application of designed sensors
The feasibility of designed sensors for determination of choline in real samples was demonstrated with pharmaceutical samples (choline dietary supplements); CDP choline (citicholine) and choline bitartrate in super B energy injection fizzy tablet using SWV. Standard addition experiment was conducted by adding known amount of choline standard solution into prepared samples. Choline concentration was evaluated using SWV set at +0.58 V in +0.2–0.8 V potential windows. Table 4 presents the obtained result with % recovery for n = 3 at 95%, indicating that the designed sensors are reliable for determining choline from its drug.
Table 4. Choline detection in pharmaceutical samples at the nanocomposite modified electrodes.
| Sample | Working electrode | Added (μM) | Found (μM) | Recovery (%) | RSD (n = 3) |
|---|---|---|---|---|---|
| CDP choline | GCE/MWCNT/Fe3O4NPF | 29.5 | 29.5 | 100 | 3.02 |
| 44.0 | 46.3 | 105 | 2.91 | ||
| 58.0 | 61.3 | 106 | 3.06 | ||
| GCE/MWCNT/Fe3O4NPL | 29.5 | 23.7 | 80 | 1.60 | |
| 44.0 | 41.6 | 95 | 1.68 | ||
| 58.0 | 60.7 | 105 | 1.75 | ||
| Choline Bitartrate | GCE/MWCNT/Fe3O4NPF | 14.8 | 15.0 | 100 | 1.61 |
| 58.0 | 49.8 | 86 | 1.62 | ||
| 72.2 | 76.6 | 100 | 1.83 | ||
| GCE/MWCNT/Fe3O4NPL | 14.8 | 15.4 | 96 | 0.11 | |
| 58.0 | 67.8 | 116 | 0.09 | ||
| 72.2 | 69.4 | 96 | 0.13 |
The result of t-test, F-test carried out at 95% confidence level signifies there was no significant difference in the result. The Q-test analysis indicated that the outliers (80, 86 recoveries) be retained since Qcal was < Qtab.
4. Conclusion
This work describes the electron transport properties of green synthesized metal oxide nanoparticles-functionalized multi-walled carbon nanotubes composites doped on GCE as well as their electrocatalytic activity towards choline. Metal oxides nanoparticles (Fe3O4NP) were synthesized from Callistemon viminalis leaves and flowers extract (Fe3O4NPL and Fe3O4NPF). From the study, It is shown that the nanocomposite modified electrodes (GCE/f-MWCNT/Fe3O4NPL, GCE/f-MWCNT/Fe3O4NPF) gave better electron transport as well as better choline response compared with other electrodes investigated. Electrocatalysis of choline at the electrodes was a diffusion controlled process. Comparing the modified nanocomposites electrodes, GCE/f-MWCNT/Fe3O4NPF proved to be the best electrode in terms of detection limit and reproducibility while GCE/f-MWCNT/Fe3O4NPL exhibited greater choline oxidation current, selectivity and excellent storage stability. From the selectivity study, square wave voltammetric simultaneous detection of AA (100 mM), DA (0.1 mM), and choline (0.1 mM) showed well resolved signal with peak potential separation of 240, 90 and 150 mV between Cho and AA, Cho and DA and DA and AA was estimated at GCE/f-MWCNT/Fe3O4NPL and 460, 80 and 380 mV at GCE/f-MWCNT/Fe3O4NPF electrode. Significant increase in current response of choline upon several additions of AA and DA was noticed from the interference study using chronoamperometry connoting non-interference of AA and DA signal with that of choline. The designed sensors were successfully applied for direct choline detection in real samples (choline dietary supplements) with good percentage recoveries. The study shows that, the use of electrochemical sensor for choline detection can be explored.
Acknowledgments
OEF, and GEU thanks the North-West University and MaSIM for their financial support and research facilities. OEF acknowledges the National Research Foundation of South Africa (Thutuka) for Research funding with grant holder UID 117009.
Conflict of interest
The authors confirm no conflict of interest.