
Abstract
The weatherability of insulation materials directly affects its thermal insulation performance, so it is necessary to carry out the weatherability experiments for insulation materials. In this paper, three kinds of insulation materials, that is, polyurethane (PUR), foam concrete (FC) and vacuum insulation panel (VIP) are chosen to analyze their thermal conductivity under different kinds of weatherability experiments. For the different kinds of weatherability experiments, the experiments of damp-heat, freeze-thaw, high-low temperature and wet-dry are designed to analyze the thermal conductivity of the insulation materials and the microstructure of insulation materials. The experimental results show that thermal conductivity of FC has a downward trend under the damp-heat experiment, and the thermal conductivity of FC has increased in other experiments. The thermal conductivity of PUR increases in all weatherability experiments, but the thermal conductivity of VIP does not change in all weatherability experiments.
Export citation and abstract BibTeX RIS

Original content from this work may be used under the terms of the Creative Commons Attribution 4.0 licence. Any further distribution of this work must maintain attribution to the author(s) and the title of the work, journal citation and DOI.
1. Introduction
With the proposal of national green energy saving building idea, roof insulation system has become an important part of energy saving building. Insulation materials are important part of the roof insulation system, which can improve the insulation performance for roof insulation system [1–5]. Therefore, insulation materials are widely used in construction engineering, and the thermal conductivity is considered as a kind of physical quantity to reflect material thermal conductivity, which is the most important parameter of thermal insulation materials [6–10]. Nowadays, there are two methods to analyze the weatherability of insulation materials, one is numerical simulation and the other is experimental research [11–14]. For the numerical simulation methods, they can only qualitatively analyze the change law of thermal conductivity of insulation materials [15–17]. Therefore, a large number of experiments are often required to quantitatively study the thermal conductivity of the materials [18, 19]. In this paper, the insulation materials, that is, PUR, FC, VIP, PUR-FC, PUR-VIP, and FC-VIP are tested by five kinds of weatherability experiments, that is, freeze-thaw, damp-heat, wet-dry, high-low temperature, and multi-field coupling. Furthermore, the mechanism of the thermal conductivity change law of the insulation materials is analyzed based on the micro test.
In this paper, three kinds of thermal insulation materials (PUR [20–23], FC [24–26], VIP [27–29]) are used as the research object, and the variation laws of thermal conductivity in different environments are analyzed. Specifically, this article is mainly divided into three parts. The first part introduces the research status of the thermal insulation materials. The second part introduces the basic conditions and experimental methods of the raw materials, which used in the experiment. The third part discusses the change law of the thermal conductivity of the material under freeze-thaw cycle, wet-dry cycle, wet-heat cycle, high-low temperature cycle and multi-field coupling cycle. Further, the pore structure of the material was analyzed by digital photographing, scanning electron microscopy, and infrared spectroscopy to obtain the rule of deterioration of the weather resistance of the material. The main content and conclusions of this article will be elaborated in the fourth part.
2. Materials and laboratory equipment
2.1. Materials
The PUR was produced from Shanghai Huafeng Puen Polyurethane Co., Ltd, which can be seen as figure 1(a); the VIP was produced from Qingdao Kerui., which can be seen as figure 1(b); FC was produced from Shanghai Haotong Building Materials Co., Ltd, which can be seen as figure 1(c); bonded mortar produced from Shanghai Panan Company, which can be seen as figure 1(d).
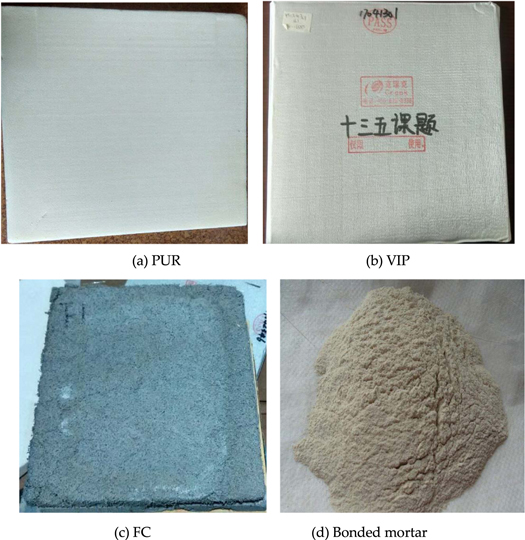
Figure 1. Basic insulation material.
Download figure:
Standard image High-resolution image2.2. Experimental equipment
2.2.1. Determination of thermal conductivity
This paper selects the steady state method to test the thermal conductivity of the insulation material. The thermal conductivity was measured on a single-plate thermal conductivity meter. The instrument model IMDRY300-II was produced from Tianjin Inbel Technology Development Co., Ltd, which can be seen as figure 2.
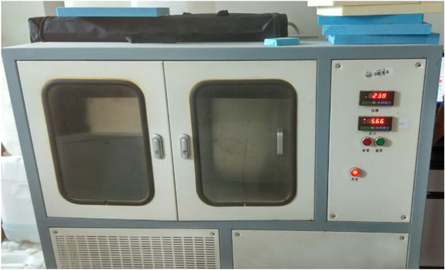
Figure 2. Thermal conductivity tester.
Download figure:
Standard image High-resolution image2.2.2. Control and determination of temperature and humidity
In order to better control the influence of external environmental conditions on the thermal insulation materials, a constant temperature and humidity chamber is an essential experimental instrument. The constant temperature and humidity box was produced from Jiangsu Wuxi Zhongtian for experiment, which can be seen as figure 3.

Figure 3. Constant temperature and humidity box.
Download figure:
Standard image High-resolution image2.2.3. Weather resistance test equipment
When the insulation material has a long time below 0 °C, the moisture in the insulation material will form ice, which will cause expansion and result in cracks and then will destroy the insulation material structure. The repeated drying and wetting of the insulation material will cause the material to swell and shrink, and it will also destroy the insulation material structure. Therefore, the freeze-thaw cycle experiment and dry-wet cycle experiment should be carried out separately for the insulation material. The freezer was produced from Aucma Co., Ltd for experiment, which can be seen as figure 4. And then, the insulation material was placed in a sealed box and soaked in water for 12 h before drying, which can be seen as figure 5.

Figure 4. Freezer.
Download figure:
Standard image High-resolution image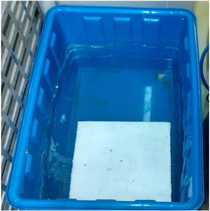
Figure 5. Sealing box.
Download figure:
Standard image High-resolution image3. Weather resistance test
3.1. Change of thermal conductivity under freeze-thaw cycle
The freeze-thaw cycle experiment was carried out according to GB/T 50082-2009 'Standard Test Method for Long-term Performance and Durability of Normal Concrete'. The sample was immersed in water at a temperature of 20 ± 2 °C for 4 days in the early stage of the test. The water level was 30 mm above the upper surface of the sample during the immersion. The freeze-thaw cycle test was then carried out: Then freezer temperature was adjusted to between −18 and −20 °C, and the freezing time of the samples was 4 h. Immediately after the end of the freezing, the samples were transferred to a water tank at a temperature of 18 °C–20 °C to allow them to thaw, where the water level in the water tank was 30 mm above the upper surface of the samples, and the thawing time was 4 h, which was recorded as a freeze-thaw cycle. The result is shown in figure 6.
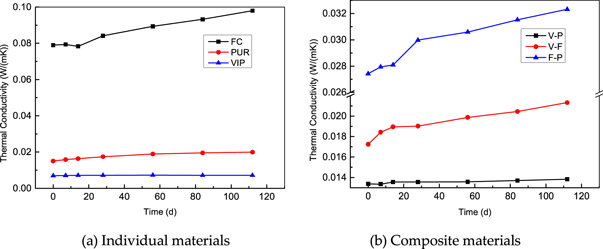
Figure 6. Change in thermal conductivity of materials under freeze-thaw cycles.
Download figure:
Standard image High-resolution imageThe thermal conductivity of FC increases from the initial value of 0.0789 W/(m · K) to 0.0980 W/(m · K) because of the freeze-thaw cycles affect the thermal performance of FC. After freeze-thaw 112 cycles, the FC was collapsed, which can be seen as figure 7. Specifically, a large number of criss-cross cracks appeared on the surface, which not only invalidated the mechanical properties of FC, but also caused the penetration of FC. Cracks undoubtedly become part of the heat flow accumulation, which greatly shortens the heat transfer path of the heat flow inside the FC, reduces the thermal resistance of the FC, and then affects the thermal insulation performance of the FC. From the experimental data, the effect of freeze-thaw cycles on the thermal performance of FC is mainly to improve the thermal conductivity.
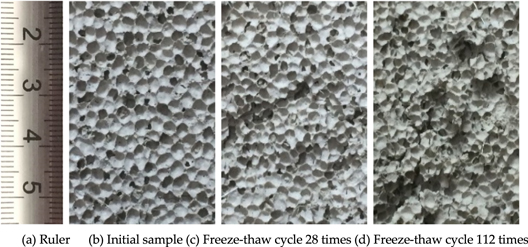
Figure 7. Digital photo of FC under different freeze-thaw cycle.
Download figure:
Standard image High-resolution imagePUR has low thermal conductivity values but have a high rate of change. The effect of freeze-thaw cycle damage to PUR is the same as in FC. The icing expansion of liquid water causes the cell walls to pull and crack. However, the closed cell porosity of PUR is higher, mainly the open pores and the closed pores partially saturated with water through the pore walls are frozen and thawed. Figure 8 shows the scanning electron microscope images of different depths of PUR. As a result, PUR is less damaged by freeze-thaw than FC.

Figure 8. Microscopic of PUR under different freeze-thaw cycle.
Download figure:
Standard image High-resolution imageThe thermal conductivity of the VIP is maintained between 0.007083 and 0.007135 W/(m · K) during the 112 cycle, the rate of change is not high and the thermal performance is basically stable, indicating that the VIP has a good resistance to freezing and thawing cycles ability. Because of the barrier structure of VIP is micron-sized silica. In the state where the surface barrier film is not pierced, the VIP is covered by the barrier film because of its constituent materials, the barrier film has a good gas barrier and moisture barrier effect, and the core material is a chemically stable inorganic material, thereby ensuring VIP can maintain stable quality under freeze-thaw cycles.
3.2. Change of thermal conductivity under the condition of damp heat cycle
The damp and heat environment is constructed in accordance with GB/T 12000-2003 'Determination of influence of plastic exposure to damp heat, water spray and salt spray'. The temperature in the constant temperature and humidity chamber was set to 60 °C and the relative humidity (RH) was 93%. The experiment durations were 7, 14, 28, 56, and 112 days. The average value of the thermal conductivity of the three insulation materials is taken as the measurement results, which can be seen as figure 9.

Figure 9. Change of thermal conductivity of material under the damp-heat cycle.
Download figure:
Standard image High-resolution imageThe value of the FC's thermal conductivity decreased during the damp-heat cycle. The rate of change of the thermal conductivity of 112d was −5.37%. For the FC, on the one hand, the increase of the porosity ratio, the volume ratio of FC, and the thermal conductivity is effectively reduced [30]. On the other hand, the high thermal storage coefficient of FC and the strong capacity of heat storage of the insulation material, which takes a longer period to stabilize the interior temperature and a lower exterior surface temperature [31]. For the FC, its composition is mainly the pore walls and air-filled pores formed by cement mortar hardening. According to the Campbell-Allen model, the thermal conductivity of the FC is related to the proportion of its solid phase [32]. The higher the ratio of the solid phase, the greater the value of its thermal conductivity. Under the damp and heat environment, the quality of FC gradually decreases, the proportion of solid phase decreases, the proportion of gas phase increases, and dry air has a lower thermal conductivity than cement mortar.
Thermal conductivity of PUR is increasing in the damp-heat environment because of hygrothermal aging has an impact on the chemical composition of PUR. Infrared test results indicate that PUR are hydrolyzed with urethane groups in a damp and heat environment, which can be seen as figure 10. The ratio of the peak area of the 1519 cm−1 of the urethane group to the 1596 cm−1 of the benzene ring is defined as the urethane index (I), which is used to characterize the carbamate group in the polyurethane insulation material. The relative concentration of the group:

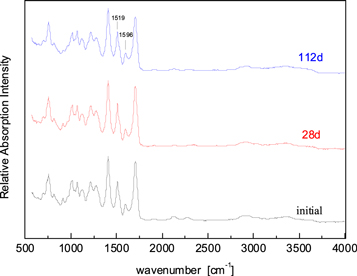
Figure 10. Infrared absorption spectrum of PUR at different damp heat cycles.
Download figure:
Standard image High-resolution imageAccording to equation (1), the carbamate index of uncured PUR is 3.294; the carbamate index of PUR aged 28d is 2.7037; the carbamate index of PUR 112d aged is 2.618. At the end of the hygrothermal aging test, the urethane index of PUR decreased from the original 3.294 to 2.618, indicating that hygrothermal aging causes hydrolysis of the urethane group, leading to molecular chain breakage and degradation and aging, which can be seen as figure 10.
For the change of pore morphology of PUR under the condition of hygrothermal aging, it was found through field emission scanning electron microscopy that the PUR pores collapsed and formed voids in a damp and heat environment, which can be seen as figure 11. Therefore, the reason is mainly due to the change of the pore structure of the PUR, that is, the PUR's pore emerge cracking and collapse with the time increased.
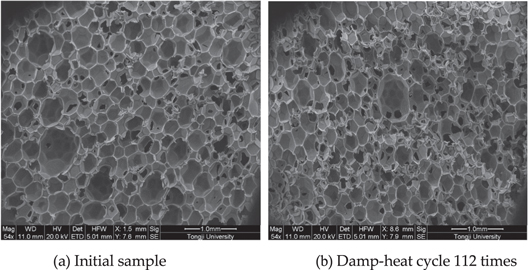
Figure 11. Microscopic of PUR under different damp-heat cycle.
Download figure:
Standard image High-resolution imageThe VIP uses the vacuum insulation principle to greatly reduce the heat transfer in the gas phase so that the VIP has a lower thermal conductivity. The realization of the vacuum environment depends on the high gas barrier and moisture blocking ability of the barrier diaphragm. For the VIP test, Liang et al [33] found that with the increase of the aerogel density, the service life of the VIP increases firstly and then decreases. Furthermore, Liang et al [34] found that with the increase in the service time, the air and the water vapor outside penetrated into the aerogel-based VIP and then the thermal conductivity of VIP increase. However, air and moisture did not penetrated into the VIP because of the barrier film isolates moisture from the outside of the core material and prevents the core material from increasing the test thermal conductivity due to the increase in humidity in this paper. Therefore, as long as the VIP is not pierced by the external force, the thermal performance of the VIP is basically not affected by the moist heat aging, and the VIP also has good service performance under the damp and heat environment.
3.3. Change of thermal conductivity under dry-wet cycle
The wet and dry cycle experiments were carried out in accordance with the dry and wet cycle test regulations in GB/T 11969 2008 Test Method for Autoclaved Aerated Concrete Properties. First, each insulation material was baked in a fan-assisted electro-thermal drying oven at 60 °C to a constant mass; the samples, in groups of three, were then cooled at a room temperature of 20 ± 5 °C for 20 min, and then placed in a water tank. The samples were immersed in water at a temperature of 20 ± 5 °C; the water level was maintained at 30 mm above the upper surface of the insulation material, and the insulation materials were removed after 5 min, dried for 30 min, and then put into the oven (heated to 60 °C), and the insulation materials were baked for 7 h. That is, the insulation materials were baked at 60 °C for 7 h, cooled for 20 min, and placed in water at 20 ± 5 °C for 5 min, representing the complete dry–wet cycle. For it to be a complete cycle, the insulation materials need to return to being baked. The result is shown in figure 12.
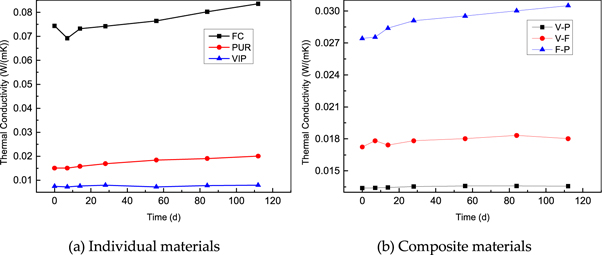
Figure 12. Change of thermal conductivity of material under the dry-wet cycle.
Download figure:
Standard image High-resolution imageAs can be seen from figure 12, the dry-wet cycle has the greatest impact on FC and PUR, which have a significant increase in the value of the thermal conductivity coefficient and a larger rate of change in thermal conductivity. The thermal conductivity of FC increased from an initial value of 0.0724 W/(m · K) to 0.0836 W/(m · K). The thermal conductivity of PUR increased from the initial value of 0.0150 W/(m · K) to 0.02 W/(m · K). Because of the cell wall of the FC and the PUR was collapse and destroyed by the dry-wet cycle, which can be seen as figures 13 and 14.
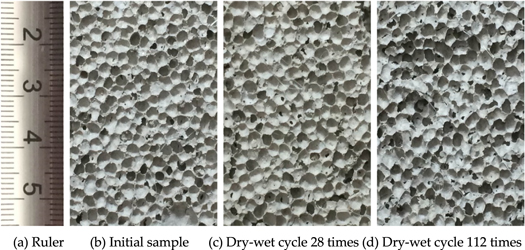
Figure 13. Digital photo of FC under different dry-wet cycle.
Download figure:
Standard image High-resolution image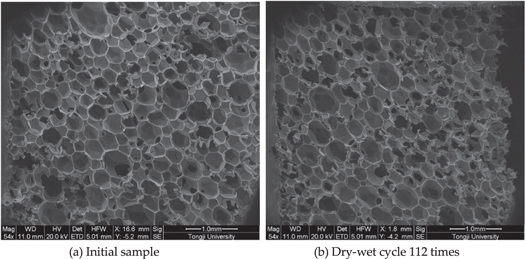
Figure 14. Microscopic of PUR under different dry-wet cycle.
Download figure:
Standard image High-resolution imageFor the PUR, the rupture of the closed cells also leads to the escape of the blowing agent gas, the entry of air with a higher thermal conductivity, and the exchange of gas in the cells increases the thermal conductivity of the PUR. With its unique structure, the VIP maintains a stable thermal conductivity during the dry-wet cycle 112 times. This shows that the VIP can still maintain its thermal conductivity under the dry-wet cycle environment.
3.4. Change of thermal conductivity under high and low temperature
High-low temperature cycle test according to GB/T 2423.34-2012 'Environmental Testing Part 2: Test Method Test ZAD: Temperature and Humidity Combination'. Before the test, each insulation material was oven-baked at 60 °C to a constant mass, and then the insulation materials were placed in an incubator, and the temperature was kept at 60 °C for 3 h then the temperature was lowered to −20 °C for 3 h. During the test, the humidity of the incubator was set to 50% RH, except when the temperature was below zero. That is, the insulation materials were exposed to high temperature at 60 °C and exposed to low temperature at −20 °C for 3 h, respectively. This was the high–low temperature cycle. For it to be a complete cycle, the insulation materials need to return to being baked. The experimental results are shown in figure 15.
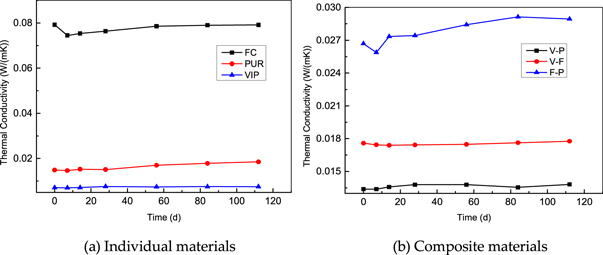
Figure 15. Change of thermal conductivity of material under the high-low temperature cycle.
Download figure:
Standard image High-resolution imageFrom the figure 15, it was noticed that the change rate of the thermal conductivity of each insulation material increased with time except the VIP. Among them, the change rate of the thermal conductivity of PUR was the highest, and the value of thermal conductivity increased after 112 high-low temperature cycles. For the FC-PUR, the thermal conductivity increased 8.41% after 112 high-low temperature cycles. And for the VIP-FC, the thermal conductivity increased 7.35% after 112 high-low temperature cycles. The figure 16 shows the digital photo of the FC, FC-PUR, and VIP-FC after the 112 high-low temperature cycles.
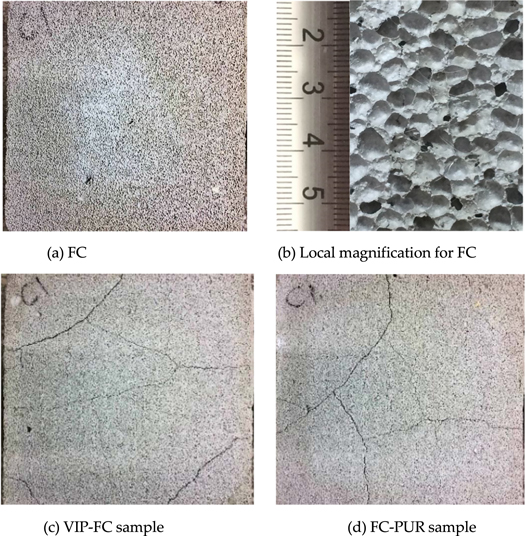
Figure 16. Digital photo of FC, VIP-FC and FC-PUR under different high-low cycle.
Download figure:
Standard image High-resolution imageThe coefficient of thermal conductivity of FC increases gradually during high-low temperature cycles, and the rate of change of thermal conductivity is comparable to the FC-PUR and VIP-FC. However, unlike the FC-PUR and VIP-FC, the surface of the FC is not visible to the naked eye throughout the cycle and can form cracks in the thermal bridge. Digital photographs of FC show that cell collapse has occurred on the surface of FC after 112 high-low temperature cycles, but it is not significant. The thermal conductivity value of the VIP varies from 0.00699 to 0.00709 W/(m · K) during the 112 high-low temperature cycle. The rate of change is not high. Therefore, the thermal insulation performance of the VIP is basically stable and the VIP is used for high and low temperature cycles.
3.5. Change of thermal conductivity under multi-field coupling cycle
For the roof insulation system, since the roof system is provided with a drainage layer, a waterproof layer and a protective layer. When the above layers are maintained in normal service, the effects of rain and radiation are ignored, and the intermittent showering is not used to irradiate the field. Incorporate multiple field constructions. The temperature and humidity control refers to the industry standard JGJ 144-2004 'Technical Specification for External Thermal Insulation Project' Appendix A on the weathering test methods for insulation materials. The change of temperature and humidity on the surface of the control sample is shown in figure 17.

Figure 17. Multi-field coupling cycle.
Download figure:
Standard image High-resolution imageFor the multi-field coupling, the three fields of temperature, humidity, and stress were considered, in which the temperature field and the humidity field alternated over a cycle of 24 h, and the load remained unchanged at 15 N. The multi-field coupling of the structure fully considered the factors that were unfavourable to the thermal performance of the roofing insulation material, such as damp-heat cycle, high–low cycle, freeze–thaw cycle, and wet-dry cycle. The experimental results are shown in figure 18.

Figure 18. Change of thermal conductivity of material under the multi-field coupling cycle.
Download figure:
Standard image High-resolution imageFrom the figure 18, it can be seen that for FC, the thermal conductivity increases from 0.072 W/(m · K) to 0.085 W/(m · K), that is, its thermal conductivity increase 17%. Figure 19 showed the digital photo of FC under different multi-field coupling cycle.
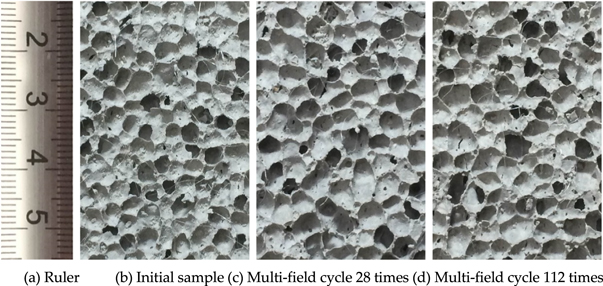
Figure 19. Digital photo of FC under different multi-field coupling cycle.
Download figure:
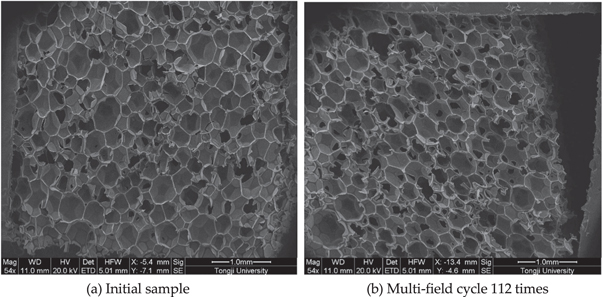
Standard image High-resolution imageAt the same time, the value of the thermal conductivity of the PUR increases during the multi-field coupling cycle 112 times. Figure 20 showed the Microscopic of PUR under different multi-field coupling cycle.
Figure 20. Microscopic of PUR under different multi-field coupling cycle.
Download figure:
Standard image High-resolution image
4. Conclusions
In this paper, the evolution of thermal conductivity of thermal insulation materials (FC, PUR, VIP, FC-PUR, PUR-VIP, FC-VIP) in different environments (damp-heat, freeze-thaw, high-low temperature, wet-dry and multi-field coupling cycle) is studied. Based on the experimental results, it is suggested that PUR and VIP should be used in cold areas, and FC and VIP should be recommended in the hot summer and cold winter areas. The main conclusions drawn from this study are summarized as follows: (1) In the freeze-thaw cycle experiment, the collapse of foam cells in FC collapsed, resulting in a decrease in thermal insulation performance; PUR will produce crack and collapse during the freeze-thaw cycle; The thermal insulation of VIP did not change much in freeze-thaw cycles when the VIP is not pierced by the external force, that is, the thermal performance of VIP remained stable. (2) Dry-wet cycle has a great influence for the FC and PUR. The thermal conductivity of the two materials increases significantly during the dry-wet cycle. The growth rate of the thermal conductivity coefficient of the VIP in the wet-dry cycle experiment is extremely small, which means that the VIP can still maintain the normal thermal insulation performance in the dry-wet cycle environment. (3) The FC and VIP are very resistant to damp-heat cycle. The performance of the composite insulation material is between the two insulation materials. (4) In the multi field coupling environment, the weatherability of composite insulation material depends on the performance of a single insulation material, so the appropriate composite insulation material can be selected based on the actual demand.
Acknowledgments
This work was supported by a Key R&D Project of National (grant no. 2016YFC0700807), a Key R&D Project of Jiangxi Province (grant no. 20171BBG70078), and Natural Science Foundation of China (grant no. 51662008, grant no.51968022, and grant no.51708220).
Data availability statement
The data generated and/or analysed during the current study are not publicly available for legal/ethical reasons but are available from the corresponding author on reasonable request.
Author contributions
Y D, and A S operated the thermal conductivity tests and analyzed the data. Y D, A S, J D, and S Z wrote this manuscript. T Y, Z W, and Y W supervised the study and contributed to the manuscript writing. All authors discussed the results.
Conflicts of interest
The authors declare no conflict of interest.