
Abstract
DLC films were deposited on Ge substrates using direct ion beam deposition method, followed by investigating the influence of O2 doping on their morphological, electrical, and structural properties. The films were doped with oxygen under flow rates of 5, 10, 20, and 40 sccm (standard cubic centimeters per minute). The structure of the films was studied by Raman spectroscopy. Result showed that by increasing oxygen incorporation, sp2 content decreases, sp3 content increases, and the C-C bonding loses its order. The hydrophilicity of the layers was analyzed by the contact angle measuring experiment. The results showed that by increasing the O2 flow ratio from 5 to 40 sccm, the percentage of O2 increases from 1.1 to 3.9%. The water contact angle measurement showed that an increase in oxygen flow ratio results in a decrease in contact angle from 82.9° ± 2.1° to 50° ± 3°.
Export citation and abstract BibTeX RIS

Original content from this work may be used under the terms of the Creative Commons Attribution 4.0 licence. Any further distribution of this work must maintain attribution to the author(s) and the title of the work, journal citation and DOI.
1. Introduction
Most materials used for the design and manufacture of optical windows (antireflection, splitters, and filters for the infrared region) have high refractive indices. Germanium is a common infrared material for fabricating antireflection coatings because of its high refractive index from 4.1008 to 3.9996 [1], high charge carrier mobility, quasi-direct band structure, and high absorbance at a wavelength around 1550n m. Diamond-Like Carbon (DLC) has been the subject of intensive studies for more than 40 years [2]. Production of DLC layers using the ion beam deposition method was first reported by Chabot and Aisenberg [3]. DLC film is a metastable phase of amorphous carbon material containing of diamond (sp3) and graphitic (sp2) bonds. The DLC film has unique properties, such as large young modulus, high hardness, low friction coefficient, high hydrophobicity, and chemical inertness [2]. DLC films have been used as protective storage devices, coating for solar cells, and reduction of wear [4, 5]. There are various methods for depositing the DLC films such as DC magnetron sputtering [6], Plasma Enhanced Chemical Vapor Deposition (PECVD) [7], pulsed laser deposition (PLD) [8], direct ion beam [2], and ion beam assisted cathodic arc deposition [9].
Doping the various elements could alter the properties of DLC films. The effect of doping in DLC films for improving their optical and mechanical properties has been thoroughly studied by many investigators [10–13]. Some researchers have reported the effect of DLC-doped with oxygen [10], nitrogen [11], silicon [12], and fluorine [13]. Table 1 present some studies conducted on the oxygen-doped DLC films. Oxygen as a light dopant element having the ability to modify surface properties of DLC films has been rarely considered [14]. An efficient polarization effect is anticipated due to the high electronegativity of the oxygen.
Table 1. Summary of reports on O-DLC films.
| Author | Fabrication method | Precursor | Optical | Structural | Mechanical |
|---|---|---|---|---|---|
| Hwang [15] | CVD | O2-CH4-H2 | Transmittance and refractive index of the film in the UV region was increased and Eg was decreased by oxygen doping. | Not tested | Not tested |
| Safaie [16] | RF-PECVD | O2-CH4-Ar | refractive index decreased and optical band gap increased by increasing oxygen dopant. | The Raman results showed that ID/IG ratio and position of G peak increased and G peak width decreased, and graphitic clusters increased | Not tested |
| Durrant [17] | PECVD | C2H2-Ar-O2 | by increasing oxygen dopant refractive index was decreased from 2.13 to 1.64 nm and the optical gap increased from 2.62 to 3.21 eV. | XPS analysis showed that the oxygen to carbon atomic ratio as high as 0.40 was found for the film deposited with the highest percentage of O2 in the gas feed ~37.5%. | Not tested |
| Safaie [18] | RF-PECVD | O2-CH4-Ar | Not tested | The Raman results showed that by increasing the oxygen content in DLC films, the amount of sp2 C-C aromatic bonds was raised and the hydrogen content reduced in the structure. | By increasing the oxygen content, hardness and residual stress of the films were increased due to an increase of sp3 C═C bonds between clusters and the decrease of C═H bond in the DLC films network. |
| Adamopoulos[19] | integrated distributed electron cyclotron resonance (IDECR) | C2H2-Ar-O2 | By increasing the oxygen content, the opticalband gap was decreased and refractive index was decreased from 2.2 to 2.0. | Raman spectroscopy showed that the increase of the oxygen content favors the clustering of the six-fold sp2C rings. | Not tested |
In this paper, O-DLC films are deposited using CH4 and the mixture of Ar and O2 gases applying direct ion beam on Ge substrate. This study reports the effect O2 doped on morphological, hydrophobicity, and structural properties of the prepared DLC films. Raman analysis was employed to study the structural properties of the specimens. The electrical resistivity (ρ) of O-DLC samples was measured using a four-point probe instrument. The internal stress was measured using Stoney's equation.
2. Experiment
2.1. Deposition method
In recent years, researchers have been interested in developing the deposition using particle flux enhancement for various applications such as space ion thruster and plasma accelerators. Figure 1 presents a cross-section image of the anode layer source. As shown in this figure, the source of the anode layer includes SmCo permanent magnet, gas inlet, inner and outer cathodes, magnetpoles, and anode with the water-cooled channel. A DC high-voltage source reinforces the source of the anode layer. As an advantage, there is no electron source using this method, so that one can use gases such as oxygen, nitrogen, or other reactive gases. The gas is injected directly into a discharge channel. The suspension of the electrons and keeping a strong electric field in the discharge plasma are both the result of a strong magnetic field between the inner and outer poles.
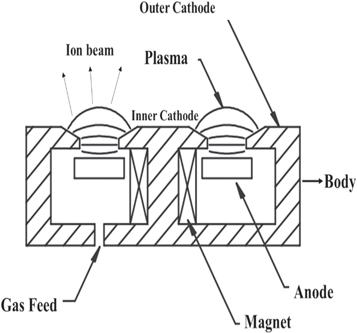
Figure 1. A cross-section image of the anode layer source.
Download figure:
Standard image High-resolution image2.2. Deposition process
DLC layers were prepared using the direct ion beam method with 120 sccm of CH4 (99.999%) on Ge substrates with the same thickness (2 mm) and the same diameter (34.8 mm). These films were deposited at room temperature. First, the Ge substrates were cleaned using deionized water, soap, acetone, and ethanol in an ultrasonic bath and then dried by pure nitrogen gas (99.999%). The fixed substrates distance from the ion source was approximately 15 cm. DLC thin layers were doped by oxygen flow rates (5, 10, 20 and 40 sccm). The deposition time was 23 min Samples were named as O5-DLC, O10-DLC, O20-DLC, and O40-DLC, respectively. The working voltage of the ion source to clean the substrate in the chamber prior to deposition was 1.8 kV, while argon (purity 99.999%) by the flow rate of 25 sccm was flown via the gun. For deposition of methane, 1kV discharge voltage was applied between cathode and anode of the ion gun. For all the processes, the pressure in the vacuum system was pumped down to 6 × 10⁻⁶ mbar and pressure during the deposition process was 3 × 10⁻³ mbar.
Field-emission scanning electron microscopy (FE-SEM, Tescan Mira 3) and energy-dispersive X-ray spectrometry (EDAX) were employed to determine the microstructure, thickness, and composition of the coatings. The structural properties of DLC samples were also investigated by Raman analysis (Takram P50C0R10 model, excitation wavelength of 532 nm). The water contact angles of the films were measured by an optical contact angle measurer instrument (Data Physics OCA 15 plus). Each measurement was repeated three times and the average value was reported. The measurement accuracy was 0.1°.
3. Result and discussion
3.1. Morphological properties
The EDAX analysis was applied to evaluate the elements in the O-DLC films. EDAX spectra for O-DLC samples are illustrated in figure 2. This figure indicates that there are no impurities in as-deposited films. The purity of the film is mainly due to conducting the complete experiment in a high vacuum with highly pure CH4 and O2 gases. This result shows that by increasing the O2 flow rate from 5 to 40 sccm, the O content increases from 1.1 to 3.9 wt%.
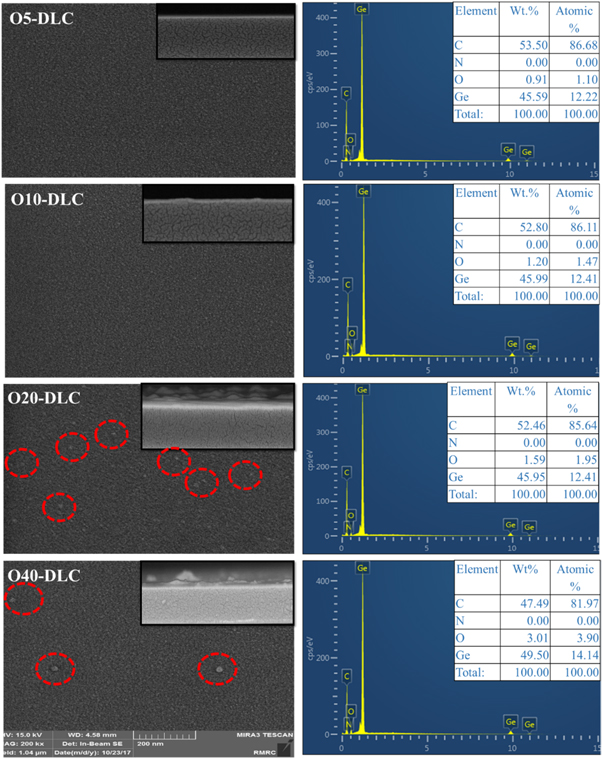
Figure 2. The FESEM images and EDAX spectra of the DLC films deposited at different oxygen flow rates.
Download figure:
Standard image High-resolution imageThe FESEM was applied to evaluate the thickness and study the morphological properties of O-DLC films. Figure 2 also represents cross-section and surface views of the films deposited at various Oxygen flow rates (5, 10, 20, and 40 sccm). The thickness of the O5-DLC, O10-DLC, O20-DLC, and O40-DLC samples was calculated to be 134, 132, 130, and 121nm, respectively. The cross-section pictures indicate that all films are uniform and compact with proper adhesion to the substrate, which may be due to employing methane as the carbon precursor [20, 21]. The surface FESEM images of O-DLC samples shows that the surface of layers is smooth in general. By increasing the O2 content (flow rate of 20 sccm and more), several tiny particles of about 5–10 nm in size are generated on the surface. Devriendt et al., while sputtering graphite in the presence of Ar and C2H2 gases, observed the generation of nanoparticles. In the direct ion beam method, the oxygen radicals in the gas plasma, which greatly prevent the formation of carbon particles due to etching of the graphite component, transported to the substrate [22]. When O2 and CH4 are introduced to the anode layer ion source that generates the gas plasma and transports it to the substrate, O2 radicals in the plasma are highly reactive and hinder the formation of carbon particles due to etching of the graphite component.
3.2. Raman spectroscopy
The Raman spectroscopy technique was applied for analyzing the structural properties of O-DLC films. Raman analysis is a standard and non-destructive tool to characterize the nature of DLC bonding and microstructural information [23]. The Raman peaks of O-DLC were fitted by two peaks with Gaussian line shape. A broad peak appeared in the Raman spectra of O-DLC films in the wavenumber range 900–1800 cm−1. The broad Raman peak of DLC films is usually an overlap of two peaks: 1) D (disorder) peak around wavenumber of 1370 cm−1 and 2) G (graphite) peak around wavenumber of 1500–1650 cm−1. D peak is a breathing mode of symmetry phonons arising from sp2 carbon atoms in the ring. This mode becomes active only in the disorder, and its peak intensity is strictly connected to the presence of a six-fold aromatic ring [24]. G peak originates from the stretching vibration of any pair of sp2 sites in both rings and chains [25]. From fitting the Raman spectra, it is possible to extract G peak position, the intensity ratio of D peak to G peak (ID/IG), full width at half maximum (FWHM) of G peak, and graphite cluster size (La). Raman spectra of all the O-DLC samples are presented in figure 3. In this figure, two peaks of 1367 cm−1 and 1576 cm−1 are observed, which are related to D and G peak, respectively, indicating the formation of a typical DLC structure. Figure 4 presents the fitting of two Gaussian peaks of the O5-DLC, O10-DLC, O20-DLC, and O40-DLC samples. One can basically observe G peak moves to the higher values and increment in the intensity of D peak upon increasing O2 gas flow rate in the figure. FWHM of G peak values of the O5-DLC, O10-DLC, O20-DLC, and O40-DLC samples were estimated 192, 207, 123, and 114 cm−1, respectively. FWHM of D peak values of the O5-DLC, O10-DLC, O20-DLC, and O40-DLC samples were estimated 186, 548, 150, and 120 cm−1, respectively. G peak position values of the O5-DLC, O10-DLC, O20-DLC, and O40-DLC samples were estimated 1530, 1522, 1576, and 1586 cm−1, respectively. D peak position values of the O5-DLC, O10-DLC, O20-DLC, and O40-DLC samples were estimated 1298, 1318, 1419, and 1376 cm−1, respectively. ID/IG ratio values of the O5-DLC, O10-DLC, O20-DLC, and O40-DLC samples were estimated 0.55, 0.51, 0.8, and 1.17, respectively. For the O10-DLC film, the ID/IG ratio and G-peak position decrease while FWHM (G) increases, indicating that oxygen increases the sp3 content, C-C bonding, disorder, and reduces the sp2 cluster size [26]. If the oxygen concentration is higher, for instance, O20-DLC, and O40-DLC samples, the ID/IG ratio and G-peak position increase again and FWHM (G) decrease indicating an ordering of sp2 clusters. FWHM is a measure of the bond length disorder, and the ID/IG ratio is a measure of the size of the sp2 phase organized in rings. The reduction in the ID/IG ratio means the increase in sp3 content. The large value of FWHM indicates disorder due to the larger angle and bond length [27]. FWHM and peak position of G peak of the O- DLC samples versus O2 gas flow rate are shown in figure 5. As can be seen, by increasing O2 content to 10 sccm, FWHM of G increased, G peak position, and ID/IG ratio decreased from 1530 to 1522 cm−1. These results indicate that by an increase in the oxygen incorporation, the sp2 content decreases while the C-C bonding disorders and sp3 content increase [28]. If the oxygen content is higher than 40 sccm, the FWHM of G peak decreases. In this regard, an increase in G peak position and ID/IG ratio indicates an ordering of sp2 clusters [29]. Chain-like sites compared to aromatic sites possess more C-H bonds; hence, by an increase in the O2 content of DLC films, the hydrogen content of the films will be reduced. Dwivede et al. [30] reported that by increasing O2 plasma in DLC films, ID/IG ratio, G peak position, and sp2 clustering decreased. Mckindra et al. [31] deposited O2 doped a-C films using magnetron sputtering and reported a decrease in ID/IG ratio followed by an increase in O2 content.

Figure 3. Raman plot of DLC samples.
Download figure:
Standard image High-resolution image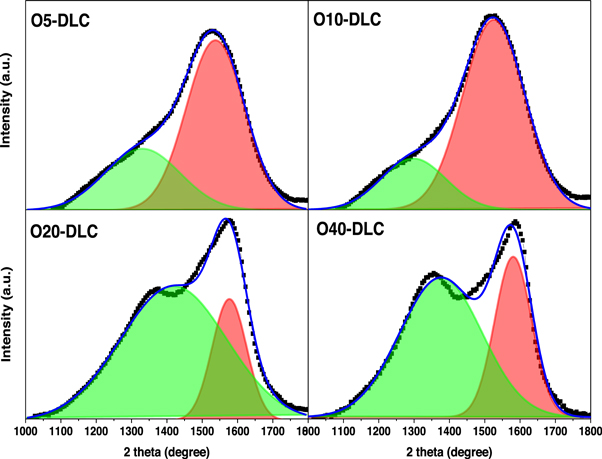
Figure 4. Fitted two Gaussian peaks for the O5-DLC, O10-DLC, O20-DLC, and O40-DLC samples.
Download figure:
Standard image High-resolution image
Figure 5. FWHM and peak position of G peak of the O- DLC samples versus O2 gas flow rate.
Download figure:
Standard image High-resolution imageThe La value is calculated using equation (1) [32]:

where C is ∼0.0055. La values and ID/IG ratio versus O2 gas flow rate for all specimens are shown in figure 6. As one can see, the size of graphite clusters increased with an increase in the O2 content. The ID/IG ratio is found to increase from 0.55 to 1.17, followed by an increase in the graphite cluster size from 1 to 1.45 Å.

Figure 6. La values and ID/IG ratio versus O2 gas flow rate for all samples.
Download figure:
Standard image High-resolution image3.3. Electrical resistivity
In the present study, the electrical resistivity (ρ) of O-DLC samples was measured using equation (2) [33] with the help of a four-point probe instrument. For this purpose, Rs, which is calculated from the I–V characteristic curve, was considered.

where t is the thickness of the O-DLC film. Figure 7 depicts the variation of electrical resistivity as a function of the oxygen flow rate. As can be seen, an increase in the oxygen flow rate causes a significant increment in the electrical resistivity of O-DLC films. Electrical resistivity depends on the carrier density, cluster size, and mobility [34]. ID/IG ratio and cluster size increase as the number of rings per cluster increases, and the number of π states per cluster decreases. It may be deduced that the increase in electrical resistivity is due to decreasing the number of π states per cluster [34]. Yari et al. reported that the increase in the electrical resistivity could be related to the increment of the sp2 bond fraction or crystallization of DLC films. Some authors believe that the formation of C-H bonds can significantly affect the electrical resistivity of DLC films [35, 36]. the resistivity of the DLC film undergoes a radical increased from 0.83 × 10² to 1 × 10⁵ ohm.cm for the DLC to O40-DLC samples. This can be explained by the fact that the energetic ion bombardment on the surface of growing films is one of the major parameters that control the ad-atom mobility on the film surface and thereby their structure. Therefore, the self-bias of plasma changes with increase in the oxygen flow rate, so that the change of oxygen flow rate can cause the energy change of ions, which are bombarding on the film surface.

Figure 7. The variation of electrical resistivity as a function of the oxygen flow rate.
Download figure:
Standard image High-resolution image3.4. Internal stress
The internal stress of the O-DLC samples was measured from the curvature of the Ge substrate. The internal stress was calculated using film curvature after deposition on one side via the Stoney equation [37]:

where  is the internal stress,
  is the Poisson ratio of the substrate, R1 and R2 are respectively the curvatures of the substrate before and after deposition, Es is Young's modulus of the substrate, and tf and ts are respectively the thicknesses of the film and substrate. The values of
  =0.2 and Es = 115 GPa were adopted for Ge substrate [38]. The radius of curvatures of the substrate before and after the deposition was measured through Newton's rings method using optical interferometry. The radius of the substrate curvature is given by:

where dm is the diameter of the mth dark interference fringe and λ is the wavelength of the light (λ=589.3 nm) used as a light source. The residual stress of the O-DLC films versus oxygen flow rate is shown in figure 8. Based on the figure, it is obvious that the internal stress decreases upon increasing the oxygen flow rate. By increasing the oxygen flow rate from 0 to 40 sccm, the internal stress reduced from 2.7 to 0.11 GPa. The mechanical properties of the DLC thin layers depend on the sp2/sp3 fraction and H content in the film's structure [26, 39]. It has been reported that the DLC (a-C:H) films contained both sp2 and sp3 sites, and sp2 sites are separated into clusters embedded in an sp3 bonded matrix [40]. Increasing the hydrogen content in the DLC film structure causes fracturing the sp3 C-C bonds, which are bonded clusters, and sp2 C = C aromatic, which are inside of clusters. When the fracture of sp3 C-C bonds and formation sp3 C-H bonds happens, a discontinuity is created in the films' network followed by a decrease in their residual stress. As reported in [26], by an increase in the hydrogen content in O-DLC films, the residual stress increases first and then decrease abruptly.

Figure 8. The residual stress of the O-DLC films versus oxygen flow rate.
Download figure:
Standard image High-resolution image3.5. Surface contact angle
A microscope equipped with CCD-video was utilized to measure the surface contact angle of the O-DLC samples, a stand with a tiltable plane, and a prism. Images taken using this method were analyzed by digimizer software. Figure 9 shows the oxygen flow rate dependence of the water contact angle for DLC, O5-DLC, O10-DLC, O20-DLC, and O40-DLC samples. The results showed that the water contact angle of O-DLC decreased from 82.9°±2.1° to 50°±3° with the increase in oxygen flow rate. The boundary between hydrophilicity and hydrophobicity is the contact angle of 65° [41]. The hydrophilicity of DLC films is sensitive to the sp2/sp3 bonding ratio on the surface [42]. Reports from others show that the sp2-rich surfaces exhibit a higher contact angle than sp3-rich surfaces [43, 44]. Decrease of water contact angle is the result of the increase in surface energy. The incorporation of oxygen into the film's structure led to increase the surface energy and consequently the wettability. the surface energy includes two important components, i.e., dispersion and polar components. Polar component represents the surface interactions, which are related to dipoles, while dispersive component represents the surface interactions, which are based on temporary variation in the electron density. The π bond electrons of sp2 carbon sites and dangling bond electrons have more potential for polarization than σ bond electrons of sp3 carbon sites. Thus, the polar component of the surface energy of the oxygen doped films is raised by increasing the incorporation of oxygen into the film's structure. Hence, as shown by Raman analysis performed in this study, the decrease in the contact angle of O-DLC films upon increasing the oxygen flow rate may be attributed to the increase in ordering sp3 clusters and sp3 content. Shen et al. [45] reported a decrease in water contact angle from 98.5 ± 2.3° to 26.3 ± 4° with the increase in oxygen flow rate. Nakamura et al. [14] reported a decrease in the water contact angle of DLC samples from 80° to 51° for the oxygen flow rate increase from 0 to 50%.

Figure 9. Oxygen flow rate dependence of the water contact angle for DLC, O5-DLC, O10-DLC, O20-DLC, and O40-DLC samples.
Download figure:
Standard image High-resolution image
4. Conclusion
O2-doped DLC films were deposited by direct ion beam technique on Ge substrates to study the effect of O2 doping on their electrical, structural, morphological, and hydrophilicity properties. EDAX results showed that by increasing the O2 flow rate from 5 to 40 sccm, the percentage of O2 increased from 1.1 to 3.9%. The surface FESEM images of O-DLC samples showed that the surface of the layers was smooth in general. By increasing the O2 contact of the films (flow rate of 20 sccm and more), some tiny particles of about 5–10 nm in size appeared on the surface, which could be due to the CH4 plasma during the deposition process. Raman results indicated that following the increase in the oxygen content of the films, the sp2 content decreased, the C-C bonding disordered, and sp3 content increased. The electrical resistivity of O-DLC films significantly reduced upon increasing the oxygen flow rate. By an increase in the oxygen content from 0 to 40 sccm, the internal stress decreased from 2.7 to 0.11 GPa. The water contact angle of O-DLC was found to decrease from 82.9°±2.1° to 50°±3° with the increase in oxygen flow rate. Doping the DLC films with oxygen caused an increment in hydrophilicity without any significant change in the morphology.