
Abstract
Vanadium dioxide is a typical representative of a strong electronic correlation system. Triggered by stimuli such as heat and electric fields, VO2 can undergo a reversible transition from insulating to metallic phase and has therefore attracted attention of many researchers. In this work, a hydrothermal method was used to prepare nano-VO2 particles with phase transition. According to the phenomenology, finite element simulation and theoretical calculation models of the electro-induced phase transition (E-MIT) in the VO2-filled Polyethylene glycol were established. Electrode-gap effect on the phase-transition voltage of E-MIT was discussed. Furthermore, the phase transition and heat distribution processes were analyzed. The results revealed that high-temperature conductive channels are formed in the VO2 structure during the electro-induced phase transition. Moreover, position of these channels is determined by the high-voltage edge effect of the electrode and the heat dissipation effect of the material. The ideal adiabatic E-MIT process was also evaluated. The phase change voltage curve of the theoretical model was well matched with the simulation model. The results reveal that the temperature in the channel is significantly lower than the typical phase change temperature when a phase transition occurs. In addition, owing to an applied voltage, the resistance of the VO2 composite material can drop suddenly even if the temperature rise is small. The analysis results verified that Joule heating is an important factor in the electro-induced phase transition of VO2-filled polymers. The experimental results are helpful in understanding the E-MIT mechanism of VO2 composite materials and the subsequent application of these materials.
Export citation and abstract BibTeX RIS

Original content from this work may be used under the terms of the Creative Commons Attribution 4.0 licence. Any further distribution of this work must maintain attribution to the author(s) and the title of the work, journal citation and DOI.
1. Introduction
In 1949, N F Motto predicted the insulation-metal phase transition of metal oxides through energy band theory [1] (MIT, metal-insulator transition). In 1959, Morin (Bell Labs) first discovered the phase-transition phenomenon [2] of single-crystal vanadium dioxide (VO2). Since then, the VO2 phase-transition characteristics have become an important topic in the field of condensed matter physics. VO2, a typical strongly correlated system material, undergo a unique reversible metal-insulator phase transition (MIT) from a monoclinic structure to a symmetry rutile-type tetragonal structure at ∼340 K. The phase transition is accompanied by a significant change in optical [3], thermal [4], and magnetic properties [5] of the material. Experiments have confirmed that MIT can be triggered by an electric voltage [6–8]. Compared with thermal excitation and illumination excitation, electric field-induced VO2 metal-insulator phase transition (E-MIT) has the following advantages: fast response speed [9], low loading cost, easy integration and miniaturization rendering this transition suitable for broad application prospects in reconfigurable antenna technology [10], terahertz technology [11], memory and neuron computer technology [12], and fast-switching devices [13].
Heat-induced MIT is well understood [14–16], but the understanding of E-MIT is inadequate [6–8]. At present, a unified understanding of the crystal structure change during the electric MIT of VO2 (that is, the reversible transition between the monoclinic rutile phase and the tetragonal rutile phase) has existed. However, controversy persists regarding the factors that cause E-MIT [17]. Some have attributed E-MIT to an electric field [7, 18], that is, the electron-related Mott-Hubbard transition [19]. Others have proposed that Joule heating caused by an electric current is an efficient reason [20–22]. In addition, some experiments have confirmed that the electro-induced phase transition occurs under the combined action of the electric field and Joule heat [23]. In the phase-transition phase, the electric field plays a major role, but after the transition, the Joule heat can maintain the phase-transition.
According to our previous study [24], the role of Joule heating in the phase-transition process of VO2 composite films must be taken into consideration. In recent years, this role has been extensively discussed [25], but without a general conclusion. Gopalakrishnan et al [26] confirmed the weak correlation between the phase-transition characteristics and Joule heating. By studying the Joule heating effect caused by the leakage current, they found that the typical temperature increase caused by the leakage current was less than 10 K. This indicated that, by itself, the Joule heat is unable to trigger the transition [27]. In the published literature, theoretical calculations yielded a value of 1 μs for the minimum phase transition time caused by Joule heating [7, 28], but in some experiments, shorter or nanosecond response times have been observed [29]. This suggests that Joule heating contributes to (rather than induces) the electro-induced phase transition. Nevertheless, studies have verified that the switching effect of VO2 is closely related to Joule heating and dissipation. This verification was obtained through electrothermal simulation [30, 31], Fourier conduction equation calculations [32, 33], and different experimental results [33]. The calculated DC I–V characteristics and the incubation time showed good agreement with the measured values. The occurrence of E-MIT was attributed mainly to the Joule heating effect. Furthermore, some studies revealed that (compared with this effect) the conductive channel has a greater influence on the electro-induced phase transition [34]. In 1969, Neil and Berglund demonstrated channel formation in VO2 based on the heat conduction equation [35]. Duchene [32] and Langel et al [36] observed the conductive channels in VO2 films. The results revealed that the formation and rupture of these channels can affect the electrical resistance of the materials [37], and the heat dissipation efficiency has an impact on the thermal stability of the channels [38].
However, most of the VO2 films in these studies were prepared using magnetron sputtering technology [39, 40]. A few studies have considered the electro-induced phase-transition behavior of polymer-based nano-VO2-filled composite films. Kolbunov et al [41] conducted experimental studies on the electro-induced phase-transition behavior of polyethylene-VO2 and polypropylene-VO2 composite materials. The research results verified the electro-induced phase change behavior of composite materials filled with VO2. However, the influencing factors and internal mechanism of the phase transition were only briefly discussed. An accurate analysis of the phase-transition mechanism in composite films is lacking. In this work, nano-VO2 particles were prepared by means of a hydrothermal method, and the electro-induced phase-transition characteristics of VO2 nano-particle-filled polymers were experimentally investigated. Based on the phenomenological theory, a finite element simulation and theoretical calculation model of the electro-induced phase transition were established. The relationship between the phase-transition voltage and the electrode spacing and the heat distribution change during the phase transition were evaluated. The results verified that Joule heating plays an important role in the electro-induced phase transition of the VO2 composite film.
2. Materials and methods
2.1. Synthesis
The hydrothermal technique was used to synthesize vanadium dioxide (VO2). Moreover, 0.03 mol oxalic acid (H2C2O4 · 2H2O from Tianjin Yongda Chemical Reagent Company Limited), as a reducing agent, was dissolved in 150 ml deionized water. Afterward, 0.01 mol vanadium pentoxide (V2O5 from Tianjin Yongda Chemical Reagent Company Limited) as a vanadium source was added to the solution. The resulting yellow aqueous solution was immediately transferred to a 200 ml Teflon-lined stainless-steel autoclave after being put in an oven at 200 °C for 12 h. After 12 h of cooling to room temperature, the dark blue precipitate was filtered and washed three times with deionized water to remove the remaining raw materials. The as-prepared powders were dried in a vacuum freeze dryer overnight to avoid aggregation phenomena. To obtain VO2 (M) nanoparticles, the samples were annealed at 550 °C for 60 min in a tube furnace under vacuum conditions. For the resistivity characterization of VO2, 0.1 g VO2 (M) coating mixing 30% polyethene glycol (PEG) solution was deposited on the abstract between two electrodes. Then it was placed in a 60℃ incubator for drying. After the water has completely evaporated, the mass fractions of PEG and VO2 in the composite film were 48% and 52%, respectively. All the chemical reagents employed in the experiments were of analytical grade without any further purification.
2.2. Characterization
The as-synthesized powders were characterized using several techniques. The x-ray diffraction (XRD) patterns were obtained using an x-ray polycrystal diffractometer (XD6, Beijing Puxi General Instrument Co., Ltd). The compound was identified through comparison of the patterns with the Joint Committee on Powder Diffraction Standards (JCPDS). The structure of the VO2 powders was investigated by means of high-resolution scanning electron microscopy (SEM; Gemini SEM 300 SEM, Germany) performed at 5 kV. Transmission electron microscopy (TEM; JEOL JEM-2100 TEM, Japan) was used to analyze the morphology of VO2 at 200 kV. Moreover, the phase transition temperature was determined via differential scanning calorimetry (DSC; TA Instruments SDT-Q600). The resistivity with respect to temperature was determined using an incubator. The DC phase-transition characteristics were investigated using a Keythley2657. To prevent an excessively high current, a 2000 Ω resistor was loaded in the circuit and the maximum current was set to 50 mA.
2.3. Simulation Settings
A Comsol Multiphysics package finite element simulation was used to analyze the electro-induced phase change and thermal distribution of the film. The 3D structure and material properties of the simulation model, including test electrodes, substrates, and VO2 composite films (inset in figure 6(b)), were the same as those of the experiment. To fully reflect the experimental test conditions, a 2 kΩ resistor was also loaded in the simulation circuit. Composite film material properties (e.g., electrical conductivity, specific heat capacity, density) were calculated in accordance with the experimental conditions.
3. Results and discussion
3.1. Preparation of VO2 particles by means of a hydrothermal method
B-phase VO2 is prepared by means of a high-pressure hydrothermal method and is then converted to M-phase VO2 via high-temperature annealing in a vacuum environment. Figure 1 shows the B-phase and M-phase XRD patterns of the prepared samples. The three strongest peaks of the prepared VO2(B) are 2θ = 14.38°, 25.24°, and 29.00° (see figure 1(a)), which correspond to (001), (110), and (002) crystal planes (as indicated by standard card (JCPDS PDF#81-2392)), respectively. Other impurity peaks are absent from the pattern, indicating that the sample is high-purity VO2 (B). The XRD pattern obtained after annealing (figure 1(b)) shows that the diffraction peaks of the samples are well matched to the standard card of VO2 (M) (JCPDS PDF#81-2392). This suggests that most of the samples have transformed into monoclinic VO2 (M). In addition, four major diffraction peaks located at 2θ = 27.795°, 37.088°, 42.268°, and 55.450° correspond to the (011), (200), (210), and (220) crystal planes, respectively. In addition, according to [42], it can be known that the annealed sample contains a small amount of V3O5 and V3O7. However, the impurity peaks are low and the contents are small, which will not affect the overall performance of the material.

Figure 1. XRD patterns of the as-prepared samples. Patterns corresponding to the (a) B-phase VO2 and (b) M-phase VO2.
Download figure:
Standard image High-resolution imageFigure 2 shows SEM and TEM images of the prepared nanoparticles. As shown in the figure, the B-phase VO2 prepared via the hydrothermal method is composed of a regular nanoribbon structure (average length: 2 μm, width: 300 nm, and thickness: 20 nm). After annealing, the length of the nanobelt is reduced and the edges become rounded. Furthermore, signs of melting and recrystallization at high temperature are observed (see figure 2(d)).

Figure 2. Electron micrographs of the nano-VO2 particles. (a) and (b) show a SEM image and TEM image, respectively, of VO2 (B), and (c) and (d) VO2 (M).
Download figure:
Standard image High-resolution imageThe phase change performance at the preparation temperature of the VO2 (M) nanoparticles is recorded via DSC. The obtained curves are shown in figure 3. As shown in the figure, the prepared samples undergo a considerable phase change process during the heating and cooling process. And the heating phase-transition temperature is 65.6 °C, cooling phase-transition temperature is 62.1 °C, and hysteresis width is 3.5 °C. The above analysis results show that we have successfully prepared typical VO2 (M) nanoparticles with phase change characteristics.
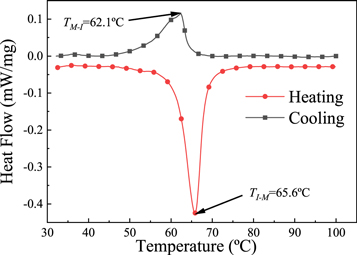
Figure 3. DSC curves of VO2(M) nanoparticles.
Download figure:
Standard image High-resolution image3.2. Phase Transition of VO2 (M)
The prepared VO2 (M) nanoparticles are incorporated in polymer PEG to obtain a VO2-filled composite material. The composite material is coated between the two electrodes on the FR-4 circuit board. A SEM image of the film is shown in figure 5(b). Figure 4 shows the temperature-dependent resistance of a typical composite film. As shown in the figure, the phase-transition points of the heating and cooling processes performed on the composite film are 65.6 °C and 62.1 °C, respectively, which are the same as the DSC test data. This indicates that the phase-transition temperature of VO2 remains unchanged during the preparation of the composite film. However, unlike the typical pure VO2 phase-transition curve [43], two stages of resistance reduction occur in the present curve. The resistance decreases at temperatures near 68 °C, and in the low-temperature range of 30–50 °C. This results from the addition of polymers and the consequent thermodynamically unstable state of the material during the preparation process. Furthermore, the Gibbs free energy is positive. The Gibbs free energy of the VO2 composite film increases with increasing temperature. The nanoparticles are fine-tuned in the matrix such that the number of contact points increases and the resistance decreases.

Figure 4. Curve showing temperature-induced phase transition of the composite film.
Download figure:
Standard image High-resolution imageThe voltage response characteristics of the sample are investigated using a V-I test system constructed in-house (see figure 5). As shown in the figure, the current changes suddenly when the voltage rises to 77.1 V, indicating that the resistance of the composite film we prepared changes suddenly under voltage application. To analyze the variation trend of the voltage across the film V0, the voltage is calculated as follows: V0 = Vi-I * 2000. The relationship between V0 and the current in the circuit I is shown in figure 5(b). As shown in the figure, V0 drops suddenly with increasing source voltage Vi. This results from the phase transition in the film and the corresponding sudden decrease in the resistance and the sharp reduction in the partial pressure across the film. The corresponding voltage across the film is defined as the E-MIT voltage (VM) of the composite film.
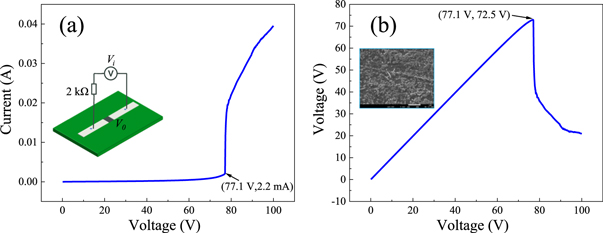
Figure 5. Typical V-I test curves of the composite film. The electrode spacing l = 2 mm and the electrode width d = 2 mm. (a) Plot of the input voltage Vi versus current I. A schematic of the test connection is also shown. (b) Plot of Vi versus the partial voltage V0. A SEM image of the composite film is also shown.
Download figure:
Standard image High-resolution image
Figure 6. Typical curves of simulated E-MIT (electrode spacing l = 2 mm, electrode width d = 2 mm). The (a) conductivity curve of the material, (b) relationship between the input voltage Vi and the current I, and (c) curve describing the relationship between the film partial voltage V0 and Vi .
Download figure:
Standard image High-resolution image3.3. Finite element modeling and theoretical analysis
A VO2 composite film with E-MIT characteristics can be obtained by mixing nano VO2 particles with a polymer. To analyze the E-MIT mechanism of the VO2 composite film and analyze the effect of Joule heating, the electro-induced phase-transition process of the film is investigated using the finite element simulation method. In this model, the conductivity of the film is set according to the test data before and after MIT (see figure 4). The conductivity of the insulating state is  and the conductivity of the metal state is
  In the simulation, the conductivity remains constant with changing field strength. The output voltage Vi of the power supply is a function of time t (
 where
where  is the increasing rate of the input voltage). In the simulation, the ambient temperature Te = 293.15 K and the phase-transition temperature T0 = 341.15 K. Based on the material parameters (


 ) of VO2 and polymer PEG, the specific heat capacity
  and density of the composite material
  can be expressed as follows:


Due to the advantages of flexible parameter settings, comprehensive analysis functions, and high repeatability, more comprehensive analysis data that are unattainable from experiments can be obtained via simulation methods. This allows improved understanding of the heat distribution and electric field distribution associated with the MIT process, and is essential for analyzing the role of Joule heating in the phase transition. Therefore, the Comsol Multiphysics package is used to analyze the phase-transition process. By adjusting the electrode spacing l in the simulation, the curve describing the relationship between the partial pressure VM and the electrode spacing l (see figure 7) is obtained. The results show that the MIT voltage VM of VO2 is proportional to the spacing l, and the rate of change decreases gradually. When the film undergoes a phase transition, the electric field intensity (rather than being constant) decays exponentially with increasing distance, as shown in figure 7(b). This demonstrates that E-MIT of the composite film is only partly determined by the electric field strength.
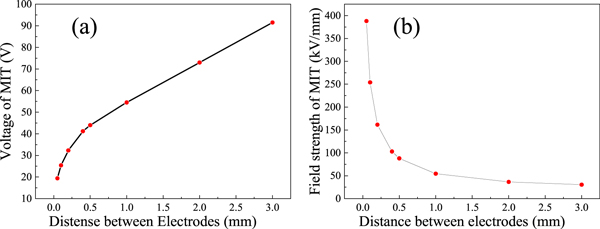
Figure 7. Simulation results of the relationship between the MIT voltage and (a) the electric field strength across the film and (b) the electrode spacing l.
Download figure:
Standard image High-resolution imageThe heat distribution during the VO2 E-MIT process is analyzed, and the results revealed that only some areas are heated, but high-temperature metal conductive channels are formed. Figure 8 shows the heat distribution generated when a voltage is applied to a film with an electrode spacing of l = 1 mm and width d = 2 mm. As shown in the figure, all areas of the film are heated in the beginning of the voltage application process. At t = 5.9 s, the voltage reaches the phase change voltage of VM = 54.5 V, and a linear high-temperature region appears instantaneously in the VO2 film. This region expands from the channel to both sides as the process progresses confirming that, in the E-MIT process, the formation of high-temperature metal conductive channels can induce a phase transition. This further illustrates that Joule heating plays an important role during the E-MIT of the composite film.
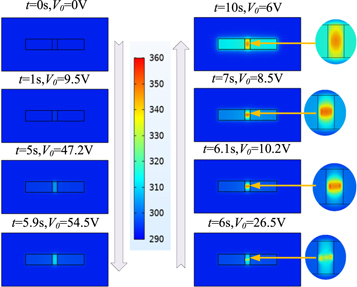
Figure 8. Temperature distribution of the composite film during voltage loading (electrode spacing l = 1 mm, width d = 2 mm).
Download figure:
Standard image High-resolution imageThe above analysis shows that the conductive channel plays an important role in the E-MIT process. To further analyze the influence of the channel on the phase transition, the temperature distribution of the film with different electrode spacing l when the phase transition occurs is obtained (see figure 9). As shown in the figure, when VO2 undergoes an electro-induced phase transition, high-temperature channels will form. The high-temperature metal area extends from the conductive channel to both sides. At the same time, the position of the metal channel varies: with increasing electrode spacing, the position moves from the edge to the middle. When the distance l is greater than 0.5 mm, the position is relatively fixed in the middle. The theoretical calculation results indicate that edge effects will occur under high-voltage conditions considering the parallel plate capacitor under actual conditions, resulting in higher field strength at both ends than in the middle. These effects weaken gradually with increasing electrode spacing. This is consistent with the position of the conductive channels (see figure 9). Although the edge effect is weak, the quintessence of the physics of any phase transition is that 'small perturbations result in substantial changes' [44]. Heat dissipation takes place between the composite film and the surrounding environment due to heat exchange. Therefore, when the electrode spacing is small, the edge effect is the main factor, leading to the formation of high-temperature channels at both ends of the electrode. When the distance is large, this effect is quite weak. The area near the middle of the electrode heats up faster than other regions and reaches the phase-transition temperature to form a conductive channel first due to the heat conduction effect on both sides [44]. The gradual decrease in the MIT voltage slope (see figure 7) may have resulted from the difference in the position of the channel. According to Fourier's law, the heat exchange with the surrounding environment increases with increasing temperature. When the electrode spacing is small and the temperature at the edge is high, the film conducts more heat to the surrounding environment than under other conditions. When the electrode spacing is >0.5 mm, the high-temperature channels always appear in the center position, and the amount of heat exchange between the VO2 junction and the surrounding environment is only related to this spacing. The phase change voltage of VO2 varies linearly (in general) with the electrode spacing for spacing values >0.5 mm (see figure 7). Further analysis revealed the basis for the varying position of the conductive channel during the phase transition associated with different electrode spacing. This difference results from the competition between the high-voltage edge effect (between the two electrodes) and the edge heat dissipation occurring via a reduction in the thermal accumulation effect [39].

Figure 9. Heat distribution diagrams of films with different electrode spacing during phase transition.
Download figure:
Standard image High-resolution imageTo further verify the effect of heat exchange on the formation of conductive channels, we evaluated the ideal E-MIT process under the conditions of no heat exchange as shown in figure 10. As shown in the figure, under ideal conditions, the VO2 composite film can still undergo an electro-induced phase transition. The phase change voltage is, however, significantly lower (see figures 10(a) and (c)) than that shown in figure 7. After the phase change, the thin film resistance decreases sharply, causing the Joule heating power to increase rapidly. Simultaneously, no heat loss occurs under ideal circumstances, and all the energy generated by the heating is used to heat the film. This prevents thermal equilibration of the film and the film temperature rises rapidly (figure 10(b)). When the phase transition occurs, the film temperature is significantly lower than the bulk VO2 phase-transition temperature (341.15 K; see figure 10(d)). This can be explained by figure 4. Under the action of temperature, the conductivity of VO2 composite film starts to increase before the phase-transition temperature T0. That is, at temperatures lower than the typical phase-transition temperature, the film can also undergo E-MIT. Analysis of the heat distribution in the film revealed that no high-temperature channel is formed in the film when the phase transition occurs, without considering heat dissipation and conduction. This further illustrates that the formation of conductive channels is related to heat conduction occurring during the E-MIT process of the VO2-PEG composite film.
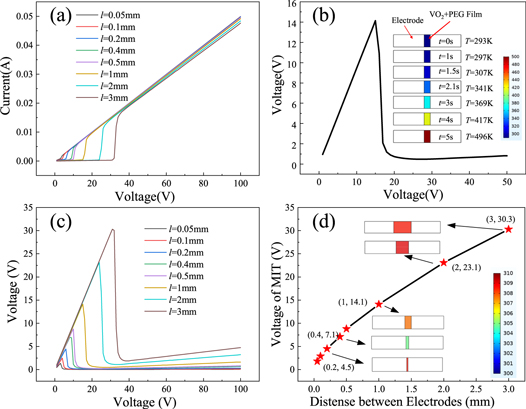
Figure 10. The E-MIT process of the VO2 composite film without heat dissipation and heat exchange. The relationship between the source voltage Vi and (a) the current I and (b) the thin film partial voltage V0 when l = 1 mm. The inset shows the heat distribution diagram at different times. (c) The source voltage Vi versus the partial voltage V0 for different electrode spacing. (d) The phase-transition voltage VM versus the electrode spacing l. The inset shows the heat distribution diagram when the VO2 film undergoes phase transition with different spacing.
Download figure:
Standard image High-resolution imageThe above simulation analysis revealed that the VO2 E-MIT process is essentially a thermally induced phase-transition process. Under the combined action of Joule heat generated by the electric current and the heat exchange between the film and the air, the electrodes and the substrate, the film forms a conductive channel. Based on the heat conduction balance equation, the heat balance equation of the composite film element can be expressed as follows:

Where, 


 and
and  are the density, specific heat capacity, temperature, thermal conductivity, and conductivity of the micro-element, respectively. t represents time and I denotes the current density of the material. The left side of the equation describes the increase in the internal energy of the material, that is, the temperature rise. The second part is a Fourier equation, which represents the heat dissipation of the film. The third part describes the work done by Joule heat. The scattering part of the material can be divided into three regions: the surrounding air, substrate, and the electrodes. The electrode material is metallic copper with a thermal conductivity of
  Furthermore, the thermal conductivity of air and the substrate (
 and
and  respectively) can be ignored. The heat conduction balance equation of the material can be expressed as follows:

Where, 

 and
and  are the specific heat capacity of the composite film, thermal conductivity of the electrode, ambient temperature, and the real-time temperature of the material, respectively. Moreover,
  refers to the quality of the composite film.
  is the voltage across the material and
  is the material resistance.

 is the input voltage of the circuit.
  is the load resistance of the circuit, that is 2 kΩ.
  and
and  are the resistivities of the material in the low-temperature insulation state and the high-temperature metal state, respectively.
  is the electrode spacing, that is, the VO2 junction length, and
  is the electrode cross-sectional area

 is the electrode width, that is, the VO2 junction width, and
  is the material thickness.
Equation (4) can be rewritten as follows:

Consider the simple case first. Without the second term considering the heat dissipation, equation (7) can be simplified as follows:

The phase transition time t can be obtained as follows:
According to the above analysis, 


 The assumption is that the VO2 composite film is insulating prior to the phase transition of the VO2 junction. The resistivity is calculated as follows
  When the material temperature reaches the VO2 phase-transition temperature of 341.15 K, the VO2 junction undergoes a phase-transition. The MIT voltage of the film is given as follows:

The curve describing the relationship between the voltage at which the film undergoes the phase transition and the electrode spacing can be obtained (see the red curve in figure 11). As shown in the figure (the blue curve in figure 11), the MIT voltage obtained from the theoretical calculation is higher than that obtained from the simulation data. Consider formula 9 and the simulation model. Based on the temperature change process of the film in the E-MIT process described in the previous section, the temperature will rise prior to the phase transition. The resistance change trend of the VO2 composite film (figure 4) indicates that during the heating process, the electrical conductivity of the film will increase slowly prior to the phase change. In the theoretical model, the conductivity of the material is completely calculated based on the conductivity of the initial insulation state  which is not strictly correct. Figure 10(d) shows that in the adiabatic state, the temperature corresponding to the phase transition of the material is ≤310 K. This value is close to the temperature associated with the electrical conductivity of the material prior to the phase transition. The electrical conductivity derived from the theoretical model is corrected to the material conductivity
  at 310 K. The green curve shown in figure 11 is obtained by recalculating the theoretically calculated phase-transition voltage. Compared with the original curve, the revised theoretical calculation phase-transition voltage curve is closer to the simulation results.
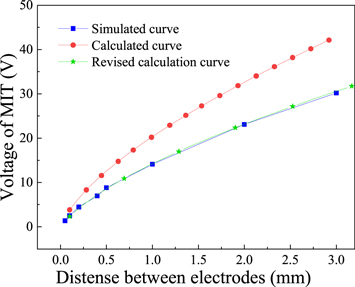
Figure 11. Relationship between the VO2 phase-transition voltage and electrode spacing under ideal conditions.
Download figure:
Standard image High-resolution imageWhen considering the actual situation, the second term in the theoretical calculation model of the VO2 phase-transition voltage (in equation (7)) must be taken into account. The corrected conductivity is then substituted into the equation and a computer is used to solve the equation. The curve describing the relationship between the MIT voltage and the electrode spacing can be obtained, as shown in figure 12 (blue spherical symbol curve). However, the revised theoretical calculation curve is quite different from the simulation data. According to the above analysis, a conductive channel is formed in the simulation model, and the position of this channel changes with the electrode spacing, resulting in a different amount of heat exchange. Therefore, obtaining data results (through theoretical calculations) that are completely consistent with the simulation is difficult. When the distance is <1 mm, the heat dissipation is higher than the theoretical value. This results from the fact that the conductive channel is close to the edge of the VO2 junction, and consequently the simulated phase-transition voltage is higher than the theoretical value. When the spacing is >1 mm, the width of the conductive channel is significantly smaller than the width of the VO2 junction. Therefore, the heat required for the film to heat the material to the phase-transition temperature and the phase-transition voltage are lower than the respective theoretical values.

Figure 12. Curve describing the relationship between the phase-transition voltage and electrode spacing of the experimental test, simulation, and theoretical calculation.
Download figure:
Standard image High-resolution image
4. Conclusion
In this work, the E-MIT of the VO2 composite film is determined by means of experiments, and the finite element analysis model of the VO2 composite film electro-induced phase transition is established based on the experimental data. The relationship between the electrode spacing and the phase-transition voltage is obtained. Furthermore, the heat distribution of the electro-induced phase-transition processes is observed. The theory of the conductive channel associated with the VO2 E-MIT is verified. For the first time ever, evidence is obtained showing that the position of the conductive channel is affected by the high-voltage edge effect and the heat conduction effect. The simulation analysis of the adiabatic E-MIT revealed that the phase transition can also occur when the VO2 temperature is lower than the typical phase transition temperature. To further verify the role of Joule heating, based on the theory of heat conduction, a mathematical model of the VO2 composite film E-MIT is established. The full-text analysis results confirm that Joule heating is an important factor in the electro-induced phase transition of VO2 composite films. The analysis conclusion assists to understanding the E-MIT mechanism of the film. Moreover, the electro-induced phase transition can be combined with the thermal phase transition through the Joule heating effect. The research results are particularly relevant to the application of new-generation memristors, fast-switching devices, and tunable metamaterials based on VO2. The analysis method employed in this work is also applicable to other metal oxides and devices that exhibit phase-transition behavior.
Acknowledgments
This work was financially Supported by the National Natural Science Foundation of China (Grant No. 52077220).
Data availability statement
The data that support the findings of this study are available upon reasonable request from the authors.