
Abstract
Nanocrystalline cellulose templated barium hexaferrite has been prepared by sol-gel auto combustion and calcination method. Nanocrystalline cellulose template of 0, 0.5%, 1.0%, and 1.5% (w/v) were used to synthesize barium hexaferrite. The XRD pattern and TEM observation reveal the crystalline phase formation of hexagonal barium ferrite. Cellulose template changes the microstructure and properties of barium hexaferrite. Adding cellulose template of 0.5% (w/v) produce well-defined hexagonal platelet barium ferrite without impurity while adding more template result in barium hexaferrite containing hematite and excess cellulose template causing the decrease in magnetic properties. The crystallite size reduces with the addition of the cellulose template. The saturation magnetization and magnetocrystalline anisotropy are estimated using the Law of Approach to Saturation magnetization. The maximum values of saturation magnetization and magnetocrystalline anisotropy are 57.43 ± 0.25 emu g−1 and (4.64 ± 0.1) × 105 erg cm−3.
Export citation and abstract BibTeX RIS

Original content from this work may be used under the terms of the Creative Commons Attribution 4.0 licence. Any further distribution of this work must maintain attribution to the author(s) and the title of the work, journal citation and DOI.
1. Introduction
Barium hexaferrite (BaFe12O19) is oxide-based magnetic material with high Curie temperature and magnetocrystalline, which are technologically attractive for electronic and magnetic devices, such as recording media and sensors (Pullar 2012). In the last decades, many researchers have focused on improving the magnetic properties, such as saturation magnetization (Ms ), remanent magnetization (Mr ), coercivity field (Hc ), and magnetocrystalline anisotropy (K1) (Singh et al 2018). The magnetic properties are influenced by the microstructure, which can be tailored by varying the process parameters, substituted elements to Ba2+ sites or Fe3+ sites (Kagotani et al 2004, Shao et al 2019), and templated synthesis (Mu et al 2008).
In the last two decades, the template-based approach has been extensively studied to synthesize various nanostructures. The templating process has been attractive because it is a simple method for controlling the microstructure, morphology, and particle size (Cao and Liu 2008, Xie et al 2016a). Nanorods or nanowires of barium hexaferrite has been synthesized using inorganic materials such as platinum (Nie et al 2010), α-FeOOH nanowires (Xu et al 2014), porous silicon (Zheng et al 2014), and using synthetic polymeric substances, such as polyethylene glycol (Deepa et al 2008), poly(methyl methacrylate) (Mu et al 2008, Zhong et al 2014). In a further development, biomineralization in nature has inspired researchers to synthesize nanostructured materials using a bio-templating technique, in which the nanomaterials are directly assembled from an underlying biomolecular template (Singh and Chakarvarti 2016). Among attracted bio-templates, nanocrystalline cellulose (NC) has been widely explored for synthesizing inorganic metal oxides (Prusty et al 2017), silica nanorods (Fu et al 2012), and porous titania (Shin and Exarhos 2007). Nanocrystalline cellulose can be extracted from abundantly renewable natural resources in the form of a rod-like length of about 50–1000 nm and a width of about 3–50 nm suitable for templating nanorod structure materials (Moon et al 2011). As a template, nanocrystalline cellulose possesses a hydroxyl-group that plays a role and facilitates precursors deposited on the body of cellulose.
In this work, nanocrystalline cellulose was extracted from luffa acutangula fruit by bleaching and hydrolysis method and used the nanocrystalline cellulose as a template for synthesizing barium hexaferrite.
2. Materials and methods
2.1. Materials
The fruit of luffa acutangula was obtained from the local market. Fruit skin was peeled off carefully not to destroy the fiber, and the seed was taken out. The fiber was washed twice in boiled water and dried up to clean up the fruit gum and remove the bad smell. The remaining fiber was cut into pieces and ground to obtain a coarse powder of luffa acutangula fiber. Reagents grade of sodium hydroxide (NaOH), sodium hypochlorite (NaOCl), hydrogen sulfate (H2SO4), barium nitrate (Ba(NO3)2), iron nitrate nonahydrate (Fe(NO3)3.9H2O), citric acid (C6H8O7), ammonium hydroxide (NH4OH) were obtained from Sigma-Aldrich.
2.2. Extraction of fibril cellulose and nanocrystalline cellulose
The fibril cellulose was prepared by first immersing 15 g of chemically untreated luffa fiber into continuously stirred 4M NaOH solution at 80 °C for 4 h. The solution was filtered; the obtained powder was washed with water to neutralize the pH and dried at 60 °C. The dried powder was soaked in 2.5% (v/v) NaOCl for 30 min and filtered and dried in the oven at 60 °C. The dried powder was then crushed to form fibril cellulose powder.
The crystalline cellulose was prepared by soaking 8.534 g powder cellulose into 45% H2SO4 (v/v). The water was added to obtain 500 ml total volume of solution and was then aged 24 h. The precipitated cellulose was filtered and soak in 0.5 M NaOH to obtain the final solution with a pH of 7. The final solution was centrifuged to separate the precipitated from the solution. The resulting precipitated nanocrystalline cellulose was sonicated by 60% power with a 0.5 s pause for 20 min and then dried in the oven at 60 °C for 2 h.
2.3. Synthesis bariumhexaferrite
Barium nitrate (4 mmol) and iron nitrate (46 mmol) were poured in 200 ml double-distilled water. Citric acid was added to chelate the ions so that the molar ratio of Ba2+: Fe3+: citric acid = 1: 11.5: 12.5. Ammonium hydroxide was titrated dropwise under magnetic driven stirring at an ambient environment to adjust the pH of 8. Four samples of barium hexaferrite powder were prepared with and without nanocrystalline cellulose. The crystalline cellulose of 0.5, 1.0, and 1.5% (w/v) was added to the solution containing bariumhexaferrite precursors. The mixed solutions were heat-treated in the oven at 100 °C until the solution change to brown gel. The gel was fired using a hotplate at about 250 °C–300 °C to form black ash. The resulting black ashes were ground in an agate mortar and then calcined at 900 °C for 2 h.
2.4. Characterization
2.4.1. X-ray diffraction (XRD)
The microcrystalline structure of luffa fiber, fibril cellulose, and nanocrystalline cellulose was observed using an x-ray diffractometer (XRD, Shimadzu Maxima-7000) provided with Cu Kα radiation (λ = 1.5405 Å). The x-ray was operated by scanning the samples in the 2θ range 10°–90° with interval step 0.02° and a step time of 20 s. The XRD was operated at an acceleration voltage of 40 kV and a generation current of 40 mA. The crystallinity index (CI) was determined by the Segal method (Segal et al 1959) using the diffraction peaks intensities of crystalline and amorphous, according to equation (1).

where I002 is the diffraction peak intensity of the (002) plane, Iam is the amorphous part of diffraction intensity located at 2θ between 18°–19° (Boufi and Chaker 2016).
The average crystallite size for nanocrystalline cellulose and barium hexaferrite samples was calculated using the Scherrer's formulae for the highest peak in the XRD spectrum.

where D is the average crystallite size, k is Scherrer constant and was taken to be 0.89 (Al Dairy et al 2019), λ is the x-ray radiation wavelength (1.5405 Å), β is the full-width half maximum of the chosen peak, and θ is the Bragg angle of the peak position.
2.4.2. Fourier transform infrared spectroscopy (FTIR)
The surface functionality of the luffa fiber, fibril cellulose, nanocrystalline cellulose, and barium ferrites was measured by Fourier transform infra-red (FTIR) spectrometer (Shimadzu, Prestige 21) in the range from 4500 to 400 cm−1. The sample for FTIR measurement was prepared by mixing luffa fiber, fibril cellulose, nanocrystalline cellulose, or calcined barium ferrite with KBr and dried to form a thin solid film.
2.4.3. Scanning electron microscopy (SEM) and transmission electron microscopy (TEM)
The surface morphology of luffa fiber, fibril cellulose, nanocrystalline cellulose, and barium ferrites was captured using a scanning electron microscope (SEM, Hitachi SU3500) and transmission electron microscope (TEM, Hitachi HT 7700). The samples for SEM observation were coated with gold with the sputtering apparatus. The transmission micrograph was observed by using TEM operated with an acceleration voltage of 120 kV.
2.4.4. Vibrating sample magnetometer (VSM)
Magnetic hysteresis loop of barium hexaferrites was acquired by vibrating sample magnetometer (Dexing Magnet, VSM250) at room temperature. The hysteresis loop was generated with an applied magnetic field in −20 kOe to 20 kOe.
3. Results and discussion
3.1. Extraction of nanocrystalline cellulose
Two subsequent processes successfully extracted the nanocrystalline cellulose, i.e., refining the luffa fiber to form fibril cellulose and isolating of fibril cellulose to form nanocrystalline cellulose. The extraction of luffa fiber yielded nanocrystalline cellulose of 56%. The XRD technique observed the crystallinity of luffa fiber, fibril cellulose, and nanocrystalline cellulose. Figure 1 depicts the XRD pattern of the synthesized products, which exhibited the diffraction peaks at about 2θ = 15.6° for (110) plane, 22.6° for (002) plane (Motaung and Mtibe 2015), and 34° for (004) plane. The increase in net peak intensity at 2θ = 15.6° and 22.6° indicates the increase in material crystallinity. The crystallinity index of luffa fiber, fibril cellulose, and nanocrystalline cellulose was calculated using equation (1) to be 51.05%, 83.78%, 84.71%, respectively. The values of the crystallinity index (CI) increase as chemical processes proceeded. It is important to note that the CI value is not used to estimate the amount of crystalline and amorphous substance in the sample but is used for comparing the relative difference between samples (Park et al 2010). Thus, the CI's increase from 51.05% to 84.71% indicates a partial reduction of the amorphous part (hemicellulose and lignin) of the sample during alkaline soaking and bleaching of untreated fiber and subsequent strong acid hydrolysis of cellulose sample. Siqueira et al found the CI value of 64% using a similar extraction process for luffa cylindrica (Siqueira et al 2013).

Figure 1. XRD pattern of (a) luffa fiber, (b) fibril cellulose, and (c) nanocrystalline cellulose.
Download figure:
Standard image High-resolution imageThe average crystallite size of nanocrystalline cellulose was determined using Scherrer relation of equation (2). The (002) plane, having the highest peak, was chosen, and the average crystallite size of nanocrystalline cellulose was calculated to be 3.17 nm. As it can be seen from the TEM micrograph that the average particle size of nanocrystalline cellulose is much larger than the crystallite size of nanocrystalline cellulose.
3.1.1. Fourier transform infra-red analysis
FTIR spectra of untreated luffa fiber, fibril cellulose, and nanocrystalline cellulose are shown in figure 2. It is noticed that all spectra pose a similar absorption pattern, which indicates the chemical treatments did not disintegrate the cellulose backbone. The FTIR peaks of luffa acutangula are characterized at about 3400, 2900, 1440 and 850, 1730 and 1250, 1630, 1100 cm−1, which attribute to the absorption spectra of –OH, –CH, C=O, C=C, CO, respectively (Kesraoui et al 2018).

Figure 2. FTIR spectra of (a) luffa fiber, (b) fibril cellulose, and (c) crystalline cellulose.
Download figure:
Standard image High-resolution imageFTIR spectra of luffa fiber are shown in figure 2(a), characterized by a broad absorption band in the 3600–3000 cm−1, the bands at 2900 cm−1, 1730 cm−1, 1520 cm−1, and a group of the absorption band at 1500–800 cm−1 region. The broadband peaked at 3418 cm−1 is the characteristic of the O–H stretching vibration (Liu et al 2017), the absorption bands at 2925 cm−1, 2859 cm−1, and 1443 cm−1 are attributed to the symmetric and asymmetric C–H stretching vibration, respectively (Xie et al 2016b). The absorption bands at 1742 cm−1 are assigned to the C=O stretching vibration of the acetyl and uronic ester of the hemicellulose (Nang et al 2020), and the absorption at 1636 cm−1 is ascribed to the C=C stretching vibration of the aromatic ring in the lignin (Mandal and Chakrabarty 2011). The band at 1240 cm−1 is the C–O groups' absorption band (Tran et al 2017).
Several absorption bands were changed when the fiber was bleached in base solutions (NaOH and NaOCl). The absorption peaks at 3500 cm−1, 2900 cm−1, 1600–600 cm−1 increase and shift slightly to lower wavenumber values, and the band at 1700 cm−1and 1250 cm−1 disappeared, shown in figure 2(b). Increasing the band intensities and shifting the absorption peaks is due to reducing hemicellulose and lignin's amorphous and lignin (Yang et al 2010, Kalpana and Perarasu 2020). Further hydrolysis of fibril cellulose in strong sulfate acid did not change the spectra structure but rather enhanced the absorption intensity and shifted the absorption peak to an even lower wavenumber, shown in figure 2(c). This hydrolysis process was scissoring the amorphous part of cellulose to form nanocrystalline cellulose, enhancing the crystallinity.
3.1.2. Morphological analysis
Figure 3 shows SEM micrographs of the luffa fiber, fibril cellulose, and TEM micrograph of the nanocrystalline cellulose. Figure 3(a) shows that the untreated luffa fiber shows a typical structure consisting of the discrete fibril bundled together. Figure 3(b) shows the luffa fiber's surface morphology treated with 4M NaOH solution. After alkali treatment, the fiber's packed structure was loosened, enhancing the surface roughness and exposing the fibril part. Alkali treatment facilitates removing natural and artificial cellular (hemicellulose, lignin, and wax) layers from the fiber surface to form fibril cellulose (Mohanta and Acharya 2015).
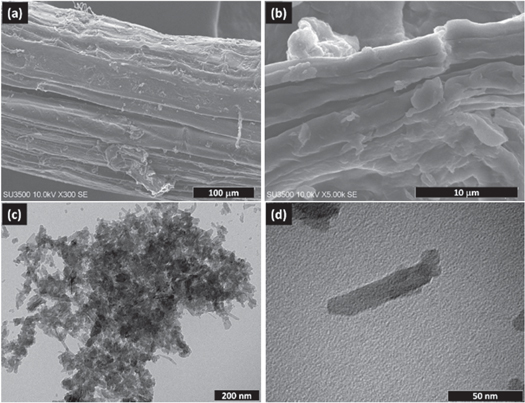
Figure 3. SEM micrograph of (a) luffa fiber, (b) fibril cellulose, and (c) TEM micrograph of nanocrystalline cellulose 30.000× magnification, (d) nanocrystalline cellulose 200.000× magnification.
Download figure:
Standard image High-resolution imageFurther treatment of the fibril cellulose in diluted acid of 45% H2SO4 produced nanocrystalline cellulose. Figure 3(c) shows the typical microstructure of the nanocrystalline cellulose of luffa acutangula. The nano rod-like shape nanocrystalline cellulose has a relatively narrow size distribution. The average length and diameter were determined using digital Image J software of TEM micrograph. The geometric average length and diameter of nanocrystalline cellulose were 42.5 ± 7,1 nm and 10.4 ± 1.7 nm. However, the particle sizes identified by TEM are larger than the crystallite size analyzed from the XRD spectrum. This difference may be due to the cellulose particle is made of several different crystallite celluloses. From the TEM micrograph shown in figure 3(c), the smallest particle (length and diameter) can be identified, comparable to the size of crystallite cellulose. Figure 3(d) shows a magnification of individual nanocrystalline cellulose with about 55 nm in length and 15 nm diameter. The nanocrystalline cellulose size has a different size than the reported size (242 ± 86 nm in length and 5.2 ± 1.3 nm in diameter) for the luffa cylindrical nanocrystalline cellulose (Siqueira et al 2010). Fortuitously, these nanocrystalline sizes are fairly small, providing a large surface area for templating metal ions for the formation of barium hexaferrite.
3.2. Synthesis of barium hexaferrite powder
Figure 4 shows the XRD pattern of barium hexaferrite prepared without using a nanocrystalline cellulose template of 0.5% (w/v) to 1.5% (w/v). The XRD spectra depict similar diffraction patterns attributed to barium hexaferrite polycrystalline corresponding to a hexagonal BaFe12O19 (JCPDS No. 51-1867). There are addition peaks appear at 2θ of 33.1°, 35.6°, and 53.9°, which are attributed to the diffraction peaks of α-Fe2O3 (JCPDS No. 33-0664) for the sample without nanocrystalline cellulose, shown in figure 4(a), and the samples with nanocrystalline cellulose of 1.0% and 1.5%, shown in figures 4(c), (d). Interestingly, the diffraction peaks of α-Fe2O3 were absent for samples synthesized with 0.5% nanocrystalline cellulose, which indicates that the sample is a single-crystal barium hexaferrite.

Figure 4. XRD pattern of BaFe12O19 prepared (a) without nanocrystalline cellulose and (b)–(d) with nanocrystalline cellulose.
Download figure:
Standard image High-resolution imageThe average crystallite size of the samples was obtained by using the Scherrer's formulae. The highest diffraction peak was chosen to calculate the full width of half maximum (β) and the Bragg's diffraction angle (θ). The average crystallite size of barium hexaferrite was calculated using equation (2) and are listed in table 1. It is observed that the average crystallite size barium hexaferrite decreases as the increase in the amount of nanocrystalline cellulose template. It was reported that the crystalline cellulose has a uniform and linear chain structure containing an abundance of hydroxyl sites (Kawamoto 2016). These hydroxyl sites are easily absorbed around the surface of barium hexaferrite crystallite. Adding the nanocrystalline cellulose template during the sol-gel process play a role in dispersing the barium hexaferrite crystallite. This process suppresses the crystallite growth of barium hexaferrite. Adding more the amount of cellulose template enhances dispersity of the crystallite of barium hexaferrite. Thus reduced the crystallite size of barium hexaferrite. The crystallite size of barium hexaferrite prepared without cellulose template was 47.1 nm, which is smaller than that obtained by previous work of 65–66 nm (Kumar et al 2018, Kumar et al 2019). This smaller crystallite size obtained in this work may be due to the smaller annealing temperature (900 °C) than Kumar et al (1000 °C–1200 °C). Mosleh et al showed that barium hexaferrite's crystallite size increased from 37 nm to 87 nm with annealing temperature from 700 °C to 1200 °C (Mosleh et al 2014).
Table 1. Magnetic properties of BaFe12O19 prepared without and with nanocrystalline cellulose template.
| NC | Ms | Mr | Hc | Mr/Ms | K1 | |
|---|---|---|---|---|---|---|
| (w/v) | Crystallite size (nm) | (emu g−1) | (emu g−1) | (kOe) | (erg cm−3) | |
| 0 | 47.1 ± 0.5 | 46.33 ± 0.25 | 15.85 ± 0.25 | 0.97 ± 0.25 | 0.34 | (3.73 ± 0.1) × 105 |
| 0.5% | 44.1 ± 0.5 | 57.43 ± 0.25 | 28.63 ± 0.25 | 3.81 ± 0.25 | 0.50 | (4.64 ± 0.1) × 105 |
| 1.0% | 41.8 ± 0.5 | 54.51 ± 0.25 | 24.63 ± 0.25 | 3.07 ± 0.25 | 0.45 | (4.29 ± 0.1) × 105 |
| 1.5% | 41.2 ± 0.5 | 40.75 ± 0.25 | 19.23 ± 0.25 | 3.37 ± 0.25 | 0.47 | (3.27 ± 0.1) × 105 |
Figure 5 shows typical FTIR spectra of barium ferrite prepared without nanocrystalline cellulose template and using a nanocrystalline cellulose template of 0.5% (w/v) to 1.5% (w/v). All samples' absorption spectra depict similar features, except the samples' spectra developed with nanocrystalline cellulose template of 1.0% and 1.5%. The absorption at 3425 cm−1 is attributed to –OH stretching of absorbed water. In all samples, the absorption band at 585 cm−1 and 434 cm−1 is attributed to the vibration of tetrahedral and octahedral sites of hexagonal barium ferrite (Bahadur et al 2017). It suggests that adding nanocrystalline cellulose did not inhibit barium hexaferrite formation.

Figure 5. FTIR spectra of BaFe12O19 prepared (a) without nanocrystalline cellulose and (b)–(d) with nanocrystalline cellulose.
Download figure:
Standard image High-resolution imageSamples synthesized without and with the nanocrystalline cellulose template of 0.5% (w/v) show the same FTIR features, which implies adding the nanocrystalline cellulose template of 0.5% (w/v) can produce a barium hexaferrite without a detectable template left in the sample. The absorption bands appear at 1618 cm−1 and 1117 cm−1, shown in figures 5(c), (d), correspond to C=C stretching in the aromatic ring and C–O–C stretching ring in-plane in nanocrystalline cellulose, respectively (Liu et al 2006). This band arises from the excess of nanocrystalline cellulose in the compound.
Figure 6 shows the TEM micrographs of barium ferrite prepared without and with the nanocrystalline cellulose template of 0.5% (w/v) to 1.5% (w/v). The barium hexaferrite particles synthesized without using a nanocrystalline cellulose template have a mix of rod-like shape, platelet-like shape, and spherical shape with various sizes, as shown in figure 6(a). Synthesis barium hexaferrite with 0.5% (w/v) produced relatively well-defined platelet-like shape particles, shown in figure 6(b). The average diameter and thickness of the particles is about 170 nm and 35 nm, respectively. Figures 6(c), (d) shows a cluster of barium hexaferrite particles having mixed irregular shapes and sizes. Small particles appear around barium hexaferrite is an excess nanocrystalline cellulose template in the sample. TEM's particle sizes are larger than the crystallite size determined by Scherrer calculation from the XRD spectrum for all samples. A particle of barium hexaferrite maybe contains several different crystallites. Besides, the TEM micrographs of barium hexaferrite in figure 6(a) show several grains having nanosize less than 50 nm, comparable to the crystallite size. However, the nanosize particles in figures 6(c), (d) could not be differentiated between barium hexaferrite and nanocrystalline cellulose. Other groups (Pan et al 2015, Kumar et al 2017) found similar cases of the difference value between particle size observed from TEM micrograph and crystallite size calculated using Scherrer's formulae from XRD data.
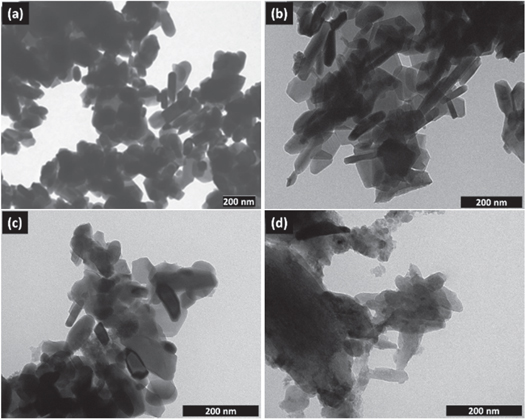
Figure 6. TEM micrographs of BaFe12O19 prepared (a) without nanocrystalline cellulose and (b)–(d) with nanocrystalline cellulose.
Download figure:
Standard image High-resolution imageThe magnetic hysteresis curve measured at room temperature for all samples is displayed in figure 7. Without using a nanocrystalline cellulose template, as shown in figure 7(a), the barium hexaferrite has a slim hysteresis loop, while using the nanocrystalline template of 0.5% (w/v) produced a large and smooth shape of the hysteresis loop, exhibiting typical single-crystal phase magnetic materials (figure 7(b)). The cellulose template facilitates the nucleation and growth of barium hexaferrite. Adding nanocrystalline template of 1.0%–1.5% (w/v) shrink the hysteresis loops figures 7(c)–(d)) and produced a wasp-waisted hysteresis loop around H = 0. This loop shape formation is due to the coexistence of α-Fe2O3 and nanocrystalline cellulose in the sample, as indicated by XRD and FTIR data. The amount of α-Fe2O3 and nanocrystalline cellulose in the sample determine the reduction values of the saturation and remanence magnetizations. The more α-Fe2O3 and nanocrystalline cellulose exists in the sample, the larger values of magnetization are reduced.
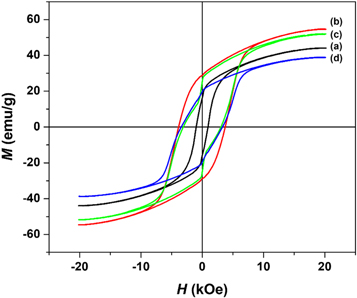
Figure 7. Hysteresis curve of BaFe12O19 prepared (a) without nanocrystalline cellulose and (b)–(d) nanocrystalline cellulose.
Download figure:
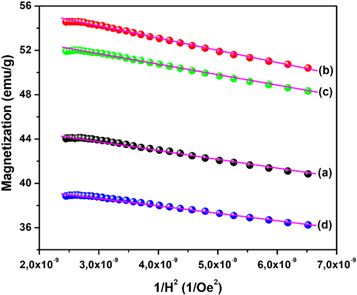
Standard image High-resolution imageThe remanent magnetization (Mr ) and the coercivity (Hc ) can be directly extracted from the hysteresis curve in figure 7 and listed in table 1. However, it is observed that the hysteresis curves of all prepared samples in figure 7 do not attain the saturation at the maximum applied field (20 kOe). The saturation magnetization was then estimated using the Law of Approach to Saturation (LAS) following the previous work (Kumar et al 2018) through the relation:

where Ms
is the saturation magnetization, and K1 is the magnetocrystalline anisotropy. Plot M versus 1/H2 in the applied field between 12 kOe and 20 kOe for all samples, as shown in figure 8. All curves can be fitted with a straight line with a slope equal to  The straight-line intercepted with the M-axis to give the value of saturation magnetization Ms
. The magnetocrystalline constant K1 was calculated using the obtained value of the slope. The estimated values of Ms
and the magnetocrystalline constant K1 for all samples are presented in table 1.
The straight-line intercepted with the M-axis to give the value of saturation magnetization Ms
. The magnetocrystalline constant K1 was calculated using the obtained value of the slope. The estimated values of Ms
and the magnetocrystalline constant K1 for all samples are presented in table 1.
Figure 8. The plot of M versus 1/H2 for BaFe12O19 samples prepared (a) without and (b)–(d) with nanocrystalline cellulose template.
Download figure:
Standard image High-resolution image
In table 1, the Ms value of barium hexaferrite prepared without a template is 46.33 emu g−1, which is smaller compared to the Ms of 56.33 emu g−1 from previous work (Kumar et al 2018). The low Ms for non-templating barium hexaferrite may be largely attributed to the presence of hematite (α-Fe2O3) in the sample (Mohsen 2010), as indicated by XRD data. Templating nanocrystalline cellulose of 0.5% (w/v) enhanced the Ms of 57.43 emu g−1. The increase of Ms could be due to the absence of hematite in the sample, which implies that the sample is a single crystal phase barium hexaferrite. Also, a well-defined hexagonal structure for barium hexaferrite (figure 6(b)) could promote the shape anisotropy and alignment of the magnetic moment in the sample, which contribute to the increase of saturation magnetization and coercive field (Mohamed et al 2019). The Mr /Ms ratio of this sample is calculated to be 0.50, and the particle size of the sample is less than 460 nm, which suggests that the sample is a single-domain barium hexaferrite (Rezlescu et al 1999, Ashiq et al 2014).
Adding more templates decreases the Ms values to 40.75 emu g−1 for 1.5% (w/v), which is smaller than that of the sample prepared without a template. This low Ms may be caused by the higher content of non-magnetic materials (hematite and cellulose template) in the sample, as confirmed from XRD and FTIR data. It is worth noting from table 1 that the constant values of K1 have a similar trend to the Ms values. Both magnetocrystalline anisotropy and saturation magnetization increase with the addition cellulose template of 0.5% (w/v) and then decrease as the cellulose template is added. It implied that non-magnetic materials have a similar effect in reducing the saturation magnetization and the magnetocrystalline anisotropy of barium hexaferrite.
4. Conclusion
Barium hexaferrite powders templated nanocrystalline cellulose has been successfully prepared by sol-gel auto combustion and calcination method. A well-dispersed nanorod crystalline cellulose template with the average length and diameter of 42.5 ± 7,1 nm and 10.4 ± 1.7 nm, respectively, is obtained using base bleaching and acid hydrolysis of luffa acutangula fiber. All the synthesized samples are characterized by XRD pattern to be a polycrystalline barium hexaferrite. Without using a cellulose template, the barium hexaferrite sample contains hematite. Adding cellulose template changes the microstructure and magnetic properties. Using 0.5% (w/v) cellulose template produces a single crystal phase barium hexaferrite without hematite formation. The cellulose template facilitates the nucleation and growth of barium hexaferrite to produce a well-defined hexagonal platelet. The well-defined microstructure and barium hexaferrite's pureness contribute to enhancing saturation magnetization and the magnetocrystalline anisotropy, which decreases by increasing the amount of cellulose template. The excess cellulose template and hematite presence in the sample is the main cause for decreasing the magnetic properties. Controlling the amount of cellulose template in the synthesis of barium hexaferrite can open up possibilities for tailoring the microstructure and improving the magnetic properties.
Acknowledgments
This work was supported by the Institut Teknologi Bandung through the Research, Community Services and Innovation Program, Grant no. 1043/SK/I1.C06/PL/2020.