
Abstract
The main aim of this research is to correlate the toughness improvement with fracture features of tested Charpy V-Notch impact specimens obtained from submerged arc welds enriched by different oxide nanoparticles (TiO2, SiO2, Al2O3 and Mn2O3). Through Scanning Electron Microscopy (SEM) fractography, fracture features were determined, which are the shear fracture percent, the loading angle, as well as the diameter of dimples and the width of cleavage sheets at ductile and brittle fracture regions, respectively. It was observed an increase of the Charpy V-Notch impact energy with the decrease of loading angle and the average diameter of dimples, as well as with the increase of its shear fractures percents. Moreover, it was correlated the increase of Acicular Ferrite surface density with the decrease of width of cleavage sheets. Thus, the toughness of the submerged arc welds can be improved by adding TiO2, SiO2, Al2O3 or Mn2O3 nanoparticles.
Export citation and abstract BibTeX RIS

Original content from this work may be used under the terms of the Creative Commons Attribution 4.0 licence. Any further distribution of this work must maintain attribution to the author(s) and the title of the work, journal citation and DOI.
1. Introduction
It is widely known that the toughness of welds can be improved by retarding the propagation of cleavage cracks through promoting growth of Acicular Ferrite (AF) phase in the weld metal (WM), which has random crystallographic orientation [1]. The formation of AF is stimulated mainly by controlling the chemical composition, size and crystallographic coherence of non-metallic inclusions [2–5].
According to the theory of heterogeneous nucleation, it is necessary to reduce the energy barrier to nucleate certain crystalline phase [6]. The energy barrier for heterogeneous AF nucleation in inclusions decreases significantly as the diameter of the inclusions decreases, due to the increase in surface area. Lee et al have determined that the largest number of inclusions that act as nucleating agents of AF have diameters in the range of 0.5 to 0.8 μm [7]. However, the probability of AF nucleation in these inclusions is considerably less than that of inclusions with a diameter greater than 1 μm. By increasing the size of the inclusions even further, the probability of AF nucleation practically does not change [8].
On the other hand, depending on the chemical composition of the inclusions, which can be classified as oxides, nitrides, sulfides and complex inclusions, the compounds that form them will accentuate or decrease their potential for intergranularly nuclear AF [9]. This allows them to be classified as active or inert inclusions.
The influence of chemical composition on the AF formation is determined by factors such as: (1) residual stresses due to misfit between inclusions and the surrounding metal; (2) thermal deformations in inclusions, and (3) formation of Mn-depletion zones near to MnS inclusions [10–15].
In our previous reports [16–18], we showed that the application of oxide nanoparticles (oxide-NPs), like TiO2, SiO2, Al2O3 or Mn2O3 directly on beveled surfaces of low-carbon steel plates enhances inclusions formation and thus AF nucleation during the Submerged Arc Welding (SAW) process. An increase near of 75% on the AF surface density was well correlated with the double increase of the Charpy V-notch (CVN) impact energy values, which means a toughness improvement of submerged arc welds. Besides, it was concluded that the smaller size of the dimples in the ductile fracture region has an increase in CVN impact energy. In addition, increasing the size of the inclusions shows an increase of the dimples diameter. The decrease in the cleavage sheets size is associated with the formation of AF and grain refinement.
Therefore, the main aim of this research work is to correlate the improvement of toughness, measured as the increase of CVN impact energy, with fracture features of the corresponding submerged arc welds enriched by different oxide-NPs. Besides, it was necessary to characterize the chemical composition and morphological characteristics of inclusions at regions with AF predominant, in order to relate with its own nucleation.
2. Materials and methods
The materials used to form the submerged arc welds consisted of a commercial fused flux, a MK12 electrode with diameter of 5.32 mm, and ten AISI 1025 steel plates. The individual steel plates dimensions were 400 × 125 × 12.7 mm3, beveled at 45° at one of their longest edges, in such a way that, when joining two of them, a simple V-groove was obtained. The chemical composition of flux was verified by SEM-EDS elemental microanalysis, using an x-ray Energy Dispersion Spectrometer Thermo Fisher Scientific, coupled to a SEM-JEOL JSM-6300. The SEM was operated at 20 kV and the EDS with a take-off angle of 30°. On the other hand, the chemical compositions of the M12 K electrode and steel plates were verified by Ultraviolet-Visible Spectroscopy (UV–vis), using a Shimadzu UV 160 spectrophotometer and following the ASTM E352–93 and the ASTM E1019–03 standards. The chemical compositions of the welding materials are shown in table 1.
Table 1. Chemical compositions (wt. %) of welding materials.
| Material | C | Na | Mg | Al | Si | P | S | Ca | Ti | Mn | Cu | Zr | Fe |
|---|---|---|---|---|---|---|---|---|---|---|---|---|---|
| Flux | — | 4.00 | 3.52 | 3.04 | 31.70 | — | — | 20.15 | 2.00 | 35.33 | — | 0.26 | — |
| Electrode | 0.10 | — | — | — | 0.27 | 0.03 | 0.03 | — | — | 1.05 | 0.35 | — | Balance |
| Steel plate | 0.25 | — | — | — | 0.04 | 0.04 | 0.05 | — | — | 0.45 | — | — | Balance |
Before the formation of welds by SAW process, the dust and grease residues on the beveled surfaces of steel plates were removed using isopropanol. Then, oxide-NPs of TiO2, SiO2, Al2O3 and Mn2O3, which physical-chemical characteristics are shown in table 2, were spread along the surface of the V-groove, in a solution with ethanol.
Table 2. Characteristics of oxide-NPs.
| Nanoparticle | Average diameter [nm] | Density [g ml−1] | Purity [wt.%] |
|---|---|---|---|
| TiO2-n | 21 | 4.26 | ≥ 99.6 |
| SiO2-n | 20 | 0.08–0.10 | ≥ 99.5 |
| Al2O3-n | 13 | 0.05 | ≥ 99.8 |
| Mn2O3-n | 40–60 | 1.20 | ≥ 99.0 |
Submerged arc welds were formed with a Lincoln NA-3 s automatic welding machine, operated at 600 A, 30 V, Direct Current Straight Polarity and electrode protrusion of 10 mm. The SAW process was carried out following the AISI/AWS A5.20/A5.20 M:2005 and AINSI Z49 .1 standards. Besides, in order to compare the microstructure and mechanical properties of submerged arc welds, a control weld was obtained using only the welding materials, i. e., without the addition of oxide-NPs. This submerged arc weld was named as WB-0.
The welding speed was generally 16 in min−1, however, it was modified to avoid the appearance of pores and defects in the weld metal of submerged arc welds enriched by oxide-NPs, see table 3. These defects appear due to the form of oxide-NPs addition, because decreases the molten metal fluidity and, with it, modified of the cooling rate.
Table 3. Welding speeds used during formation of submerged arc welds.
| Particle added | Nomenclature | Welding speed [in min−1] |
|---|---|---|
| Control | WB-0 | 16 (1st-4th pass) |
| TiO2-n | WB-T | 16 (1st) y 13 (2nd—4th pass) |
| SiO2-n | WB-S | |
| Al2O3-n | WB-A | |
| Mn2O3-n | WB-M |
The chemical composition of the submerged arc welds was determined by using a Shimadzu UV-160 UV–vis spectrometer, following the ASTM E352–93 and the ASTM E1019-03 standard test methods. For this, a G4 ICARUS Series 2 combustion analyzer with HF induction furnace and HighSense detection.
AF surface density and their respective morphological characteristics at the weld metal region was analyzed by Optical (OM) and SEM Microscopies. To do this, cross sections sheets of the welds were mirror polished and micro etched with 2% Nital for 8 s, to reveal their resulting microstructures.
OM metallographies were obtained at 200x magnification, using an Olympus PMG3 inverted metallographic microscope; meanwhile, those corresponding by SEM were obtained using a FEG-SEM FEI-XL30-Sirion, operated at 25 kV and spot size 5. Besides, the inclusions characteristics (morphology and chemical composition) were determined at regions with predominant AF phase. In particular, chemical composition of inclusions was determined by SEM-EDS elemental microanalysis, using a Thermo Fisher Scientific x-ray Energy Scattering Spectrometer. The SEM was operated at 25 kV, with Spot Size 5 and taking-off angle of 35°.
On the other hand, toughness of all submerged arc welds was evaluated by quadruplicate in specimens with 10 × 10 × 55 mm3 dimensions at room temperature, through the CVN impact test, employing a Tinius Olsen MP1/1 impact machine and following the ASTM E23 standard. In addition, in order to correlate the CVN impact energy with the fracture features, SEM fractography analysis was performed on the surfaces of the tested CVN impact specimens, being the FEG-SEM FEI-XL30-Sirion operated at 20 kV and Spot Size 3.
3. Results and discussion
3.1. Microstructure of WM and characteristics of inclusions
Table 4 shows the WM chemical composition of WB-0, W-T, WB-S, WB-A and WB-M submerged arc welds.
Table 4. Chemical composition (wt.%) of WM in submerged arc welds by UV–vis Spectroscopy.
| Weld | C | Mn | Si | S | Al | Cu | Fe |
|---|---|---|---|---|---|---|---|
| WB-0 | 0.13 | 1.48 | 0.57 | 0.012 | 0 | 0 | Balance |
| WB-T | 0.08 | 1.73 | 0.21 | 0.0053 | 0.014 | 0.068 | |
| WB-S | 0.14 | 1.49 | 0.2 | 0.0042 | 0.012 | 0.038 | |
| WB-A | 0.13 | 1.39 | 0.21 | 0.0049 | 0.016 | 0.04 | |
| WB-M | 0.1 | 1.56 | 0.18 | 0.0058 | 0.008 | 0.069 |
It is expected that the greatest contribution in the chemical composition of the WM comes from the flux and the electrode (see table 1). If we analyze the content of C it is very close to or slightly higher than that of the electrode; This may be due to the fact that C reacts easily with the O from the oxides in the flux, which are dissolved in the molten metal, which in turn form CO and CO2 and are subsequently eliminated into the atmosphere.
Mn and Si contents are also very similar to that of the electrode with a slight increase, especially in Mn, noting the contribution of the flux. According to Bennet et al [19], the content of MnO and SiO2 in the flux increases the levels of Mn and Si in the MS, which contribute to the formation of complex oxides, which in turn form non-metallic inclusions and facilitate growth. of the AF phase in the submerged arc welds. Mn content of MS with Nps, WB-T, WB-S and WB-M is always greater than that of WB-0 by 17, 1 and 5%, respectively. Only for WB-A, the Mn content is less by 6%. In addition, the difference is made more noticeable by the addition of TiO2-n, compared to other submerged arc welds. These results agree that the addition of Ti to the weld pool favors the transfer and retention of Mn [20, 21]. In contrast, submerged arc welds with added Nps have lower Si content, 65% on average compared to WB-0.
Meanwhile, the Cu content comes exclusively from the electrode, being retained in greater quantity by the submerged arc welds with Nps of TiO2-n and Mn2O3-n. On the other hand, the Al that comes exclusively from the flux is retained at 125 ppm by all the submerged arc welds with added Nps.
On the other hand, the weld metal microstructure, as shown in figures 1(a)–(e), presents the allotriomorphic ferrite (AL-Fe) and acicular ferrite (AF) phases, the latter being distinguished by its interlocking needle-shaped grains.
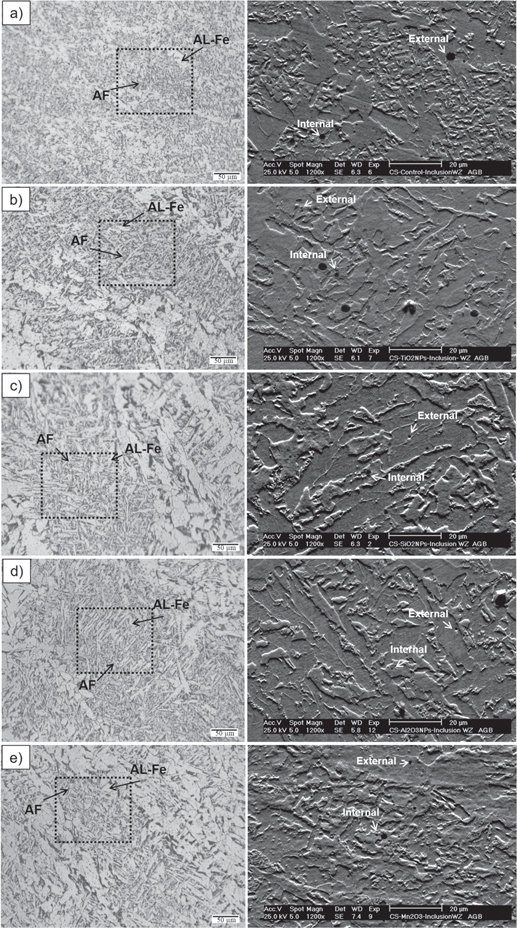
Figure 1. Images by OM (left) and by SEM (right) at the WM of (a) WB-0, (b) WB-T, (c) WB-S, (d) WB-A and (e) WB-M, showing colonies with abundant AF phase and some Internal and External inclusions.
Download figure:
Standard image High-resolution imageFigure 1 shows that the AF phase mainly grows in the dendritic solidification regions of the weld metal region. Given the importance that AF phase has in the mechanical properties of the different submerged arc welds, its morphological characteristics (length, width and surface density percent), as are shown in table 5, were directly determined on the OM metallographic images. The length and width were measured by ImageJ software v.1.51j8, reporting the averages obtained by processing more than 20 images, in which there were more than 40 AF needles. Meanwhile, the surface density percent was determined by placing a millimeter grid metallographic images, obtaining the ratio of the number of sheets occupied by the AF phase over the total number of sheets encompassing the millimeter grid.
Table 5. Morphological characteristics of AF needles in each weld bead.
| Weld | Length [μm] | Width [μm] | Surface density [%] |
|---|---|---|---|
| WB-0 | 10.5 ± 0.4 | 2.3 ± 0.3 | 25.6 ± 1.8 |
| WB-T | 26.8 ± 0.2 | 3.3 ± 0.2 | 41.3 ± 2.2 |
| WB-S | 23.8 ± 0.4 | 3.7 ± 0.2 | 41.6 ± 1.9 |
| WB-A | 28.2 ± 0.3 | 4.1 ± 0.3 | 42.3 ± 2.0 |
| WB-M | 24.3 ± 0.5 | 3.9 ± 0.2 | 36.4 ± 2.5 |
In table 5, it is observed that both length, width and surface density percent of the AF are greater in the weld metal with added oxide-NPs compared to that of the WB-0. These increases of superficial density percents are framed in table 6.
Table 6. Increase percentages of AF needles morphological characteristics with respect to the WB-0.
| Weld | Δ Length | Δ Width | Δ Surface density |
|---|---|---|---|
| WB-T | 155.2 | 43.5 | 61.3 |
| WB-S | 126.7 | 60.9 | 62.5 |
| WB-A | 168.6 | 78.3 | 65.2 |
| WB-M | 131.4 | 69.6 | 42.2 |
It is observed that Al2O3-n are the ones that induce a greater growth in long and wide AF needles. From these results, it can be established that the type of added oxide-NP influences the morphological characteristics of AF needles.
SEM metallographic images (right side in figure 1) show that most of the inclusions, whose morphology is spheroidal, are found in regions with high surface density of AF needles; they can be classified into two types: Internal that are located inside of above regions, and the External located mainly in regions with AL-Fe and that are outside of the AF colonies. Figure 2 shows the size distribution of Internal and External inclusions in the WM for different submerged arc welds.

Figure 2. Size distribution of Internal (left) and External (right) inclusions in the WM of (a) WB-0, (b) WB-T, (c) WB-S, (d) WB-A and (e) WB-M.
Download figure:
Standard image High-resolution imageAs can be seen in table 7, these ranges vary from 0.91 to 1.35 μm and from 2.56 to 4.37 μm for the Internal and External inclusions, respectively.
Table 7. Average diameter [μm] of the present inclusions on WM region.
| Weld | Nanoparticle | Internal | External |
|---|---|---|---|
| WB-0 | — | 1.35 ± 0.06 | 2.56 ± 0.05 |
| WB-T | TiO2-n | 1.16 ± 0.04 | 4.37 ± 0.04 |
| WB-S | SiO2-n | 0.95 ± 0.05 | 3.37 ± 0.07 |
| WB-A | Al2O3-n | 0.91 ± 0.05 | 3.23 ± 0.06 |
| WB-M | Mn2O3-n | 1.06 ± 0.04 | 2.84 ± 0.04 |
In particular, the internal inclusions diameters are within the range reported by other authors [7, 8], who conclude that they promote the growth of the AF phase, acting as nucleation sites. To visualize this, in figure 3 the values of the surface densities (table 5) were plotted as a function of the internal inclusions diameter (table 7). It can be observed that the surface density of the AF needles is greater as the average diameter of the internal inclusions decreases.

Figure 3. Relationship between the AF surface density and the internal inclusions diameter in the WM of submerged arc welds.
Download figure:
Standard image High-resolution imageThe chemical compositions of the internal inclusions in the weld metal were punctually determined by SEM-EDS on dozens of inclusions and the average chemical compositions are shown in table 8. Of course, when a particle analysis is carried out in a MEB, the uncertainty always prevails as to whether the surrounding material, in this case the weld metal, is reached by the incident electron beam and the x-rays generated contribute to the analysis of inclusions.
Table 8. Chemical composition (wt. %) of internal inclusions and surrounding weld metal (Matrix) by EDS.
| Inclusions in: | C | O | Mg | Al | Si | S | Ca | Ti | V | Mn | Fe |
|---|---|---|---|---|---|---|---|---|---|---|---|
| WM-0 | 2.9 | 14.0 | 0.1 | 7.3 | 5.8 | 0.4 | 0.2 | 1.1 | 0.1 | 8.9 | 59.2 |
| WM-T | 2.0 | 13.7 | 0.3 | 1.0 | 6.3 | 0.3 | 0.2 | 1.7 | 0.1 | 13.2 | 61.4 |
| WM-S | 2.6 | 16.3 | 0.1 | 2.6 | 8.2 | 0.5 | 0.1 | 2.1 | 0.1 | 18.5 | 48.9 |
| WM-A | 3.2 | 13.6 | 0.4 | 2.9 | 7.6 | 0.4 | 0.2 | 1.4 | 0.1 | 13.6 | 56.6 |
| WM-M | 2.1 | 11.7 | 0.9 | 3.6 | 5.9 | 0.5 | 1.6 | 1.4 | 0.2 | 16.0 | 56.1 |
| Matrix | 3.3 | 1.9 | 0.0 | 0.2 | 0.7 | 0.1 | 0.1 | 0.1 | 0.1 | 1.5 | 92.0 |
In order to rule this out, calculations of the electron beam penetration range at 20 kV were made using the Kanaya-Okayama equation [22], obtaining average values of 0.9 and 0.4 μm for inclusions and weld metal, respectively. In this way, the calculated penetration was always less than or equal to the average diameters of the internal inclusions, which indicates a minimal interaction of the electron beam with the weld metal below the inclusions. For reference, the average chemical composition of the surrounding weld metal (WM, table 8) to the inclusions was also determined. It is observed that most of the elements have higher concentrations in the inclusions than in the weld metal.
In particular Ti, Si, Al and Mn, important elements in the inclusions formation, are detected with substantially higher contents than in the Matrix, which gives certainty that they are indeed part of them. On the other hand, the inclusions of the submerged arc welds with added oxide-NPs showed a higher percentage content by weight of Ti and Mn compared to WB-0, so it can be established as a direct influence of the addition of oxide-NPs. Furthermore, when SiO2-n is added to the submerged arc welds, the highest Si values are obtained in the internal inclusions. Adding Mn2O3-n to the submerged arc weld (WB-M) yields one of the highest Mn values, second only to the WB-S by 2.5 percentage points. If Al2O3-n is added to the submerged arc weld (WB-A), a high content of Al is obtained in the Internal inclusions of the WB-A, only surpassed by the WB-M in 0.7 percentage points.
This allows to establish an influence on the type of oxide added as nanoparticle, and the content of the internal inclusions. In this way, it is possible to control the formation of the active inclusions of complex oxides that favors growth of AF and avoid the formation of those that inhibit it. For example, complex oxides of Al2O3 [23, 24] have been reported to inhibit the growth of the AF phase, which may be occurring in WB-0 with a high content of Al and O in its inclusions (table 8) and that at the same time presents the lowest percentage of surface density of AF (table 5).
3.2. CVN impact energy and fracture features
The results of the CVN impact test for weld beads without and with added oxide-NPs are shown in table 9.
Table 9. CVN impact energy of submerged arc welds.
| Weld | 1 | 2 | 3 | 4 | Average a |
|---|---|---|---|---|---|
| WB-0 | 78.7 | 73.2 | 89.5 | 81.3 | 80.0 ± 1.3 |
| WB-T | 94.0 | 101.0 | 136.0 | 108.0 | 104.5 ± 3.5 |
| WB-S | 157.3 | 141.0 | 146.4 | 147.8 | 147.1 ± 0.7 |
| WB-A | 115.2 | 119.3 | 122.0 | 151.9 | 120.7 ± 1.4 |
| WB-M | 122.0 | 168.0 | 126.0 | 130.0 | 128.0 ± 2.0 |
a According to the Mexican NMX-H-077-CANACERO-2017 standard, it is specified that for the evaluation of results, the highest and lowest value of the test should be discarded for all designations that require an impact test. The remaining values must be the same, or their energy level must be at least 27 J.
It can be seen that the CVN impact energy is always higher for the submerged arc welds with added oxide-NPs compared to the WB-0. The percentages increased 30.6, 83.9, 50.9 and 60% for WB-T, WB-S, WB-A and WB-M, respectively. This means a clear increase in toughness in the submerged arc weld, by adding oxide-NPs, especially SiO2-n, where the impact energy is higher than obtained for WB-0.
The loading angles (α) and the shear fracture percent (% Fs ) of the tested CVN impact specimens were determined following the methodology indicated in Annex A6 of the Standard Methods for Impact Tests on Bars with Notched Metallic Materials (ASTM E23). The loading angles were determined for each of the tested CVN impact specimens, measuring the angle α resulting from joining the broken parts, as shown in figure 4(a).
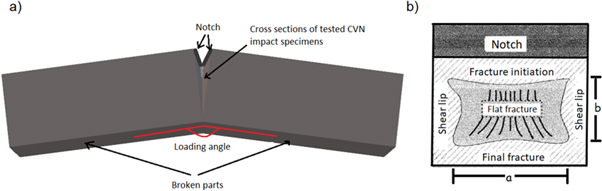
Figure 4. (a) Determination of loading angle α and (b) shear fracture area of the CVN impact specimens tested.
Download figure:
Standard image High-resolution imageOn the other hand, the shear fracture percent was determined by measuring the length ( ) and width (
 ) over the flat fracture region of each specimen cross section, shown in figure 4(b). Once these values were measured, the flat fracture area (Af
) was calculated, multiplying the length and width. Then, taking into account that the average specimen cross-section area before being tested (Ai
) is 8 × 10 mm = 80 mm2, and that the notch depth is 2 mm. Then, the percentage difference between Ai and Ap
is calculated as indicated by the following formula:
) over the flat fracture region of each specimen cross section, shown in figure 4(b). Once these values were measured, the flat fracture area (Af
) was calculated, multiplying the length and width. Then, taking into account that the average specimen cross-section area before being tested (Ai
) is 8 × 10 mm = 80 mm2, and that the notch depth is 2 mm. Then, the percentage difference between Ai and Ap
is calculated as indicated by the following formula:

The average values of α, 
 Af
and %Fs
are shown in table 10.
Af
and %Fs
are shown in table 10.
Table 10. Parameters of fractographies made on the tested CVN impact specimens.
| Specimen | α [°] | a [mm] | b [mm] | Af [mm2] | % Fs [%] |
|---|---|---|---|---|---|
| WB-0 | 164 ± 0.5 | 7.2 ± 0.2 | 4.6 ± 0.1 | 33.1 ± 0.2 | 58.6 ± 0.2 |
| WB-T | 161 ± 0.5 | 6 ± 0.1 | 5.1 ± 0.3 | 30.6 ± 0.3 | 61.8 ± 0.3 |
| WB-S | 123 ± 0.5 | 6.7 ± 0.2 | 2.7 ± 0.1 | 18.1 ± 0.2 | 77.4 ± 0.2 |
| WB-A | 144 ± 0.5 | 6.9 ± 0.2 | 3.6 ± 0.2 | 24.8 ± 0.4 | 69.0 ± 0.4 |
| WB-M | 134 ± 0.5 | 5.2 ± 0.1 | 3.1 ± 0.3 | 16.1 ± 0.3 | 79.9 ± 0.3 |
In figure 5, it is observed that as the loading angle decreases or as the shear fracture percent of the tested CVN impact specimens for each submerged arc weld increases, the CVN impact energy increases. Higher loading angle means that the fracture of the specimen took place with less deformation, and therefore required less CVN impact energy. Higher shear fracture percent means that the region that defines resistance to the separation of the specimen into two pieces, was greater and with it also the required CVN impact energy.
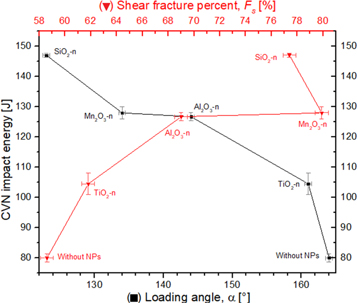
Figure 5. Behavior of the CVN impact energy with the loading angle (α) and with the shear fracture percent.
Download figure:
Standard image High-resolution imageOn the other hand, ductile fracture regions, such as those shown in figures 6(a)–(e), form the shear lips, that is, the edge contiguous to the notch and the edge opposite to the final fracture region. In contrast, brittle fracture regions, such as those shown in figures 7(a)–(e), were located only in the center of the flat fracture, delimited by  and
and  (figure 4(b)). In this region, some small islands of ductile fracture are found, such as the one shown in figure 7(c).
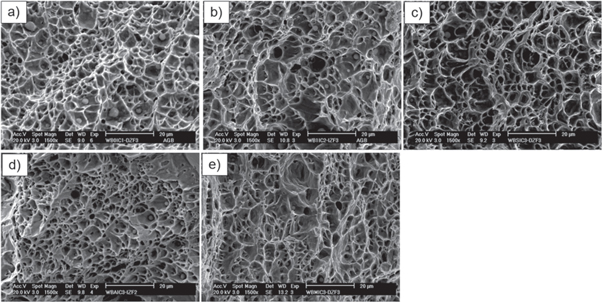
Figure 6. SEM fractographies of the ductile fracture regions in the tested CVN impact specimens for (a) WB-0, (b) WB-T, (c) WB-S, (d) WB-A and (e) WB -M.
Download figure:
Standard image High-resolution image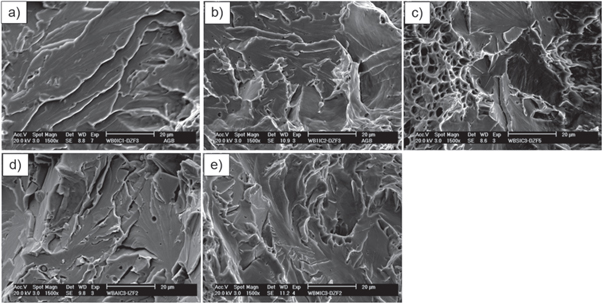
Figure 7. SEM-fractographies showing the cleavage facets of brittle fracture regions in tested CVN impact specimens for (a) WB-0, (b) WB-T, (c) WB-S, (d) WB-A and (e) WB -M.
Download figure:
Standard image High-resolution imageThese results are in accordance with the ASTM E23 standard, where near the V-notch, a plastic deformation of the grains occurs, leading to fibrous breakage, that is, a ductile type fracture. As the fracture moves away from the notch, the crack propagation becomes unstable, whereby the cleavage mechanism changes and complete grain separations occur, i.e. a brittle intergranular fracture. These cracks move radially, from the center of the sample to the edges. The last section of separation of the specimens takes place again ductility on the edge and opposite side of the notch, thus forming the ductile fracture cutting lips that delimit the brittle fracture region in the center of the cutting surface. In ductile fracture, excision occurs after plastic stretching of the material, resulting in the formation of intragranular microcavities or dimples; the greater this stretch, the deeper the cavity will be. In table 11 the average diameters of these dimples are framed and in figure 8 they are plotted against the CVN impact energy.
Table 11. Dimples diameter and cleavage sheets width.
| Specimen | Dimples diameter [μm] | Cleavage sheets with [μm] |
|---|---|---|
| WB-0 | 3.3 ± 0.1 | 16.6 ± 0.4 |
| WB-T | 3.1 ± 0.1 | 9.7 ± 0.6 |
| WB-S | 2.5 ± 0.1 | 6.2 ± 0.3 |
| WB-A | 2.7 ± 0.1 | 5.5 ± 0.5 |
| WB-M | 2.8 ± 0.1 | 13.1 ± 0.4 |
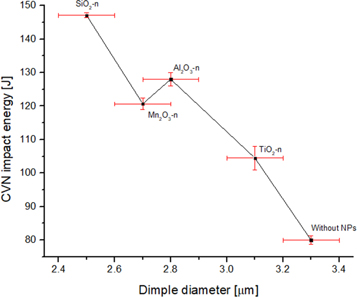
Figure 8. CVN impact energy as a function of the dimple diameter.
Download figure:
Standard image High-resolution imageAn increase in the impact energy is observed as the diameter decreases, this is explained because the smaller the microcavity, there will be a greater number of walls resisting stretching, which will require more CVN impact energy to cause the brittle fracture. This is in agreement with Zhou and Chew [25], who report an increase in CVN impact energy associated with a decrease in the dimple diameter in the ductile fracture regions.
On the contrary, in brittle fracture the cleavage occurs by a sudden separation of the grains, so that a minimum consumption of Impact energy is required. This intergranular fracture reveals the facets of the grains (figure 7), whose measured average widths are framed in table 10. The sizes of these cleavage sheets agree with the grain sizes observed in the SEM metallographies of figure 7, corresponding to the WM, as expected as there was no grain deformation in the brittle fracture region. This criterion of CVN impact energy consumption by the different types of fracture coherently explains the inverse behavior of CVN impact energy with the brittle fracture area, shown in table 10. As the CVN impact energy increases, the brittle fracture area decreases, or equivalently the brittle fracture area increases, which will require higher CVN impact energy consumption.
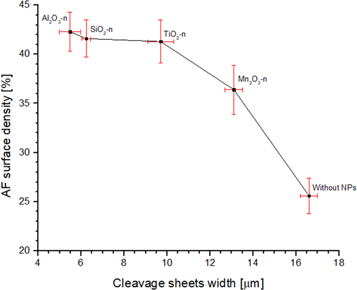
From the values reported in table 11, it is observed that both the dimples and the cleavage sheets are smaller in the submerged arc welds with oxide-NPs than in the WB-0. Compared to WB-0, the average dimples diameters are 6.1, 24.2, 18.2 and 15.2% higher in the welds WB-T, WB-S, WB-A and WB-M, respectively; while the thicknesses of the cleavage sheets are 41.6, 62.7, 66.9 and 21.1% less and in the same order already mentioned, respectively. Therefore, in figure 9 it can be seen that as the width of the cleavage sheets decreases (table 11), the superficial density of AF increases (table 6), which also agrees with other investigations [19, 23, 26], where the decrease is associated with AF formation and grain size refinement resulting in smaller cleavage sheets in the ductile fracture region.
Figure 9. AF Surface density as a function of the cleavage sheets width.
Download figure:
Standard image High-resolution image
In this way, both the increase in CVN impact energy and the AF-needles surface density can be correlated with the decrease in the average dimples diameter and the cleavage sheets width, respectively. This allows to conclude that the toughness of the submerged arc welds can be improved by adding oxide-NPs.
4. Conclusions
The significant technological and scientific contributions of this work are the innovative way to add oxide-NPs to the submerged arc welding process with the successful improvement of the mechanical properties of the WB, scientifically correlated with the induced microstructure. According to the results obtained in this research work, it can be concluded that:
- 1.The type of added oxide-NP influences the morphological characteristics of AF needles. In particular, Al2O3-n induce a greater increase in the dimensions of AF needles; while Mn2O3-n promote a higher percentage surface density.
- 2.The range of diameters of the Internal inclusions contributed to accentuate their behavior as heterogeneous nucleation sites, promoting the growth of the AF phase. Furthermore, it was observed that as the diameter of the Internal inclusions decreased, the surface density of the AF needles increased.
- 3.It was observed an influence between the type of oxide-NPs added to the WM and the content of the Internal inclusions. Addition of TiO2- and SiO2-n increases the content of Ti and Si in the Internal inclusions of the WM, respectively. On the other hand, despite the fact that the addition of Al2O3-n and Mn2O3-n significantly increases the content of Al and Mn, respectively, it is surpassed by the addition of Mn2O3-n and SiO2-n, respectively.
- 4.CVN impact energy increased as loading angle and shear fracture percent decreased and increased in tested CVN impact specimens, respectively. Higher loading angle means that the fracture of the specimen took place with less deformation, and therefore required less CVN impact energy. On the other hand, a higher fraction of fracture per cleavage means that the region it defines resisted the separation of the specimen into two pieces, it was greater and with it also the required impact energy.
- 5.The increase in CVN impact energy and the density of the surface of the AF needles correlates with the decrease in the average dimples diameter, due to the fact that there are a greater number of walls resisting stretching, which will require more CVN impact energy, which turns on ductile fracture. In addition, the CVN impact energy increased so as the width of the cleavage sheets decreased, mainly due to the fact that in the brittle fracture the cleavage occurs due to a sudden separation of the grains, so that a minimum consumption of the CVN impact energy is required.
Acknowledgments
The authors are grateful for the support provided by laboratories of the ESFM-IPN, ESIQIE-IPN, UAM-Azcapotzalco and Physics Department of CINVESTAV-Zacatenco.
Data availability statement
No new data were created or analysed in this study.