
Abstract
Hot form quench (HFQ®) is a novel hot stamping process to deform complex-shaped parts applied in automobile industry, and interfacial heat transfer coefficient (IHTC) play an important role in HFQ® process. In this research, the average IHTC values were compared under different forming conditions during die quenching based on the calculation and finite element (FE) simulation results. Beside, transmission electron microscope (TEM), differential scanning calorimeter (DSC) and tensile tests were performed to investigate the relationship among IHTC, microstuructures and mechanical properties. The results show that the experimental results agree well with those achieved by FE simulation. The value of IHTC for AA7075 increased with the increased contact pressure during HFQ® process. In contrast, the increasing temperature of forming die has a negative impact on IHTC. The critical quenching rate (Qc), inducing the formation of a large number of equilibrium phases η, is between 14.3 °C s−1–18.5 °C s−1, and the corresponding IHTC range is 2468 W·m2 k–2656 W·m2 k. With regard to the condition with cooling rate lower than Qc, the formation of a large amount of η is recognized as the reason for the strength decrease.
Export citation and abstract BibTeX RIS

Original content from this work may be used under the terms of the Creative Commons Attribution 4.0 licence. Any further distribution of this work must maintain attribution to the author(s) and the title of the work, journal citation and DOI.
1. Introduction
The demands for weight reduction in aerospace and automotive fields are increasing, and as a kind of light alloy, the development of aluminum alloy is particularly important in this environment [1–3]. 7000 series aluminum alloy, with high strength, has been considered to be a good choice to replace steels in automotive industry, such as A pillar, B pillar and so on. However, the poor formability of high strength Al alloy at room temperature is still a major problem that needs to be overcome urgently nowadays. Recently, Lin et al proposed a novel hot form quench (HFQ®) process, which is suitable for the forming of complex-shaped workpiece [4].
HFQ® process is mainly composed of solution heat treatment (SHT), die quenching and artificial ageing. SHT is conducted for obtaining the supersaturated solid solution (SSSS), and the purpose of artificial ageing is to make fine precipitates form for achieving high strength. The feature of die quenching is that forming and quenching are performed at the same time [5]. Fan et al utilized cold-hot forming dies to investigate the strengthening behavior of Al-Cu-Mg alloy during HFQ® process, demonstrating that precipitation strengthening is the main strengthening mechanism, and the temperature of both dies can only be heated up to 250 °C in order to avoid the formation of coarse S phase [6]. Fakir et al established a model of finite element (FE) to study the detailed forming process of HFQ® for AA5754, indicating excellent thickness uniformity can be obtained by moderate forming speed [7]. During HFQ® process, appropriate cooling rate, induced by high interfacial heat transfer efficiency, not only enables to 'freeze' the supersaturated solid solution (SSSS) for the subsequent artificial ageing, but also ensures good formability of materials. Nevertheless, excessive interfacial heat transfer efficiency is meaningless. Liu et al demonstrated that, when the average cooling rate of 7055 aluminum alloy was greater than about 500 °C s−1, the increment of the hardness of the alloy was almost equal to the zero [8]. When the interfacial heat transfer efficiency is low, results in a decline of the cooling rate of workpiece, which may be beneficial for the formability. However, when the cooling rate is lower than a certain value, which is defined as the critical value determined by Time-Temperature-Properties (TTP) curves, it would cause a rapid drop in strength of the alloy [9]. A Deschamps and Y Brechet investigated the effect of cooling rate on ageing response of Zr-containing Al-Zn-Mg alloy, indicating a slow quench can induce a more sensitive ageing response [10]. Zheng et al used isothermal high-temperature delay experiments to study the influence of HFQ® conditions on the microstructure evolution and mechanical properties for AA7075 and AA6082, indicating that the decline of the strength was attributed to the formation of coarse η in the sensitive temperature range [11].
It is thus clear that, cooling rate, determined by interfacial heat transfer efficiency, play an important role in die quenching of HFQ® process, and the effect of which can be well characterized by interfacial heat transfer coefficients (IHTC). Zheng et al used a one-dimensional (1D) model to investigate the in-die quenching efficiency for AA6082, concluding that the temperature of die surface evolution and quenching time depend on the contacting pressure [12]. Ying et al compared the approach of heat balance method (HBM) and Beck's nonlinear estimation method (Beck's method) for calculating the value of the transient IHTC, and the results showed that the latter is more accurate than the former based on cylindrical-die experimental model [13]. Liu et al used the FE software PAM-STAMP to simulate the temperature evolution in stamping process, and develop a IHTC model to predict the IHTC values under different conditions (including contact pressure, tool material and lubricant thickness) [14]. The influences thermo-physical properties of material and the anti-oxidation surface coating on IHTC of 22MnB5 steel were also discussed by Chang et al and the results showed that the IHTC increase with the increasing contact pressure, in contrast, the increasing roughness has a negative effect on IHTC [15].
To date, the investigations related to the relationship among IHTC, microstructure and mechanical properties for high strength aluminum alloys are still lacking. Therefore in this paper, the authors analyzed the reason for the change of average IHTC value for AA7075 under different forming conditions (i.e. die temperature and contacting pressure), and the experimental results were verified with FE simulation by using ABAQUS software. In addition, the correlation between IHTC and precipitation behavior, and the effect of IHTC on mechanical properties were also detailed investigated.
2. Experimental method and the calculation of IHTC
2.1. Experimental materials and method
Rolled AA7075-T6 sheet with 1.5 mm thickness was adopted in die quenching experiments and its nominal chemistry compositions are shown in table 1.
Table 1. Nominal chemical composition of AA7075 (mass, %).
| Zn | Mg | Cu | Fe | Si | Mn | Cr | Ti | Others | Al |
|---|---|---|---|---|---|---|---|---|---|
| 5.5 | 2.2 | 1.8 | 0.47 | 0.38 | 0.26 | 0.20 | 0.20 | ≤ 0.05 | Bal. |
Figure 1 shows the schematic illustration of the experimental process for die quenching. At first, solution heat treatment (SHT) was conducted at 480 °C for 1 h in a furnace. Then the blank was transferred to the press machine to carry on die quenching. The die temperature and contact pressure are 25 °C, 100 °C, 200 °C, 300 °C, 400 °C and 5 MPa, 10 MPa, 20 MPa, respectively. The specimens for die quenching were prepared through cutting AA7075 alloy sheet into a disc with 100 mm diameter. The upper and lower cylindrical dies were made of H13 steel with a height of 40 mm and diameter of 100 mm, and the nominal chemistry composition was shown in table 2. A K-type thermocouple was inserted into the hole of the specimen center. Considering the symmetry, temperature collection was only performed for the lower die, and another two thermocouples were embedded into the holes at 1 mm and 2 mm below the lower die surface. Temperature change was recorded through the connecting thermocouple with a four-channel temperature collector (MIK-R9600), and the time-temperature data was used as output for computer analysis. Finally, peak-aged heat treatment was performed for AA7075.

Figure 1. The schematic illustration of experimental process for die quenching.
Download figure:
Standard image High-resolution imageTable 2. Nominal chemical composition of H13 steel (mass, %).
| C | Cr | Mo | Si | V | Cu | Mn | P | Ni | S | Fe |
|---|---|---|---|---|---|---|---|---|---|---|
| 0.38 | 5.23 | 1.38 | 0.96 | 0.97 | 0.07 | 0.34 | 0.01 | 0.09 | 0.003 | Bal. |
The microstructure evolution was characterized by transmission electron microscope (JEM2100-TEM), and the TEM samples were polished with a solution of 70% methanol and 30% nitric acid at −30 °C/12 V. Differential scanning calorimeter (DSC) with a 10 °C s−1 heating rate was utilized to further study the phase transformation behavior of AA7075. Tensile tests were carried out at a strain rate of 10−3 s−1 on a universal testing machine (SANSCMT 5000). Finite element simulation (FE) was performed by using ABAQUS software in order to verify the results of experiments. Blank and die were arranged as plastic body and discrete rigid body, respectively. Material properties, experimental parameters and calculated results were referred for model establishment and boundary condition setting. When holding the pressure, the 'surface-to-surface' contact method was utilized for blank and the die, and the 'surface film condition' and the 'surface radiation' contact method were set when the edge of the blank is in contact with the air. In the mean time, setting the temperature output variable to time points, the interval of each time point is 0.1 s, and a total of 150 time points are output.
2.2. The calculation of IHTC
During die quenching, heat radiation and heat convection are considered to contribute little to heat transfer, and the main mechanism of heat transfer is heat conduction [16]. Due to the cylindrical shape for specimens and forming die, the calculation of IHTC can be simplified into one-dimensional problems of heat transfer.
Biot number (Bi) can characterize the ratio of the conduction resistance to the transfer resistance, and it can be described as:

where δ (0.75 mm) is the 1/2 thickness of the blank, α is interfacial heat transfer coefficient, and the value of which can be assumed to be 11000 W/(m2 K) based on [17], λ is thermal conductivity, and the value is 183.49 (W mK−1) for aluminum alloy. Finally Bi ≈ 0.045 < 0.1, indicating that there is no temperature gradient for the blank along the thickness direction. Therefore, 'lumped parameter method' can be selected to calculate the IHTC value, which can be defined as [18]:

Where hw is the interface heat transfer coefficient, q is the heat flux density between the surface of the aluminum alloy sheet and H13 steel. Ta and Tb represent the surface temperature of the AA7075 and H13 steel, respectively. Ta can be obtained from the Time-Temperature curves (figure 2). Nevertheless, it is difficult to measure the surface temperature of H13 die directly. The heat flux density can be obtained by the temperature field of the die, thus the surface temperature of the die can be calculated, being expressed as:

Where Ca is the specific heat capacity of AA7075, ρa is the density of AA7075, S represents the contact area between the blank and die, and V is the volume of the blank. The value of all the thermal physical parameters related to AA7075 and H13 steel are listed in table 3.
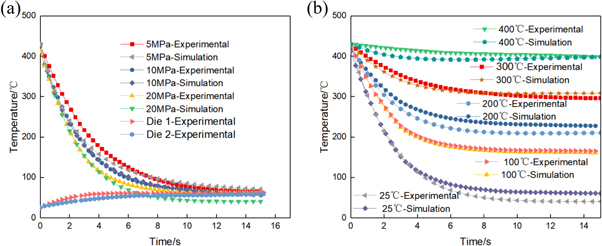
Figure 2. The comparison of temperature evolution between experimental and finite element simulation results under different conditions (contact pressure/die temperature): (a) 5–20 MPa/25 °C; (b) 20 MPa/25 °C–400 °C.
Download figure:
Standard image High-resolution imageTable 3. Thermal properties of AA7075 and H13 steel [19].
| AA7075/H13 | ||
|---|---|---|
| Temperature (°C) | Specific heat capacity C (J/(kg K)) | Thermal conductivity λ (W/(mK)) |
| 25 | 840/256.3 | 13/31.5 |
| 100 | 910/278.1 | 52/30.3 |
| 200 | 972/301.3 | 91/29.9 |
| 300 | 1018/320.5 | 121/29.5 |
| 400 | 1128/372.4 | 143/29.2 |
With regard to the lower die, the first order partial derivative of temperature to time is applied to the forward difference method, which can be expressed as:

Where T(x, t) represents the temperature in a distance of x mm to the surface of the lower die at t time. Δt represents the time increment.
The second order partial derivative method can be expressed as the central difference method:

Substituting equations (4) and (5) into the heat conduction equation of the lower die (equation (3)), and equation (6) was obtained as followed:

For simplicity, Ti−1, Ti and Ti+1 are replaced by Tb, T1 and T2. T1 and T2 are the temperature 1 mm and 2 mm from the lower die surface. The die surface temperature equation can be obtained as followed:

Then the equation for calculating IHTC value between AA7075 and H13 steel can be obtained through combining equations (2), (3) and (7):

Finally, the average IHTC value was described as:

Where hw is the IHTC value corresponding to any time, n is the number of collected samples.
3. Results
3.1. Temperature evolution and IHTC values during die quenching
Figure 2 shows the comparison of temperature evolution with time between the experimental and finite element simulation results under different conditions. It can be observed that the simulation agrees well with the experimental results. In the condition of 25 °C die temperature, the cooling rate of the blank increases with the increasing contacting pressure. The slope of the curve gradually decreases, which is attributed to the decreasing temperature difference. In addition to that, die-1 and die-2 represent the temperature at 1 mm and 2 mm below the lower die surface, respectively, and both of which increased to the peak value firstly, then decreased slightly to a steady value (figure 2(a)). As can be seen in figure 2(b), at a contact pressure of 20 MPa, as the die temperature increases, the cooling rate gradually decreases.
Figure 3 shows the simulation temperature distribution in the cross-section of the blank in three cases. It can be seen that, under all conditions, the temperature in the center of the blank is the highest, and the temperature gradually decreases from the center to the edge, showing a gradient distribution. Because a bit heat radiation and heat convection occurs between the blank and air during die quenching process besides the heat conduction, the closer to the edge, the larger the volume of the blank in contact with air, the more obvious the temperature difference is. However, the temperature difference between the center and the edge position is not large, and the ΔTmax was calculated for three cases. When the die quenching time is 1 s, 5 s and 15 s at a contact pressure of 5 MPa and 25 °C die temperature, the ΔTmax is 17 °C, 9 °C and 4 °C, respectively (figure 3(a)). The similar ΔTmax values were obtained under the other two conditions (figures 3(b) and (c)). Therefore, the temperature distribution in the radius direction can be considered as relatively uniform, indicating that the effect of heat radiation and heat convection is much weaker when compared with heat conduction during die quenching. Apart from that, the assumption of one-dimensional heat conduction model related to the calculation of IHTC value was also verified.
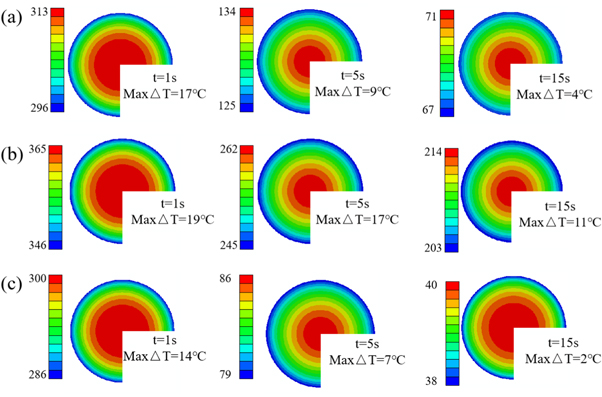
Figure 3. The simulation temperature distribution in the cross-section of the blank under different conditions (contact pressure/die temperature): (a) 5 MPa/25 °C; (b) 5 MPa/200 °C; (c) 20 MPa/25 °C.
Download figure:
Standard image High-resolution imageTable 4 summarized the calculated value of average IHTC for AA7075. It can be seen that the increasing contact pressure and the decreasing die temperature are both beneficial to the increment of IHTC value. The maximal IHTC was achieved under 20 MPa contact pressure and 25 °C die temperature, and the value is 3560 W·m2 k. In contrast, the minimum IHTC value with 1563 W·m2 k appears at 5 MPa contact pressure and 400 °C die temperature.
Table 4. The calculated value of average IHTC for AA7075.
| Contact pressure (MPa) | |||
|---|---|---|---|
| Die temperature (°C) | 5 MPa | 10 MPa | 20 MPa |
| 25 | 3112 W·m2 k | 3263 W·m2 k | 3560 W·m2 k |
| 100 | 2866 W·m2 k | 3034 W·m2 k | 3210 W·m2 k |
| 200 | 2468 W·m2 k | 2656 W·m2 k | 2890 W·m2 k |
| 300 | 1995 W·m2 k | 2112 W·m2 k | 2360 W·m2 k |
| 400 | 1563 W·m2 k | 1736 W·m2 k | 1863 W·m2 k |
3.2. Microstructure characterization
Figure 4 shows microstructures in specimens conditioned by different die temperature and contact pressure. It can be observed that a number of fine η' phases are uniformly distributed on the matrix at 5 MPa contact pressure. Apart from that, only a small amount of η phase can be discovered (figure 4(a)). With the increasing contact pressure (10 MPa and 20 MPa), the microstructure change is not obvious (figures 4(b) and (c)). The TEM morphologies of the specimens under 200 °C die and 10 MPa/20 MPa contact pressure are similar with those under 25 °C and 5–20 MPa conditions (figures 4(d) and (e)). Nevertheless, when the contact pressure decreases to 5 MPa, the fine η' phase is almost invisible, and replaced by a large number of large η phases (figure 4(f)). Figures 4(g)–(i) shows TEM images at a contact pressure of 20 MPa and a die temperature of 100 °C, 300 °C and 400 °C, respectively. Combining figures 4(c) and (f), it can be found that, a large amount of η appear when the die temperature reaches 300 °C under condition of 20 MPa (figure 4(h)), and this phenomenon developed further under 400 °C die temperature (figure 4(i)).
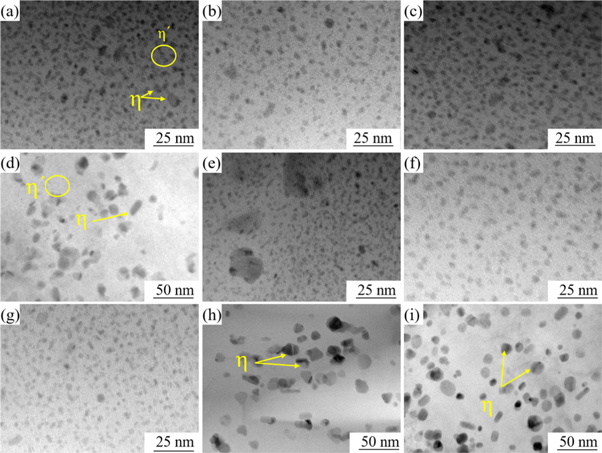
Figure 4. Microstructures in specimens conditioned by different die temperature and contact pressure: (a) 25 °C + 5 MPa; (b) 25 °C + 10 MPa; (c) 25 °C + 20 MPa; (d) 200 °C + 5 MPa; (e) 200 °C + 10 MPa; (f) 200 °C + 20 MPa; (g) 100 °C + 20 MPa; (h) 300 °C + 20 MPa; (i) 400 °C + 20 MPa.
Download figure:
Standard image High-resolution imageFigure 5 shows the differential scanning calorimetry (DSC) curves of AA7075 under different die temperatures at a contact pressure of 20 MPa. The peaks marked by yellow dash lines indicated the transformation from η' to η, and the area is proportional to the volume fraction of η [20]. Therefore, the area of exothermic peak enables to be utilized to make a qualitative analysis of the volume fraction of precipitates in all cases. It is thus evident that, the area of the samples under 300 °C/400 °C die are larger than those ranging from 25 °C–200 °C, indicating the appearance of more η precipitates under the former condition. Simultaneously, the temperature of exothermic peak moves left with the increasing die temperature, demonstrating the η precipitates are easier to form under a higher die temperature. The above DSC results are well consistent with TEM observation.
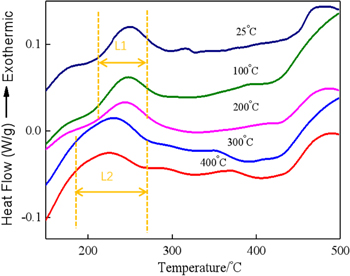
Figure 5. The DSC curves of AA7075 under different die temperature at 20 MPa contact pressure.
Download figure:
Standard image High-resolution image3.3. Mechanical properties
Figure 6 shows the mechanical properties in specimens conditioned by different die temperature and contact pressure. It can be seen from figure 6(a) that, the ultimate tensile strength (UTS) and yield strength (YS) decreased with the increasing die temperature under 5 MPa contact pressure, and the significant reduction in strength occurs when the die temperature is 200 °C. Apart from that, the total elongation (TE) increased slightly. With regard to 10 MPa and 20 MPa conditions (figures 6(b) and (c)), the trends related to the strength with the increasing die temperature keep the same as the case of 5 MPa contact pressure. With the increasing contact pressure at the same die temperature, the UTS and YS of the specimens increase. The evident difference is the significant decrease in strength at 300 °C die temperature.

Figure 6. Mechanical properties in specimens conditioned by different die temperature and contact pressure: (a) 5 MPa; (b) 10 MPa; (c) 20 MPa.
Download figure:
Standard image High-resolution image4. Discussion
4.1. The effect of forming conditions on interfacial heat transfer efficiency
Heat conduction is the main heat transfer mechanism during die quenching, and in this process, contact pressure play an important role on interfacial heat transfer efficiency. As shown in the previous Time-Temperature curves (figure 2(a)), the cooling rate increases with the increasing contact pressure, which is due to the increased IHTC value, which is related to the increasing contact area between the blank and die. Figure 7 shows the contact schematic diagram of the blank and the die surface. When the blank is in contact with the die, micro-convexes on the both surfaces will collide each other. Because the hardness of the 7000 series aluminum alloy is much softer than that of H13 die steel [13], the micro-convexes of AA7075 can be crashed by those of H13 die steel, inducing a reduction of the micro-convexes height. Then the micro-convexes of the H13 die steel embed into those of AA7075. It can be inferred that, with the increasing contact pressure, the depth of H13 micro-convexes inserting into those of AA7075 gradually increases, leading to an increased real contact area, finally resulting in an increased IHTC value. When warm dies were applied, the IHTC value decreased from 3112 W·m2 k to 1563 W·m2 k with the increasing die temperature ranging from 25 °C to 400 °C, as shown in table 4. This is because the blank temperature prepared for die quenching is 430 °C, the increasing die temperature leading to a decrease in interface temperature gradient, finally resulting the decrease of the cooling rate (figure 2(b)) and interfacial heat transfer efficiency.
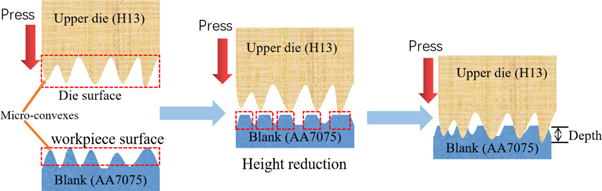
Figure 7. The contact schematic diagram of the blank and the die surface.
Download figure:
Standard image High-resolution image4.2. The relationship between interfacial heat transfer efficiency and microstructure and its effect on mechanical properties
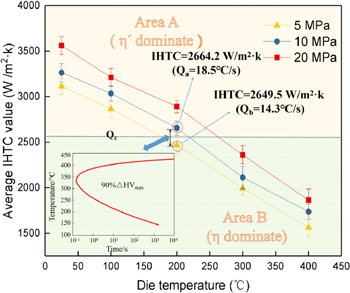
In order to have a deep understanding of the correlation between interficial heat transfer efficiency and microstructures, a schematics (figure 8) was constructed based on the previous experimental results, where TTP curves of AA7075 in T6 temper was also included by using the data in [9]. The TTP curves demonstrated the sensitive temperature range of AA7075 is 185 °C–415 °C, in which the phase transformation occurs more easily. Because when the holding temperature is higher than 415 °C, the driving force became small due to the low supersaturation, inducing the reduced nucleation rate of precipitates, resulting in a low rate of phase transformation. In the case of lower than 185 °C, the similar result was obtained due to the low solute diffusion rate. Only in the temperature range of 185 °C–415 °C, the solute diffusion rate and the supersaturation can satisfy the rapid transformation conditions of the precipitated phase.
Figure 8. The schematics of the correlation between interficial heat transfer efficiency and microstructure (The TTP diagram of 7075 is plotted using the data in [9]).
Download figure:
Standard image High-resolution image
Therefore in the present study, microstructure is strongly affected by interfacial heat transfer efficiency in the sensitive temperature range. Table 5 summarized the average cooling rate under all conditions in this range. Cooling rate is proportional to the interfacial heat transfer efficiency. QC in figure 8 is defined as the critical quenching rate, inducing the massive phase transformation. Qa and Qb represent the quenching rate under 10 MPa/200 °C and 5 MPa/200 °C conditions, respectively, as marked by the dash line circles. Combined the evolution of microstructure with IHTC value for analysis, it can be inferred that, the value of QC is between 14.3 °C s−1 (Qa) and 18.5 °C s−1 (Qb), and η' and η dominate area A (Q > QC) and B (Q < QC) respectively. The reason is that, when the quenching rate is less than QC, the solid solution decomposes and the equilibrium phase η would precipitate in grains. The formation of large number of η enables to cause the loss of solute atoms, such as Mg and Zn atoms, finally resulting in a low volume fraction of η'.
Table 5. The average cooling rate under all conditions in the sensitive temperature range.
| Contact pressure (MPa) | |||
|---|---|---|---|
| Die temperature (°C) | 5 | 10 | 20 |
| 25 | 59.4 °C s−1 | 76.6 °C s−1 | 93.1 °C s−1 |
| 100 | 28.1 °C s−1 | 32.5 °C s−1 | 47.9 °C s−1 |
| 200 | 14.3 °C s−1 | 18.5 °C s−1 | 22.4 °C s−1 |
| 300 | 5.2 °C s−1 | 6.4 °C s−1 | 7.9 °C s−1 |
| 400 | 0.8 °C s−1 | 1.2 °C s−1 | 1.4 °C s−1 |
η' is the main strengthening phase for AA7075, and η nearly has no strengthening effect [21, 22]. The strengthening model of the precipitation can be described as [23]:

where b denotes the Burgers vector, and the value of which is 2.84 Å, G denotes the shear modulus (27 GPa for aluminum); f denotes the volume fraction of η', r denotes the size of η'. Based the equation (10), it can be speculated that, larger f and smaller r are beneficial for the improvement of the strength. As evidenced in TEM observation (figure 4) and mechanical properties (figure 6), the specimens with high fraction volume of η' induced by high interfacial heat transfer efficiency exhibited higher strength than those with low fraction volume of η'.
5. Conclusion
In this research, the influence of contact pressure and die temperature on IHTC were investigated in some detail during HFQ® process for AA7075. In addition, the relationship among IHTC, microstructure and mechanical properties were also discussed. The following conclusions are drawn:
- 1.The IHTC value of AA7075 increased with the increasing contact pressure during HFQ® process. In contrast, the increasing temperature of forming die has a negative impact for the increase of IHTC. The maximal value of IHTC appears at a forming condition of die temperature of 25 °C and contact pressure of 20 MPa. Beside, the FE simulation are in good agreement with the experimental results.
- 2.During die quenching, the cooling rate decreases with the decreased IHTC value. The critical quenching rate, inducing the formation of a large number of equilibrium phases η is between 14.3 °C s−1–18.5 °C s−1, and the corresponding range of IHTC value is from 2468 W·m2 k to 2656 W·m2 k.
- 3.Low quench promotes the transformation of η' to η, and the formation of high volume fraction of η can be recognized as the reason for the reduction of strength for AA7075 during die quenching.
Acknowledgments
None
Data availability statement
All data that support the findings of this study are included within the article (and any supplementary files).
Declaration of competing interest
I declared that the work described in this manuscript is original research and it has not been published previously. There is no conflict of interest in the submission of the manuscript, and all the authors have approved the publication of this manuscript. HFQ® is a registered trademark of Impression Technologies Limited. Impression Technologies Limited is the sole licensee for the commercialization of the HFQ® technology from Imperial College London.