
Abstract
The virtual crystal approximation (VCA) method based on the Cambridge Sequential Total Energy Package (CASTEP) was used to establish the TiVNbMo refractory high-entropy alloy structure model. The effects of different Ti contents on the elastic and thermodynamic properties of TixVNbMo (x = 1.00, 1.25, 1.50, 2.00) high entropy alloys were calculated. The lattice constants calculation results of TiVNbMo with equal atomic ratio match well with the experimental values of vacuum arc melting, indicating that the VCA method is suitable for the first-principles calculation of TixVNbMo random solid solution. The EOS equation of state is used to determine the energy and volume of the equilibrium structure of the alloy. The elastic constants of TixVNbMo (x = 1.00, 1.25, 1.50, 2.00) high entropy alloys are calculated based on the body-centered cubic structure, and their Young's modulus anisotropic three-dimensional contour stereograms are drawn. Moreover, the quasi-harmonic Debyeg-Grüneisen model is used to calculate the thermodynamic properties, such as thermal capacity, isothermal body modulus, volumetric thermal expansion coefficient, and Grüneisen parameter with Ti content and temperature.
Export citation and abstract BibTeX RIS

Original content from this work may be used under the terms of the Creative Commons Attribution 4.0 licence. Any further distribution of this work must maintain attribution to the author(s) and the title of the work, journal citation and DOI.
1. Introduction
Refractory high entropy alloy (RHEA) [1–7] is one of the essential branches of HEA [8], which was first reported by Senkov in 2010 [1]. The body-centered cubic structure HEA is composed of more than three main refractory elements (including Ti, Zr, Hf, V, Nb, Ta, Cr, Mo, and W) at almost equal concentrations, and different atoms randomly occupy the sites of BCC lattice [5]. Sometimes non-refractory elements such as Al, Si, or Ni are added to meet aerospace applications [9, 10].
For example, TiVNbMo has a single BCC solid solution phase and with a typical dendritic structure. Its lattice constant a = 0.3211 nm, the yield strength σy is up to 1200 MPa, the tensile strain at room temperature can reach 25.62%, and the hardness of TiVNbMo at room temperature is about 440.7 Hv [11]. These parameters indicate that TiVNbMo refractory high entropy alloy is a high entropy alloy with good ductility and high strength. Besides, first-principles calculations also show that TiVNbMo high entropy alloy has good ductility [12].
First-principles calculation is a popular theoretical research method in the field of materials research. The components in the HEA are randomly distributed in the structure, which leads to severe lattice distortion. These factors make modeling and computing elastic properties of the HEA difficult and expensive. At present, there is no uniform opinion on the establishment of high-entropy alloy models. Researchers are still in the exploratory stage. There are four common methods for establishing random models of high-entropy alloys: coherent potential approximation (CPA) [13], virtual crystal approximation (VCA) [14], special quasi-random structure (SQS) [15] and similar local atomic environment ( SLAE). Nevertheless, in the Exact Muffin-Tin Orbitals combined with the CPA (EMTO-CPA) method [16], the finite deformation of the closed structure is available [17, 18]. SQS and SLAE require the construction of the supercell. The symmetry of the supercell is often broken to satisfy the correlation of different elements, which requires many calculations. On the other hand, although VCA is considered an oversimplified method to replace solid solution, many examples show that VCA can be reliably used to study high-entropy alloys composed of refractory elements [19–22]. Therefore, it is reasonable to explore the mechanical properties and thermodynamic stability of refractory HEA through the VCA method. It is reported that there is no literature report using ab initio method to study the effect of different Ti content on the mechanical properties and thermodynamic stability of TiVNbMo refractory HEA.
Therefore, in this work, based on DFT and plane wave pseudopotentials, the structure, elasticity, and thermodynamic properties of TixVNbMo (x = 1.00, 1.25, 1.50, 2.00) RHEA with different Ti content were systematically studied through VCA. First of all, the accuracy of the calculation results is verified by comparing the calculation results when the equal atomic ratio, that is, x = 1.00, with the known experimental results (table 2). Then the elastic and thermodynamic properties of TixVNbMo (x = 1.00, 1.25, 1.50, 2.00) are studied through the VCA model, equation of state (EOS), and quasi-harmonic Debye-Grüneisen model. For the convenience of data recording, these five alloys will be marked as Ti1.00, Ti1.25, Ti1.50, Ti1.75, and Ti2.00.
2. Alloy composition design and calculation method
2.1. Composition design of TixVNbM RHEA
Due to the high mixing entropy, high entropy alloys usually form simple disordered solid solutions, such as BCC, FCC, and HCP. In order to predict the phase structure of HEAs, it is necessary to focus on thermodynamic parameters such as mixing entropy ΔSmix, mixing enthalpy ΔHmix, atomic size difference δ, electronegativity difference Δχ and valence electron concentration (VEC), and they all follow the classical Hume Rothery rule [20]. Their values can be calculated by a series of equation (1)
Where ΔSmix is the mixing entropy of the HEA, ci
is the atomic ratio of the i-th alloy component, and R is the molar gas constant. ΔHmix is the mixing enthalpy of the HEA,  is the enthalpy of mixing of binary liquid alloys, ci
and cj
are the atomic ratios of the i-th and j-th alloy components, respectively. δ is the atomic radius difference of the HEA, ri
is the atomic radius of the i-th alloy component,
is the enthalpy of mixing of binary liquid alloys, ci
and cj
are the atomic ratios of the i-th and j-th alloy components, respectively. δ is the atomic radius difference of the HEA, ri
is the atomic radius of the i-th alloy component,  is the average atomic radius.
  is the electronegativity difference of the HEA,
  is the average electronegativity difference of the constituent elements calculated by the mixing rule,
  is the Pauling electronegativity of the i-th element; VEC is the valence electron concentration of HEA,
  is the valence electron concentration of the i-th element. At the same time, some extended Hume-Rothery rule parameters will also affect the phase formation results of HEA, such as: Ω, Λ and γ [20], calculated according to equation (2)
Where  is the melting temperature of the i-th element, and Ω takes into account both effect of the entropy and the enthalpy. γ describes the instability of atomic packing and is defined as the ratio of the smallest and largest solid angles,
  is the solid angle of the smallest atom,
  is the solid angle of the largest atom, and
  and
and  are the radii of the smallest and largest atoms. When Ω ≥ 1.1, δ ≤ 6.6%, and γ < 1.175, The parameter values listed in table 1 fully meet the limitation of obtaining a single solid solution structure [23]. TiVNbMo as a potential aerospace application material, low density is a significant advantage, the theoretical alloy density ρtheor determined by equation (2) [1]

Where  and
and  are the atomic weight and density of element i.
Table 1. The thermodynamic parameters and ρtheor values of TixVNbMo (x = 1.00, 1.25, 1.75, 2.00) RHEA.
| HEAs | ΔSmix | ΔHmix | δ | Δχ | VEC | Tm | Ω | γ | ρtheor |
|---|---|---|---|---|---|---|---|---|---|
| Ti1.00 | 11.524 | −2.750 | 4.076 | 0.249 | 5.00 | 2442.5 | 10.235 | 1.120 | 4.28 |
| Ti1.25 | 11.482 | −2.657 | 4.113 | 0.216 | 4.94 | 2413.0 | 10.426 | 1.120 | 4.15 |
| Ti1.50 | 11.383 | −2.568 | 4.128 | 0.242 | 4.89 | 2386.8 | 10.580 | 1.120 | 4.04 |
| Ti1.75 | 11.241 | −2.482 | 4.127 | 0.239 | 4.84 | 2363.3 | 10.704 | 1.119 | 3.94 |
| Ti2.00 | 11.075 | −2.400 | 4.115 | 0.236 | 4.80 | 2342.2 | 10.808 | 1.119 | 3.85 |
2.2. Calculation details
In this work, the energy and elasticity of TixVNbMo (x = 1.00, 1.25, 1.75, 2.00) RHEAs are calculated by the VCA model. All the first-principles calculations are based on the Cambridge sequential total energy package (CASTEP) [24]. Exchange-Correlation functional was selected the Perdew–Burke–Ernzerhof (PBE) in generalized gradient approximation (GGA), choose the TPSD algorithm when geometrically optimizing the structure, pseudopotential selects OTFG norm serving, custom cutoff energy was set to 950 eV, and a k-points was setting to 20 × 20 × 20. In this MonkhorstPack scheme, the Brillouin zone is sampled to ensure that the total energy error is less than 1 × 10⁻⁵ eV atom−1. Besides, in the subsequent geometric optimization, all the forces on a single atom converged to less than 0.03 eV Å−1, and the total stress tensor was reduced to the order of 0.05 GPa, max placement of an atom is less than 0.001 Å.
2.2.1. Lattice constant
A more efficient TPSD structure optimization method is selected for lattice constant calculation, and the optimization results match well with Birch–Murnaghan equation of state (EOS) [25, 26]. The EOS method calculates the energy of crystals of different volumes (here the shape of the crystal lattice is retained as the initial structure, namely BCC), and then fits the E-V curve through the third-order Birch-Murnaghan equation (4) of the EOS method, as shown in figure 1. The volume with the minimum energy corresponds to the equilibrium volume. The initial VCA-BCC crystal structure is based on the original structure of Nb, and its lattice parameters a = 3.3006 Å
Where V0 and E0 are the equilibrium volume and the corresponding energy, respectively. V is the volume of change, B0 is the bulk modulus, and  is a constant. The deviation between the EOS fitting value of lattice constant and that of the vacuum arc melting experiment is only 0.13%–0.91%, their values are listed in table 2, which indicates that the parameter setting of the calculation method is reasonable.

Figure 1. The relationship between energy and volume of TixVNbMo refractory high-entropy alloy.
Download figure:
Standard image High-resolution image2.2.2. Elastic constant
For cubic crystals, there are three independent elastic constants: C11, C12, and C44, which should meet the requirements of Born-Huang mechanical stability criterion [28], as shown in equation (5)

When the Cauchy pressure Cp is greater than 0, it indicates that the alloy is completely metal bond, which is defined as equation (6) [28]

The calculation method of modulus for cubic crystal is shown in equation (7) [16]

According to the Voigt-Reuss-Hill modulus principle [16], the calculation equations for the modulus B, G, E and Poisson's ratio σ of cubic crystals can be obtained (8)

The general anisotropy index AU is calculated by equation (9) [29]

The hardness value of the alloy is calculated according to the equation (10) proposed by Chen [30]

2.2.3. Thermodynamic properties
Thermodynamic properties are very important, and they play an important role in understanding the thermal response of solids. In order to study the thermodynamic properties of TixVNbMo refractory high-entropy alloys, the quasi-harmonic Debye model using the Gibbs1.0 program is applied here [31]. This tool can be used to calculate the thermodynamic properties of the phases in the alloy, such as pressure-volume-temperature relationship, isothermal volume Modulus, volume thermal expansion coefficient, heat capacity, entropy, and Debye temperature. Since the detailed introduction of this method and its application has been described in other literature reports [32, 33], we only briefly summarize the method here. The unbalanced Gibbs function G*(V; P, T) has the form

Where E(V) is the total energy of each unit cell of TixVNbMo at 0 K, which can be calculated by EOS, PV corresponds to a constant hydrostatic pressure condition, Avib is the Helmholtz free energy of vibration, and Θ is Debye temperature. Using the complete phonon density of states (PDOS) requires many calculations. The GIBBS method uses the Debye model and considers the quasi-harmonic approximation. The Avib Helmholtz free energy is expressed as Debye temperature

Where D(Θ/T ) is the Debye integral, defined as equation (13), n is the sum of the number of atoms in the chemical formula, and Θ is the Debye temperature, defined as equation (14).


Where M is the molecular weight of each molecular formula, Bs is the adiabatic bulk modulus, which can be approximated as equation (15), σ is the Poisson's ratio calculated by the elastic constant, f(σ) is given by equation (16)

When the Gibbs free energy is determined, other thermodynamic properties can be calculated. For example, vibration internal energy Uv equation (17), heat capacity Cv equation (18), thermal expansion is described by the Debye-Grüneisen model [26]. In this model, the volume expansion coefficient can be calculated by equation (19)


Where γ is the Grüneisen parameter, defined as equation (20), and BT is the bulk modulus at temperature T, which can be calculated using equation (21)


3. Results and discussion
3.1. Elastic constants of TixVNbMo
The elastic stiffness, polycrystalline elasticity, and hardness of TixVNbMo were calculated with the VCA model. The influence of Ti content on the lattice constant a and theoretical density ρtheor of the alloys are shown in figure 2. Because Ti has the largest atomic radius and the smallest density, the lattice constant a of TixVNbMo alloy gradually increases from 3.182 Å to 3.202 Å, and the theoretical density ρtheor gradually decreases from 4.28 g cm−3 to 3.85 g cm−3.

Figure 2. Effect of Ti content on the lattice constant a and theoretical density ρtheor of TixVNbMo RHEA.
Download figure:
Standard image High-resolution imageThe elastic constants determine the elastic properties of materials, which can directly reflect the mechanical properties of materials. Figures 3(a) and (b) show that with the change of Ti content, the elastic constant Cij of TixVNbMo alloy fully meets the Born-Huang mechanical stability criterion, and they are both stable BCC structure and all of them are metal bond binding (Cp > 0). The elastic properties of materials are mainly reflected by bulk modulus B, shear modulus G, Young's modulus E, and Poisson's ratio σ. The bulk modulus reflects the ability of the alloy to resist volume changes and is a manifestation of the average bonding strength between atoms in the material. The shear modulus expresses the ability of the material to resist shear deformation. Young's modulus reflects the ability of the alloy to resist elastic deformation and is a manifestation of alloy rigidity. Poisson's ratio σ is a physical quantity used to quantify the stability of crystal materials against shear deformation. Higher Poisson's ratio σ, better plasticity. B/G the ratio of shear modulus to bulk modulus can also reflect the brittleness and toughness of metal materials. The higher the ratio, the better the toughness of metal [28]. Figure 3(c) is the first-principle calculation result of the elastic properties of TixVNbMo RHEA. With the increase of Ti content, B, G, and E all gradually decrease. That is, as the Ti content increases, the average bonding ability between alloy atoms and the ability to resist deformation simultaneously become weaker, the rigidity of the material decreases, and the material are more inclined to deform elastically. Figure 3(d) shows the effect of Ti content on Poisson's ratio σ and B/G. They all increase gradually with the increase of Ti content, indicating that the plasticity and toughness of TixVNbMo RHEAs are positively correlated with the Ti content, and this trend is more significant when x ≥ 1.50.

Figure 3. The elastic constants of TixVNbMo RHEA. (a) C11, C12, C44; (b) C11 − C12, C11 + 2C12, and Cp; (c) bulk modulus B, shear modulus G, and young's modulus E; (d) Poisson ratio σ, and Shear modulus and bulk modulus ratio B/G.
Download figure:
Standard image High-resolution imageFigure 4 is a dotted line graph of the predicted values of the general anisotropy index and the hardness of TixVNbMo RHEA with different Ti content calculated from equations (9) and (10). The smaller the value of AU, the closer to 0, the more isotropy of the alloy. When AU is equal to zero, the alloy is isotropic. It can be seen from figure 4 that as the Ti content increases, the alloy gradually tends to be isotropic, and the hardness value gradually decreases.
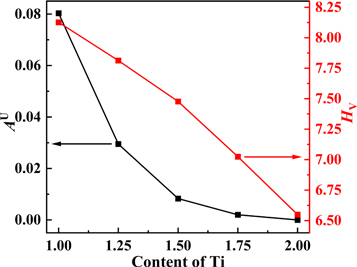
Figure 4. Effect of Ti content on the general anisotropy index AU and hardness HV of TixVNbMo RHEA.
Download figure:
Standard image High-resolution imageIn this work, in order to observe the mechanical anisotropy of the material more clearly, figure 5 shows the three-dimensional (3D) surface of Young's modulus of TixVNbMo RHEA BCC phases with different Ti content in spherical coordinates. The calculation process is consistent with that of [34]. For cubic structures, the 3D representation of Young's modulus is given by equation (22) [35]. As shown in figures 5(a)–(e), with the Ti content increases, Young's modulus of TixVNbMo RHEA gradually tends to form a completely spherical shape, indicating that they gradually tend to be isotropic. Projection of Young's modulus of TixVNbMo alloy on crystal plane (001) and crystal plane (110) are shown in figures 6(a) and (b), respectively. The Young's modulus anisotropy of the (001) crystal plane is weaker than that of the (110) plane. When x = 1.00, that is, TiVNbMo alloy has the strongest Young's modulus anisotropy, because its shape deviates from a perfect sphere.
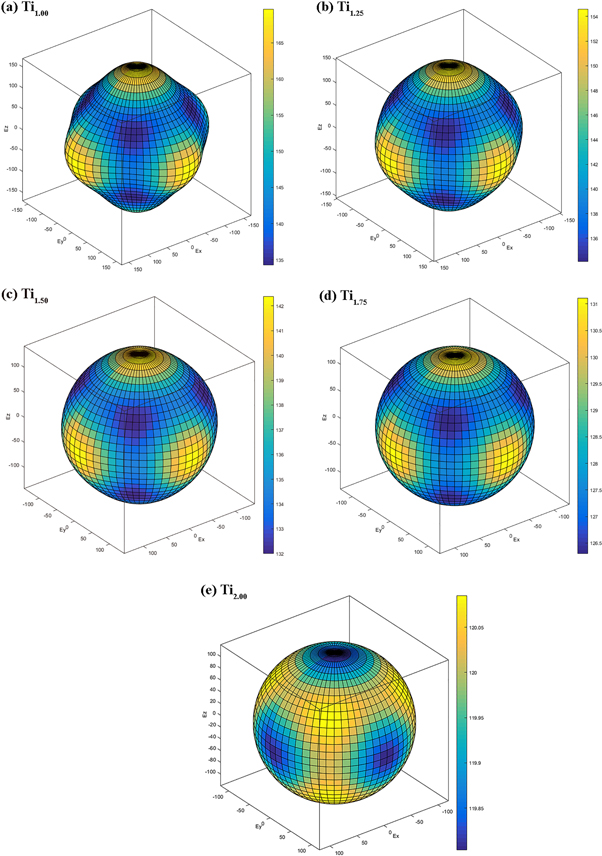
Figure 5. (a) ∼ (e) 3D contour plots of TixVNbMo RHEA Young's modulus anisotropy with different Ti content.
Download figure:
Standard image High-resolution image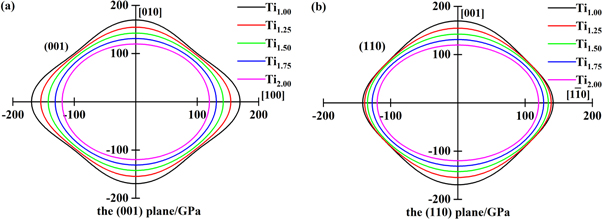
Figure 6. Planar projections of Young's modulus of the TixVNbMo RHEA on (001) plane (a) and (110) plane (b).
Download figure:
Standard image High-resolution image3.2. Thermodynamic properties of TixVNbMo
In the previous calculation, the total energy and equilibrium volume of the system in the 0 K state conforms to the EOS equation of state. Taking the E–V data in figure 1 as the input data of the Gibbs1.0 program, the heat capacity Cv, the volume thermal expansion coefficient αv, the isothermal body modulus BT and the Grüneisen parameter γ of the TixVNbMo alloy are calculated. The curve of constant heat capacity Cv with the temperature of the TixVNbMo alloy is drawn as figure 7. The results show that the heat capacity Cv value strongly depends on the temperature at low temperatures, which is due to the limitation of the Debye model at low temperatures. However, at a higher temperature, the Cv value is gradually close to the Dulong-Petit limit [33] and increases gradually with the increase of Ti content.

Figure 7. Effect of Ti content on the heat capacity Cv of TixVNbMo RHEA.
Download figure:
Standard image High-resolution imageThe thermal expansion coefficient is a key parameter to characterize the thermodynamic and thermoelastic deformation behavior of alloys at high temperatures [36]. Applying the quasi-harmonic Debye model to calculate the thermal expansion rate is a feasible strategy, which has been verified in many papers [19, 31, 33, 37, 38]. Figure 8 shows the predicted value curve of the volumetric thermal expansion coefficient αv of TixVNbMo alloy with temperature. It can be seen from figure 8 that at low T, the volume thermal expansion coefficient αv increases with the increase of T3, and gradually increases rapidly with the increase of T, and then the increasing trend gradually becomes flat, and with the Ti content, this trend is more obvious.

Figure 8. Effect of Ti content on the volume thermal expansion coefficient αv of TixVNbMo RHEA.
Download figure:
Standard image High-resolution imageNot only the thermal expansion coefficient but also bulk modulus is a very important parameter to understand the thermal properties of solid materials at high temperature [39]. Figure 9 shows the predicted value of the isothermal body modulus BT of TixVNbMo RHEA with different Ti content between 0 ∼ 1150 K calculated by the Quasi-Harmonic Debye model. It can be easily seen from figure 9 that the isothermal modulus BT gradually decreases with increasing temperature and Ti content, and the bulk modulus value at 0 K is equivalent to the value obtained from the previous DFT elastic constant calculation.
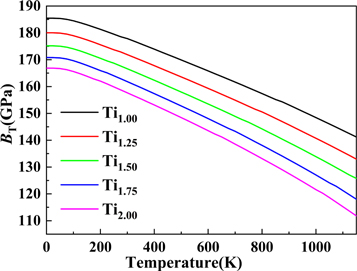
Figure 9. Effect of Ti content on the predicted isothermal bulk modulus BT of TixVNbMo RHEA.
Download figure:
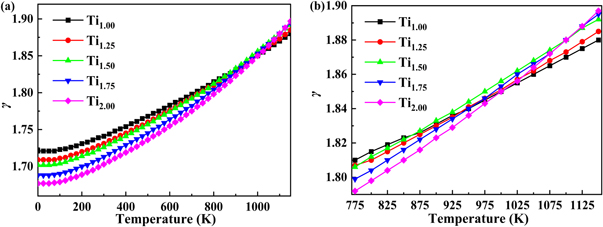
Standard image High-resolution imageFigure 10 shows the curve of the Grüneisen parameter γ with Ti content and temperature. The parameter γ increases gradually with the increase of temperature. At the same time, it can be seen from figure 10(a) that in the lower temperature stage, the Grüneisen parameter γ is negatively correlated with the increase of Ti content. However, this trend gradually changes after the temperature reaches 775 K; this negative correlation gradually changes to positive correlation, as shown in figure 10(b).
Figure 10. Contents of Ti and temperature dependences of the Grüneisen parameter γ of TixVNbMo RHEA.
Download figure:
Standard image High-resolution image
4. Conclusion
Based on the CASTEP computing platform, the crystal structure is approximated by VCA, combined with the EOS equilibrium equation of state and the quasi-harmonic Deby-Grüneisen model, the phase structure, elastic constants and thermodynamic properties of TixVNbMo RHEA are systematically studied. Through comparison with other experiments, it is confirmed that VCA modeling is suitable for the calculation of lattice constants, elastic properties, and thermodynamic properties of TixVNbMo RHEA.
The calculation results show that the TixVNbMo RHEAs has a stable metal bond bonding BCC structure. With the increase of Ti content, the B, G, and E of TixVNbMo RHEA gradually decrease, indicating that the average bonding capacity and deformation resistance between atoms become weaker at the same time, and the alloy is more prone to elastic deformation. The values of Poisson's ratio σ and B/G ratio gradually increase with the increase of Ti content, which means that the plasticity and toughness of the material gradually increase, and when x ≥ 1.50, this trend becomes more and more significant. The Young's modulus of TixVNbMo RHEA is the most anisotropic when x = 1.00. With the increase of Ti content, the alloy tends to be isotropic more and more, and the hardness Hv decreases gradually.
The calculation of the Gibbs1.0 program proves that the heat capacity Cv of TixVNbMo RHEAs is positively correlated with the increase of Ti content, and the isothermal bulk modulus BT and volume thermal expansion coefficient αv at different temperatures are negatively correlated with the increase of Ti content. When the temperature is higher than 775 K, the Grüneisen parameter γ and Ti content of TixVNbMo RHEA gradually change from a negative correlation to a positive correlation. In summary, the work in this paper provides good guidance for the design of refractory alloys for BCC structures.
Acknowledgments
This work was supported by the National Natural Science Foundation of China (grant numbers 11674134, 61963021), the Applied Basic Research Key Project of Yunnan (grant numbers 2016FA020), and the project of Reserve Talent of Youthful and Middle-aged Academic Leaders in Yunnan Province (grant numbers 2014HB007). At the same time, we must be grateful to Prof. Jing Feng, Dr Yunxuan Zhou, and Dr Guangchi Wang of Kunming University of Science and Technology for their help in the first-principles calculation process.