
Abstract
Studies on nitrocellulose (NC) mixtures with little solubilities were neglected in many cases previously. This investigation was performed to provide supplemental characterizations of NC and its soaked state with pure liquid ethanol or diethyl ether by simulations and practical methods. Above all, a short-chained NC model (polymerisation degree: 8) and a dried NC specimen were characterized for their substitution of nitrate and microstructure. It was confirmed that both the numerical model and practical specimen belonged to low-nitrated NC. The bonding information of a glycosyl unit and nitrate ester were summarized via first-principle calculations. Then, ReaxFF potential based Molecular Dynamic (MD) simulations and soaking tests on binary organic mixtures demonstrated that both ethanol and diethyl ether had limited solubility for our specified NC. However, potential energies and diffusion coefficients of both computational models showed that the interactions from ethanol molecules were relatively stronger than diethyl ether molecules. The viscosities of saturated NC solutions also proved this consequence, as the difference between pure ether and its filtered NC solution was only 0.02 mm2 s−1. Finally, the strong volatility of diethyl ether itself could keep the wetness of NC upper surface shortly, because this was an upward volatilization effect. Due to this effect, the penetration of NC-diethyl ether mixture was higher in the early period of penetration tests.
Export citation and abstract BibTeX RIS

Original content from this work may be used under the terms of the Creative Commons Attribution 4.0 licence. Any further distribution of this work must maintain attribution to the author(s) and the title of the work, journal citation and DOI.
1. Introduction
Cellulose, a typical polymer material, is expected to be a typical raw material for rubber [1], fuel cells [2] and bio-detection [3]. Nitrocellulose (NC), also named as cellulose nitrate, is produced from esterification of cellulose with nitrate [4, 5]. Therefore, NC has a similar microstructure with cellulose, including D-glucopyranose and glucosidic bonds. There are three potential substitution sites on the NC, so the maximum substitution degree of NC is 3. The nitrogen (N) content of NC is a critical parameter for its application because this is correlated with the solubility, viscosity and thermal stability. The stability of NC will be highly declined, when the N content of which exceeds 12.5% [6]. On this occasion, NC is prone to combust spontaneously with vast heat release [5, 7, 8]. So highly-nitrated NC is a primary energetic carrier conventionally used for propellants and explosives [8–10]. For example, the NC with 11.9% of nitrogenous content was recently reported to be fabricated with boron (B) and iron (Fe) particles for ammonium perchlorate propellant applications [11]. While, the low-nitrated NC is an essential industrial ingredient widely used in coatings, spray paint or artificial leather [5, 12].
Because the thermal decomposition temperature of the nitrate group is quite low, NC could not be melted and reprocessed directly according to practical demands [6]. Especially, the thermal decomposition of NC is along with the autocatalytic effect [13]. However, NC can be easily dissolved in some organic solvents, such as the preparation of NC lacquer thinner [14]. The properties of NC in organic solution will directly affect the modelling process and the performance of NC after treatment, so it is of considerable significance to study chemical and physical properties of NC when it is mixed with organic solutions.
Previously, J Liu et al investigated the combustion efficiency and products of NC–isopropanol or ethanol mixtures by ISO5660 cone calorimeter under different external irradiance levels [15]. Their work revealed that combustion residuals of two NC–alcohol mixtures appeared to be similar, but the atomic concentrations were slightly different. R C Wei et al tested the burning properties of NC with the addition of humectant through the ISO 5660 cone calorimeter test [16]. Their study showed that the maximum mass loss rate and the average mass loss rate decreased with the addition of ethanol, and the maximum exothermic rate of the specimen was mainly determined by the NC component. S Shukla et al conducted the spectrum of organic solvent-based NC lacquer coated surface [17]. They proposed that the main peaks reported for NC were around 1660, 1280 and 840 cm−1. X Zhang et al examined the influence of different solvents, including tetrahydrofuran, methanol, ethanol and dimethylformamide, for the preparation of NC based materials [18]. Those results proved the application of methanol and ethanol on producing continuous films through evaporation treatments. L Moity et al experimentally characterized the solubility of NC in 15 glycerol-derived solvents by their Hansen solubility parameters. The efficiency and safety of diacetin solvent were validated in their study [19]. H Javidnia et al introduced a mixture solvent, butyl glycol acetate/ethyl acetate, to dissolve the NC and reported its colloid stability and micro-filterability. It is said that the oil phase viscosity was brought up by higher butyl glycol acetate content [20].
In industry, a typical solvent for NC is the mixture of liquid ethanol and diethyl ether. Ethanol and diethyl ether, as two common organic solvents, have also been widely studied. H Li et al studied the solubilities of pimelic acid in ether, tetrahydrofuran (THF), ethanol, and methanol by several appropriate testing methods [21]. Their work reported the rank order of four solvents (THF > methanol > ethanol > ether) according to their solubilities with pimelic acid. Y Bao et al experimentally investigated the solubilities of 5-nitrofurazone in the ethanol-water mixtures [22]. Their results stated that 5-Nitrofurazone was preferentially solvated by ethanol in intermediate compositions.
Currently, traditional experimental methods have shown their limitation on studying polymer mixtures under microscopic conditions, especially for the transition process. The development of computer-aided techniques, such as Molecular Dynamic (MD) simulations, allows us to observe those details at the atomic scale. Through this method, Fujiwara et al studied the configuration of an individual macromolecular chain in vacuum and solution environments [23]. K L Tung et al studied the effect of solvents on dynamic properties of atactic poly-methyl methacrylate chains in solution by MD simulations [24]. A Saltzman et al presented a molecular simulation study of argon in ethanol/water mixture solvents [25]. Their simulations were in good agreement with available experimental results. From those three references above, we can directly observe the configuration of solution or individual molecules with their properties. This is also what we expected in this study.
In this study, we were not focused on the ethanol/ether mixture, but the individual composition. To characterize NC and its mixtures, we performed first-principle calculations, MD simulations, Fourier Transform Infrared Spectrometer (FTIR), Gel Permeation Chromatography (GPC), capillary viscosimeter, titration, penetration and volatilisation experiments. The goal of this study was to supplement some missing details and parameters of NC so that this critical material could be well recognized. The targeted detail was about the mixture of NC in ethanol or ether. These mixtures will be used in our newly reported propellant, but it is not easy to find relevant data or results in recent reports. We believe these mixtures deserve to be carefully studied.
2. Methods and materials
2.1. First-principle calculations
First-principle calculations in this study refer to the Quantum Mechanism-based Density Functional Theory (DFT) method. It was said that the DFT method has already been an influential researching approach for microstructure and phase interfaces [26]. Meanwhile, the catalytic properties of new matters could be predicted, as well [27]. Thanks to the developer team of CASTEP [28], our DFT calculations were performed by their package. In its computing code, the plane-wave pseudopotential method is applied to process Kohn–Sham equations with one-electron, and ab initio pseudopotentials define the electron-ion potential while under calculations [29]. Both norm-conserving and ultrasoft formulations are alternative in CASTEP [29]. As the pre-work for MD simulations, first-principle calculations in this study focused on the minimization of total energy, so that the bonding and atomic information of each model could be summarized. We drew the initial chemical structure of NC, ethanol and diethyl ether according to their molecular formula. Molecular formulas of ethanol (C2H5OH) and diethyl ether (C4H10O) have been well recognised, so we won't cover this again. Take the only macromolecule, NC, as an example. The polymerisation degree of NC chain was designed to be 8, and the degree of its substitution was 2. Therefore, there were 48 carbon (C) atoms, 66 hydrogen (H) atoms, 16 N atoms and 73 oxygen (O) atoms in this NC chain. Those three organic models were optimized under Generalized Gradient Approximations (GGA)-Perdew–Burke–Ernzerhof (PBE) style exchange-correlation effects. The cut-off energy of the plane wave basis was set as 350 eV [30], and the size of the standard grid was about 2.8. Next, a Monkhorst-Pack mesh of 4 × 4 × 4 k-points was applied for this DFT study. As for the convergence tolerance for geometry optimization, the acceptable ionic force ought to be less than 0.03 eV Å−1, while the standard for total energy was 0.2E-4 eV/atom. Finally, all models were placed at the centre of a 40 × 40 × 40 Å3 cubic cell.
2.2. MD simulations and computational models
If we need to take further requirements, like complexity and trajectory, into account, first-principle calculations would be incapable in this situation. Therefore, we performed Large-scale Atomic/Molecular Massively Parallel Simulator (LAMMPS) [31] based MD simulations to study the large organic mixture system. There were three molecular models with four types of elements in this study. To deal with the potential break or formation of chemical bonds, we selected the ReaxFF force field to describe atomic interactions. ReaxFF potential was first induced by professor Adri van Duin [32] to enable reactions in MD simulations, while in this study, the specified ReaxFF potential file was a combined potential, as those parameters were provided by two references. Firstly, parameters for C, H and O elements were reported by K Chenoweth et al [33]. Secondly, N and boron atoms were studied by M R Weismiller et al [34]. Both of those original potential files were developed according to quantum mechanical results. Based on those implementation data, the bond-order functions were solved to judge bonding effects and energies.
The computational model for MD simulations was initially provided by DFT calculations. Those stabilized organic molecules were packed into a specific area by PACKMOL [35] program. Due to the consideration of computing cost, we designed a medium-sized computational box about 40 × 40 × 40 Å3. At the same time, periodical boundaries were set on three dimensions. The box was vertically divided into two equal regions. The lower region was for 5 NC chains, while the other one was for the ethanol or diethyl ether system. According to their real densities, the total amount of diethyl ether molecules was 185, and the amount of ethanol was about 330. Because this is a comparative study, diethyl ether and ethanol systems were placed in two individual computational models. In the following sections, all snapshots of computational models were rendered by OVITO and VESTA programs [35, 36].
As the electronegativity equalisation method is implemented in ReaxFF potential to process charge distribution [37], the atomic style of both LAMMPS datafiles was defined as 'charge'. The creation and export of data files were accomplished by Visual Molecular Dynamics (VMD) [38]. In this part of the investigation, the Nose [39]/Hoover [40] algorithm was performed for temperature control, and entire systems were under isothermal–isobaric (NPT) ensemble. From beginning to the end, the temperature was fixed around room temperature (300 K), and the external pressure was about 1 atmosphere. The total integration term of each computational system ended at 1 ns, and each time step was about 0.5 fs.
2.3. Experimental methods
Despite those numerical simulations, we also performed experimental characterizations in this study. Above all, the physical properties of dried NC were characterized before mixing operations. The morphology of dried NC was presented via an optical microscope, and the functional groups of NC were tested by FTIR (Nicolet Avatar 370, Thermo Nicolet Corporation, USA). Both tests were operated in the Harbin Engineering University, China. Because NC is a typical polymer material, we measured its averaged molecular weights by GPC (Agilent 1100, Agilent Technologies Inc., USA, tested in Harbin University of Science and Technology, China) and capillary viscosimeter (purchased from Shanghai Baoshan Qihang Glass Instrument Factory, China) respectively. The conversion formula of viscosity averaged molecular weight will be discussed in section 3.3. The last characterization for NC itself was the titration of N at about 10 °C. The reaction mechanism for titration is presented as equations (1)–(3) below. In which, x represents the degree of substitution. We calculated the mass percentage of N in NC through the volume of consumed FeSO4 solution (0.5 mol l−1). The titration ended while the crimson complex: [Fe(NO)]SO4 appeared.


Next, the characterized NC specimen was soaked in liquid ethanol or diethyl ether, respectively. We mixed 0.1 g NC with 100 ml liquid ethanol or diethyl ether, then each mixture was stirred for 3 h at least. We tested the viscosity of the filtered solution and made comparisons with pure ethanol and diethyl ether. Finally, the mass of NC addition was increased to 19 g. The penetration and volatilisation of organic mixtures were recorded as a function of time. The producer of penetrometer was Beijing Zhongke Lanhang Test Instrument Co., Ltd, China, and the penetrating time was 15 s.
2.4. Experimental materials
In this study, some raw materials or reagents, such as dried NC, pure ethanol, diethyl ether, acetone, potassium bromide and concentrated sulfuric acid, were supplied by Harbin Engineering University, China. The solvent for capillary viscosimeter test was acetone, and the tablet for FTIR was the mixture of NC and potassium bromide. Additionally, solid FeSO4 powder was purchased from Sinopharm Chemical Reagent Co., Ltd, China.
3. Results and discussion
3.1. Geometry optimisation of NC chain
As mentioned before, our NC consisted of 8 identical glycosyl residues, and each glycosyl residue has three substitution sites. In this model, two of those three sites were connected with nitrate ester groups, therefore, its degree of substitution was 2. Conversion formulas between substitution degree (x), the mass percentage of N (M%) and nitrification degree (NO) are listed as equations (4)–(6) below [6]:


Consequently, the mass percentage of N of this model was about 11.1%, and the nitrification degree was 177.489 ml g−1. Figure 1 is the snapshot of the NC model after geometry optimisations. In which, all atoms were rendered by atomic types. Along the X-axis, the entire chain was presented as an arch structure with 114.54°. From one edge O atom to the other side, the NC chain was as long as 37.392 Å. Between each couple of glycosyl residues, there was a connecting ether group (R–O–R'). The angle of C–O–C bonds was around 116°(±1°). As our NC chain was a repetitive structure, it may be prolix to state all bonding information. Therefore, we only focus on middle glycosyl residue (figure 2). The studied glycosyl residue was about 7.87 Å high and 5.25 Å wide. Different from figures 1, 2 was rendered without lighting and perspective effects. Due to the limitation of VASTA, all types of bonds are presented as a single stick in figure 2. Bonding details of figure 2 are listed in table 1 below. It is shown that the bonding geometry of R–O–NO2 was not affected by its substitution site, because they had similar approximation values of bond length and angle. This consequence was also validated by other glycosyl residues in NC chain. Besides, the C–C bond length value of substitution sites was about 0.02–0.04 Å higher than other C–C bonds.

Figure 1. The configuration of NC after DFT optimization.
Download figure:
Standard image High-resolution image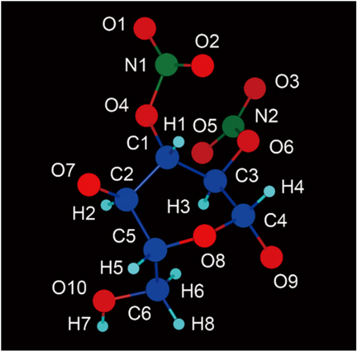
Figure 2. The configuration of a middle glycosyl residue.
Download figure:
Standard image High-resolution imageTable 1. Bonding information of the glycosyl residue corresponding to figure 2.
| Type | Bond length (Å) | Type | Bond angle (°) |
|---|---|---|---|
| O1-N1 | 1.232 14 | O1-N1-O2 | 131.29 |
| O2-N1 | 1.236 26 | O1-N1-O4 | 112.96 |
| N1-O4 | 1.485 01 | O2-N1-O4 | 115.74 |
| O4-C1 | 1.441 05 | N1-O4-C1 | 111.26 |
| C1-H1 | 1.098 16 | O4-C1-H1 | 108.32 |
| C1-C2 | 1.520 75 | O4-C1-C2 | 109.97 |
| C2-O7 | 1.446 55 | H1-C1-C2 | 109.41 |
| C2-H2 | 1.100 01 | C1-C2-O7 | 109.94 |
| C2-C5 | 1.540 94 | O7-C2-H2 | 109.34 |
| C5-H5 | 1.099 74 | C1-C2-H2 | 109.68 |
| C5-C6 | 1.529 02 | C1-C2-C5 | 106.85 |
| C6-H6 | 1.103 59 | C2-C5-H5 | 108.37 |
| C6-H8 | 1.099 21 | H5-C5-C6 | 106.71 |
| C6-O10 | 1.447 10 | C5-C6-H6 | 112.73 |
| O10-H7 | 0.974 16 | C5-C6-O10 | 109.36 |
| C5-O8 | 1.444 47 | C6-O10-H7 | 108.41 |
| O8-C4 | 1.420 48 | C5-O8-C4 | 116.58 |
| C4-H4 | 1.105 28 | O8-C4-O9 | 110.13 |
| C4-O9 | 1.431 23 | O8-C4-C3 | 107.31 |
| C4-C3 | 1.544 57 | C4-C3-O6 | 111.73 |
| C3-H3 | 1.098 51 | C3-O6-N2 | 111.3 |
| C3-O6 | 1.444 62 | O6-N2-O3 | 111.71 |
| O6-N2 | 1.518 81 | O3-N2-O5 | 130.24 |
| N2-O3 | 1.226 17 | O5-N2-O6 | 118.05 |
| N2-O5 | 1.235 07 | C4-C3-C1 | 106.32 |
| C3-C1 | 1.559 09 | C3-C1-C2 | 109.19 |
3.2. Molecular dynamic simulations of two organic mixtures
As the second stage of this study, we performed a set of comparisons based on MD simulations. Figure 3 shows the initial configurations of both ethanol and diethyl ether systems. In which, purple clusters represent NC chains, next, green and red groups are ethanol and diethyl ether molecules respectively. Due to the minimization algorithm for each mixture system, the placement of each molecule was not as same as pre-designed. In this study, pre-treatment of minimization was performed by Conjugate Gradient (CG) algorithm. The ending criteria of energy (unitless) and force (Kcal mol−1 Å−1) were both about 1.0E-10. It was recorded that the total energy of ethanol and diethyl ether systems was minimised for about 9212.39 and 11 690.91 Kcal mol−1 respectively. Because the mixing process was a vertical transition in this study, we plotted the content distribution of ethanol and diethyl ether atoms along the Z-axis in figure 4. Initially, the vacuum lower than 20 Å represented the NC layer, and the peak on 2.5 Å resulted from periodical boundaries. According to those points at 500 ps, it seems that the mixing effect for both systems was quite unsatisfactory. Although parts of ethanol or diethyl ether molecules were moved into the NC layer, the final distribution of those molecules was still not uniform in the computational box, and those NC chains were keeping undissolved.

Figure 3. Initial snapshots of ethanol (a) and diethyl ether (b) mixture systems.
Download figure:
Standard image High-resolution image
Figure 4. Vertical distribution of ethanol and diethyl ether molecules at 0 and 500 ps.
Download figure:
Standard image High-resolution imageThe change of potential energies was presented by scattering points in figure 5 to make a clear comparison of transition processes. It is shown that the rapid transition process for both systems happened in the first 50 ps. Then the decline of potential energies trended to be flat and stable in the following 450 ps. The major difference between the two systems was on the deviation of potential energies. For the ethanol mixture system, the potential energy was declined for about 2142.67 Kcal mol−1 after 500 ps. At the same interval, the value for diethyl ether mixture system was only 1039.14 Kcal mol−1. It is reasonable to deduce that interactions from ethanol molecules were stronger than diethyl ether, although both of them had shown little solubility. Figure 6 is the Mean Square Displacement (MSD) of NC itself and two overall systems. From which, the diffusion coefficient of each object could be obtained. The formula for this transition has been introduced in our previous report [41]. In this study, the obtained diffusion coefficient for diethyl ether system was only 0.397E-6 cm2 s−1, while the data for ethanol system was about 0.644E-6 cm2 s−1, which means that dynamic movements of ethanol system were stronger than the ether system. Meanwhile, the same consequence was also proved by the diffusion state of NC chains, because the diffusion coefficient of NC in ethanol system was about 0.0696E-6 cm2 s−1 higher than those in diethyl ether system.

Figure 5. Plots of potential energies for both systems as a function of time.
Download figure:
Standard image High-resolution image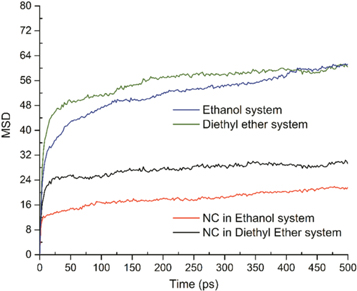
Figure 6. MSD plots of NC and overall systems as a function of time.
Download figure:
Standard image High-resolution image3.3. Characterization of NC and its mixtures
Overlapping fibres of NC are visible in the optical microscope images (figure 7). It is indicated that those curly fibres were originally twined together, and the edge of fibres was narrow. As assisted by the ruler at micrometres, the diameter of their cross-sections was measured in the range from 24.41 to 28.59 μm. Therefore, those dried NC varied in length and had uneven thickness. To obtain the information of the functional group, the dried NC specimen was tested by FTIR. As the spectrum in figure 8 shows, six downward peaks were detected from NC specimen. Despite the appearance of nitrate ester groups and other regular bonds, the most critical peak was about hydroxy (–OH). It is known that the NC was produced by exothermic esterification reactions on hydroxy groups [5]. Which means that the degree of esterification (substitution) could be various in industry. Our FTIR results indicated that the esterification reaction was not thorough, and a large number of hydroxy groups were still kept in NC. Next, the mass percentage of N was obtained by titration of Fe(SO4). While after ten parallel experiments, it was confirmed that each 0.2 g (m) NC needed 8.05 ml (V) Fe(SO4). According to equation (7) below, the mass percentage of N (M%) was around 9.39%. As transformed by equations (4)–(6), the substitution degree of the specimen was 1.556, and its nitrification degree was 150.146 ml g−1.


Figure 7. The morphology of dried NC obtained by an optical microscope.
Download figure:
Standard image High-resolution image
Figure 8. FTIR analysis of dried NC.
Download figure:
Standard image High-resolution imageAs a typical macromolecule, the molecular weight of NC is always averaged by its number (Mn), weight (Mw), Z value (Mz) and viscosity (Mv). In this study, those properties of NC were obtained by GPC tests. The selected eluent for NC was THF, and the concentration was about 1 g l−1. The GPC test was carried out around 30 °C, and the flow rate was about 1 ml min−1. Those obtained results from GPC have been listed in table 2. Additionally, the Mv of NC was validated by capillary viscosimeter. The provided constant of viscosimeter was 0.0635 mm2 s−2. Equations (8)–(11) [42, 43] are formulas for viscosity, where η: viscosity of NC solution; η0: viscosity of acetone; ηr: relative viscosity; ηsp: specific viscosity; c: concentration of NC solution; [η]: intrinsic viscosity of NC; K' and α are empirical constants. Table 3 has summarised all viscosity results from four acetone solutions with different concentrations of NC. Those acetone/NC solutions were labelled as solutions 1#, 2#, 3# and 4# with same concentration difference. Therefore, the intrinsic viscosity of this NC specimen was about 2.606. In this study, the K' and α were 2.53E-4 and 0.795, respectively [43], so the Mv obtained from capillary viscosimeter was 1.12E5. This value was close to the GPC result.


Table 2. Averaged molecular weight of NC tested by GPC.
| Properties | Mn | Mw | Mz | Mv |
|---|---|---|---|---|
| Value (g mol−1) | 6.37E4 | 2.93E5 | 8.88E5 | 2.09E5 |
Table 3. Results of capillary viscosimeter at room temperature.
| Solutions | 1# | 2# | 3# | 4# |
|---|---|---|---|---|
| c (g/100 ml) | 0.1 | 0.2 | 0.3 | 0.4 |
| η (mm2 s−1) | 1.453 | 1.752 | 2.057 | 2.379 |
| ηr | 4.598 | 5.544 | 6.509 | 7.528 |
| ηsp | 3.598 | 4.544 | 5.509 | 6.528 |
Once the characterization of NC specimen itself was finished, the next stage of this section was focused on the mixture of NC and two liquid organics. Due to the poor solubility of both ethanol and diethyl ether, we could not prepare much NC solution with a certain concentration. Therefore, we had to test the filtered NC solution to make comparisons on their saturated state. In table 4, specimen 1* and 3* are pure liquid ethanol and diethyl ether respectively, while specimen 2* and 4* are their saturated solutions with NC. It seems that the dissolving effects on ethanol solution were higher than that on diethyl ether solution because the viscosity of diethyl ether was hardly changed after the addition and filtering of NC. However, the viscosity of ethanol solution was increased for about 52%. Comparing with the ether solution, its deviation was much higher. In other words, the solubility of diethyl ether was even lower than ethanol, and this result was in good agreement with MD simulations above.
Table 4. Viscosities of filtered ethanol or ether solutions (1*, 2*, 3* and 4*).
| Specimens | 1* | 2* | 3* | 4* |
|---|---|---|---|---|
| Time (s) | 43.21 | 65.74 | 13.58 | 13.89 |
| Viscosity(mm2 s−1) | 2.744 | 4.174 | 0.862 | 0.882 |
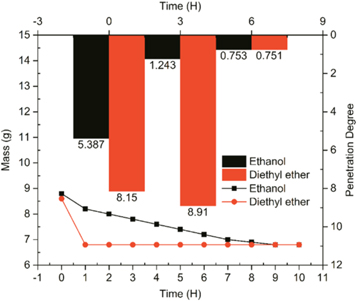
If the excess weight of NC was soaked under ethanol or diethyl ether solutions, the consistency of mixture could then be represented by penetration degree. The penetration degree of NC mixtures is demonstrated by histograms in figure 9. Meanwhile, the mass of each specimen is also plotted as a function of time. Generally, the ether-soaked NC specimen showed stronger volatility than ethanol-soaked one. As the model of volatilisation was a tablet, the exposure of diethyl ether-NC tablet under atmosphere resulted in the rapid loss of weight. On the contrast, the linear volatilisation of the ethanol-NC specimen was much slower than the former one. As for the penetration data, the standard penetration container is much larger and deeper than the tablet, so the strong volatilisation of diethyl ether delayed the decline of penetration degree. It seems that the substantial volatility of diethyl ether could keep the soaking effect on the mixture surface shortly because the inner diethyl ether volatilized efficiently up to surface.
Figure 9. Penetration and volatilization results of NC soaked by pure ethanol or diethyl ether.
Download figure:
Standard image High-resolution image
4. Conclusion
In the present study, we investigated the physical properties of NC and its mixture with 99.9% purity liquid ethanol or diethyl ether using first-principle calculations, MD simulations and other experimental approaches. We first modelled and optimized an NC chain (polymerisation degree: 8; substitution degree: 2; the mass percentage of N: 11.1%; nitrification degree: 177.489 ml g−1). The obtained bonding information was summarized in section 3.1 above. Secondly, five NC chains were placed below ethanol or diethyl ether systems to simulate mixing processes without external force. However, the mixing result was not as good as expected. Both mixture systems were far from the state of equal distribution, and the majority of NC chains were still in their original region. According to plots of potential energy and MSD, it seems that ethanol molecules had more influence on NC while comparing with diethyl ether molecules. Because they had stronger interactions and diffusions. The third part of this study was about characterizations. Our NC specimen was measured as thick as 24.41–28.59 μm, and the substitution degree of which was about 1.556. Four items of averaged molecular weight have been reported in section 3.3. Through saturated viscosities of both filtered solutions, it was confirmed that the solubility of ethanol was a little higher than diethyl ether. Finally, penetration and volatilisation results proved the high volatility of diethyl ether in NC mixture.
Acknowledgments
The authors would like to appreciate for financial supports from Fundamental Research Funds for Central Universities (3072020CFT0203).
Conflict of interests
The authors declare that they have no conflict of interest.