
Abstract
The hydrangea macrophylla-like SnO2 microspheres doped with different Ce contents (0, 2, 6 and 10 mol%) were synthesized by a facile hydrothermal method. The crystal phase, micro morphology and element composites were investigated by x-ray diffraction (XRD), field-emission scanning electron microscopy (FESEM), transmission electron microscopy (TEM) with energy-dispersive spectroscopy (EDS) and x-ray photoelectric spectroscopy (XPS). The results demonstrated the hydrangea macrophylla-like microstructure of the prepared samples and the existence of Ce3+/Ce4+ when doped with Ce element. Furthermore, the synthesized Ce-doped SnO2 samples' sensing properties were investigated. The SnO2 microspheres doped with 6 mol% showed the largest response to acetone during 0.2–20 ppm at 320 °C as well as good selectivity and reproducibility. As discussed, the Ce doping that generates n-n type heterojunction and the Ce3+/Ce4+ conversion increases the resistance change of Ce-doped SnO2 in reducing atmosphere and enhances the response.
Export citation and abstract BibTeX RIS

Original content from this work may be used under the terms of the Creative Commons Attribution 4.0 licence. Any further distribution of this work must maintain attribution to the author(s) and the title of the work, journal citation and DOI.
1. Introduction
In past decades, the environmental issues have drawn more and more attention world-widely, so gas sensors are very necessary in order to monitor the concentrations of gas pollution [1–4]. Based on the demands of low-cost, easy processing and excellent sensing properties, metal oxide semiconductors (MOSs) based gas sensors have been investigated in a large scale around world. There are two types of MOSs deferred by their carriers: n-type MOSs conduct electricity by electrons while p-type MOSs by holes. As one of the n-type MOSs, SnO2 has been researched in wide scope, such as in the fields of photoelectrical devices [5], gas sensors [6–11], solar cell [12], Li-ion battery [13], microwave-absorbing materials [14], photocatalysis [15], supercapacitor [16, 17]. Among these, the research on sensing characteristics of SnO2 is very important. Moreover, to get SnO2 based sensors with remarkable sensing properties, investigators have done lots of sophisticated endeavors [6–8, 18–22]
According to previous reports, the quantum confinement effects which relate to the microstructure, electronic and physicochemical property of the sensing materials determine the sensing performance [21–23]. Recent years many hierarchical SnO2 materials, such as porous films [24], nanoparticles [19], nanowires [25], 3D open porous structures [26], nanospheres [27], and nanodisks [28], also have been developed in order to detect various gases. Umar et al synthesized the SnO2 with square disk-based architecture by hydrothermal method, which exhibited a large response to 100 ppm ethanol about 110 (Rs) at 450 °C. The enhanced response value was due to the precipitation of oxygen atoms on SnO2 surface, which was stimulated by the density functional theory [21]. Lian et al prepared porous coryphantha elephantidens-like SnO2 nanoparticles, which exhibited fast response speed and distinguished selectivity to ethanol at 180 °C. The more specific surface and porosity were regarded as the main factors of the excellent performance [29]. Zhang et al reported the SnO2 microspheres prepared by one-step hydrothermal method, and the response and recovery time of sensors based on the prepared SnO2 surprisingly reached 3 s and 24 s to 100 ppm ethanol at 230 °C. The large specific surface and oxygen vacancies synergistically improved the sensing properties of SnO2 [30].
Although the microstructure of the materials affects the sensing performance, the surface state of SnO2 which relates to the electronic and physicochemical properties also plays an important role. It can be versatilely optimized by doping with other metal elements. For instance, the NO2 sensing properties of SnO2 were improved by Sb-implantation which changed the surface electron concentration and generated surface defects [31]. The p-type Co2O3 catalyzed SnO2 was synthesized and exhibited fast response and excellent sensitivity for more activity sites on surface [32]. The 1D Cd-SnO2 nanofibers were prepared by 'green synthesis' approach and showed outstanding sensitivity to formaldehyde. The doping of Cd increased the active sites for reactions of oxygen and formaldehyde [33]. The doped elements always function as catalysts and heterojunction to expand the change of the sensor's resistances before and after exposed to the test gas. Therefore, the synthesis of materials with hierarchical heterojunction is a relevant strategy to improve the sensitivity of gas sensors [34]. In particular, the Ce is a frequently-used doping element as it can increase the oxygen vacancy on the surface of the metal oxides, and has been used to improve the metal-oxides' gas sensitivity [35, 36].
Herein, we synthesized the Hydrangea macrophylla-like pure and Ce-doped SnO2 via one-step hydrothermal approach. Moreover, the effect of doping amount of Ce on the gas sensing performance was investigated. The results showed that the Ce doping can improve the response to acetone. Especially, when the doping amount was 6 mol%, the Ce doped SnO2 showed the optimal acetone even at low concentration as sub-ppm level: the response is 4.4 to 0.2 ppm acetone. The sensor also showed good selectivity and reproducibility. The excellent gas-sensing properties exhibited that the synthesized Hydrangea macrophylla-like SnO2 with Ce doping had the potential application in the field of volatile organic compounds (VOCs) detection. The effects of the Ce doping on the resistances and activity energies of the prepared sensors were also discussed to investigate the sensing mechanism.
2. Experimental
In the typical synthesis process, 2.25 g Na-citrate and 0.9 g stannous chloride dehydrate were added into mixed solvent of 27 ml deionized water and 18 ml ethanol, and stirred for 0.5 h. Then the calculated amount of cerous nitrate hexahydrate (in a ratio of 0, 2, 6 and 10 mol%, respectively) was added in the solution with continuously stirring. After the dissolution, the solution was transferred into a Teflon lined stainless steel autoclave and maintained in the constant temperature oven at 180 °C for 8 h. When the hydrothermal reaction finished, the products were collected after centrifugation and washed throughout by pure water and ethanol several times. After dried at 70 °C in the vacuum oven for 12 h, the product was sintered in Muffle furnace at 450 °C for 2 h. The prepared SnO2 doped with 0, 2, 6 and 10 mol% Ce were labelled as Ce0Sn, Ce2Sn, Ce6Sn and Ce10Sn, respectively.
The crystallization characteristics of products were investigated by an x-ray diffractometer (XRD, Rigaku D/max-2500) in the range of 20–80° using a Cu Kα source (λ = 1.5418 Å). The field-emission scanning electron microscope (FESEM, FEI Quanta 250 FEG) was used to observe the samples' morphologies. The transmission electron microscopy (TEM, JEOL JEM-2100) pictures and energy energy-dispersive spectroscopy (EDS) elemental mapping pictures were taken using a Titan G260-300 microscope with super EDS attachment. The x-ray photoelectron spectroscopy (XPS, Thermo ESCALAB 250XI) was carried out to investigate the element state.
The schematic of the sensor element and the prepared sensor's picture are shown in figure 1. To fabricate the device, firstly the as-prepared pure and Ce-doped SnO2 powder was grinded slightly and then mixed with pure water to get the paste. Then the paste was pasted on the Al2O3 ceramic tube (length: 4 mm, internal diameter: 0.8 mm) which had a couple of Au electrodes. A Ni-Cr heating coil was inserted into the ceramic tube (figure 1(a)). Finally, the prepared tube was soldered on the hexagon base (figure 1(b)). The sensors were tested in a static system: one sensor was put into the air and the resistance value (Ra) was recorded by a digital multimeter (Fluke 8846A). When the sensor was put into the test gas, the resistance value was recorded as Rg. The response value was defined as Rs = Ra/Rg.
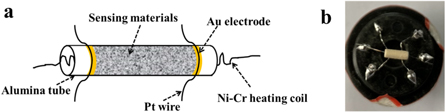
Figure 1. (a) Schematic of the sensor element and (b) the picture of the prepared sensor.
Download figure:
Standard image High-resolution image3. Results and discussions
Figure 2 shows the XRD spectra of the prepared pure SnO2 and Ce-doped SnO2 with different molar ratios. The diffraction spectra of the four samples are all referred to the pure tetragonal rutile phase SnO2, which match to the standard JCPD card No. 41-1445 very well. However, there is no peak which associates to Ce or cerium oxides. It indicates that the Ce element may be incorporated into the lattice of SnO2 [29, 37, 38]. Furthermore, to confirm the presence of Ce, the EDS element mapping and XPS test were carried out and the results are discussed in later sections.

Figure 2. XRD patterns of the synthesized pure SnO2 and Ce-doped SnO2 microspheres.
Download figure:
Standard image High-resolution imageThe morphology features of the synthesized SnO2 doped with different amounts of Ce are investigated by FESEM (figure 3). The synthesized samples reveal the hierarchical structures as flowers. As shown in the figure 3(a), the pure SnO2 exhibits 3D microsphere morphology, while at high magnification (figure 3(b)), the microstructure is like a hydrangea macrophylla flower. It is can be seen that the flower-like sphere with a diameter of about 4 μm is composed of nanosheets. In figures 3(c)–(h), with the increasing doping amount of Ce, some little particles arise on the flower petals, and the boundaries of microspheres become not obvious gradually. When the doping amount increases to 10 mol%, the SnO2 microspheres grow larger and begin to agglomerate.
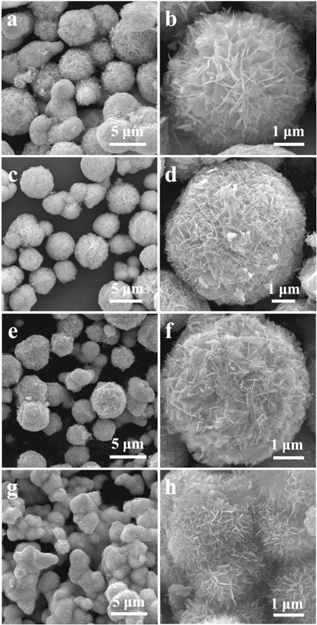
Figure 3. FESEM images of (a), (b) pure SnO2, (c), (d) 2 mol%, (e), (f) 6 mol% and (g), (h) 10 mol% Ce-doped SnO2 microspheres.
Download figure:
Standard image High-resolution imageFurthermore, to investigate the micromorphology of the 6 wt% Ce-doped SnO2 sample, the TEM measurement has been employed. Figure 4(a) shows the hierarchical structure of the Ce6Sn flower sphere with a diameter of about 4 μm. The high resolution image (figure 4(b)) indicates a local region of the sphere's fringe, in which the crystalline phase exists. The figure 4(c) shows the interplanar distance of 0.263 nm and 0.371 nm corresponding to the (101) and (110) lattice planes of SnO2, respectively. Besides, the interplanar distance of 0.161 nm is in accordance with the (311) lattice plane of CeO2 (JCPD No. 43-1002). The TEM elemental mapping images (figures 4(d)–(g)) exhibit the elements of the sample and their spatial distribution. Sn element is explored as the flower-like microsphere structure, while Ce element disperses over the entire flower-like structure region uniformly. It indicates the homogeneous distribution of Ce in the composite.

Figure 4. (a) TEM pictures of 6 mol% Ce-doped SnO2 microsphere, (b), (c) the HRTEM images of the local region, and (d)–(g) the EDS mapping images of the microsphere.
Download figure:
Standard image High-resolution imageTo confirm the Ce doping in the component, the element composition and chemical state of 6% Ce doped SnO2 have been investigated by XPS measurement. The holistic XPS spectrum is shown in figure 5(a), in which no impurity peak can be found except the peaks of Sn, Ce and O. It demonstrates the existence of Ce element and the purity of the prepared composite [37]. Additionally, figures 5(b)–(d) show the Sn 3d, Ce 3d and O 1s core level XPS spectra of Ce6Sn.
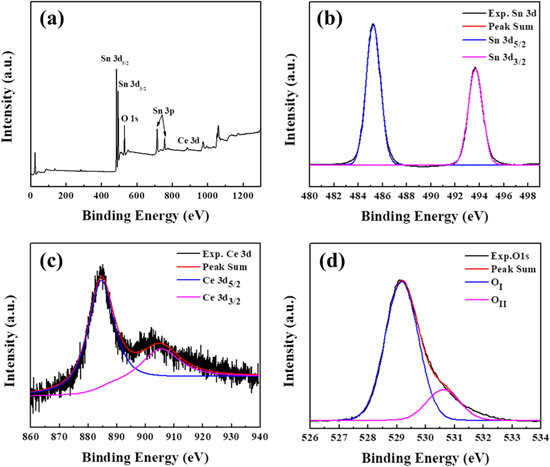
Figure 5. XPS patterns of 6 mol% Ce-doped SnO2: (a) the whole spectrum, (b) Sn 3d, (c) Ce 3d and (d) O 1s spectra.
Download figure:
Standard image High-resolution imageThe high resolution spectrum of Sn 3d shows a pair of asymmetric peaks in figure 5(b). The binding energies of 485.24 eV (3d5/2) and 493.67 eV (3d3/2) correspond with Sn4+ [39]. In figure 5(c), the peaks at 884.71 eV and 905.47 eV can be assigned to Ce4+ 3d5/2 and Ce3+ 3d3/2 respectively, which is due to the 3d spin-orbit coupling effect [37, 40]. The core level O 1s XPS spectrum is shown in figure 5(d) and has been de-convoluted into two components: OI and OII. The peak at 529.17 eV (OI) is attributed to lattice oxygen in the O–Sn–O while the peak at 530.61 eV (OII) is associated to the oxygen in the deficient region [20, 41].
As the working temperature affects the gas absorption on the metal conductor oxides, it is necessary to explore the optimal temperature [42, 43]. The figure 6 shows the sensors' response to 5 ppm acetone gas. The response values of all prepared sensors to test sample increase as working temperature is elevated. It may be due to that rising the temperature gives the gas molecules energy to pass the barrier activation energy barrier of the surface reaction. However, too high temperature may promote gas desorption. When the temperature rises above the optimal temperature, the adsorption capacity of the test gas becomes less than the desorption capacity. A further increase in temperature will result in a reduction in the response [44, 45]. The result indicates that 320 °C is the optimal working temperature for the sensors.

Figure 6. Responses of different Ce contents doped SnO2 sensors to 5 ppm of n-butanol at 240 °C–400 °C.
Download figure:
Standard image High-resolution imageThe sensors' real-time variation of response values with concentration are show in figure 7(a) at the working temperature of 320 °C. The response values of all the prepared sensors increase as the acetone concentration increases. Moreover, the Ce-doped SnO2 sensors exhibit the improved response values to acetone at the test concentration range. The Ce2Sn sensor and Ce10Sn sensor also show larger response than Ce0Sn sensor; notwithstanding their response values are lower than that of 6% Ce doping. Figure 7(b) obviously shows the curves of response to concentration of the prepared sensors. When the doping amount of Ce is 6%, the sensor's response values are 4.4, 6.0, 7.4, 11.3, 20.5, 31.8 and 45.3 to 0.2, 0.5, 1, 2, 5, 10 and 20 ppm. At the 5 ppm, the response value of 6% Ce doping is 2.8, 1.8 and 1.3 time than 0%, 2% and 10% Ce doping. From the result, it is deduced that the Ce-doping is beneficial to the sensitivity. However, the excessive Ce doping has an adverse effect as the Ce ions may take up the active site on the surface of SnO2 microstructure [44].
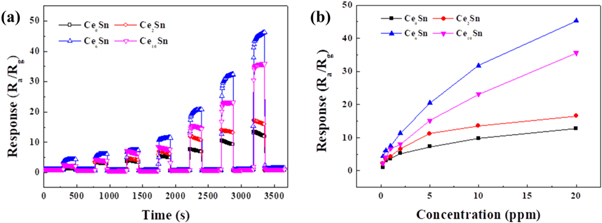
Figure 7. (a) Dynamic gas response curves and (b) response-concentration curves of different Ce contents doped SnO2 sensors to 0.2–20 ppm acetone under 320 °C.
Download figure:
Standard image High-resolution imageFigure 8(a) shows the selectivity test result of prepared sensors. All the prepared sensors were measured in 5 ppm acetone, alcohol, toluene, hexane and NO2 at 320 °C. It shows that the Ce6Sn sensor shows largest repose to acetone. The reproducibility of sensors should be concerned if they are applied in practice. As shown in figure 8(b), there is no obvious shift in response to 2 ppm acetone during 4 cycles at 320 °C. It indicates the good repeatability of the Ce6Sn sensor. Moreover, the prepared 6 mol% Ce-doped SnO2 based sensor shows excellent response to acetone compared to other metal-oxides based sensors as shown in table 1.
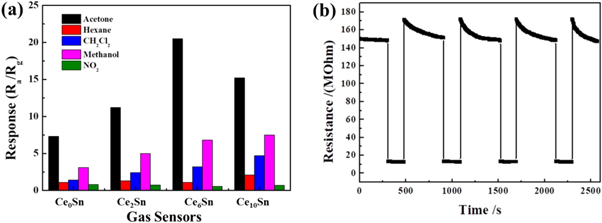
Figure 8. (a) Cross-responses of the sensors to various test gases (5 ppm), and (b) repeated response curves of Ce6Sn sensor to 2 ppm acetone.
Download figure:
Standard image High-resolution imageTable 1. Comparison of acetone sensing performances based on various metal-oxides.
| Materials | Temperature (°C) | Acetone concentraton (ppm) | Response | References |
|---|---|---|---|---|
| Co3O4 nanocubes | 240 | 10 | 1.34 | [46] |
| WO3-SnO2 composite | 360 | 100 | 12.1 | [47] |
| CeO2-ZnO composite | 320 | 5 | 16.2 | [41] |
| Co3O4 hollow nanocages | 350 | 5 | 2.51 | [48] |
| In2O3/TiO2 nanowires | 250 | 10 | 33.34 | [49] |
| NiO/ZnO hollow spheres | 275 | 100 | 30 | [50] |
| Nanoporous TiO2 | 370 | 20 | 2.22 | [51] |
| ZnO/ZnFe2O4 composites | 250 | 100 | 16.8 | [52] |
| SnO2 nano-particulate | 200 | 300 | 24 | [53] |
| SnO2 Microtubes | 50 | 50 | 8.1 | [54] |
| Ce-doped SnO2 | 320 | 5 | 20.5 | This work |
According to previous reports, the Arhenius equation has been used to estimate the reaction energy (Ea) that pertains to the ability of reacting species to overcome a free energy barrier [23, 45, 55–57]. For most of the chemical reactions, the Arhenius equation can be given as:
herein, the k (∝1/Rg) is the rate of the reaction [55, 56]; T is the reaction temperature; R is the gas constant (8.314 J · mol−1 · K−1) and A denotes the pre-exponential constant. The curves of ln(1/Rg) and 1/T of Ce0Sn and Ce6Sn sensors towards to 5 ppm acetone are shown in figure 9. The Ea of Ce6Sn sensor (37.71 kJ mol−1) is smaller than that of Ce0Sn sensor (41.23 kJ mol−1). This suggests that the Ce doping is favorable to reduce the Ea of the reaction between the test gas and the surface oxygen species, resulting in larger response to acetone.

Figure 9. Arrhenius plots of Ce0Sn and Ce6Sn exposed to 5 ppm acetone. The activation energies Ea were calculated from the slope of the curves.
Download figure:
Standard image High-resolution imageThe gas sensing behavior of semiconductor oxides can be explained by the conductivity changes due to mutual effect of test gas and chemisorbed oxygen. As a n-type semiconductor, while the SnO2 contacts air, a mass of oxygen molecules which can acquire the free electrons from SnO2 are chemisorbed on the surface in the term of 
 and
and  depending on the surrounding temperature. Consequently, a depleting layer forms on the surface of SnO2, resulting in elevated resistance. When the semiconductor is exposed to the reducing gas, the chemisorbed oxygen species on the surface of semiconductor can be consumed by oxidizing reaction. In this case, the acetone was oxidized: C3H6O + 8 O−
(ads) → 3CO2 + 3H2O + 8e−. The captured electrons were released from the chemisorbed oxygen species, which led to the reduction in the resistance. Herein, the reason for the Ce doped SnO2 gas sensor becomes complicated as the n-n type heterojunction forms. The electrons transfer from CeO2 (Φ = 4.9 eV) to SnO2 (Φ = 5.2 eV), resulting in higher resistance (figure 10). As a reducing gas, the increased resistance is beneficial for enhanced response [58]. Moreover, the Ce4+ can change to Ce3+ by capturing electrons in reducing atmosphere at elevated temperature. It creates plenty of vacancies, which can increase the amount of chemisorbed oxygen and enhance the response of sensors [59]. Besides, the hydrangea macrophylla-like microstructure plays an important role on the gas sensitivity for abundant surface is beneficial to gas absorption and reaction on the surface.
depending on the surrounding temperature. Consequently, a depleting layer forms on the surface of SnO2, resulting in elevated resistance. When the semiconductor is exposed to the reducing gas, the chemisorbed oxygen species on the surface of semiconductor can be consumed by oxidizing reaction. In this case, the acetone was oxidized: C3H6O + 8 O−
(ads) → 3CO2 + 3H2O + 8e−. The captured electrons were released from the chemisorbed oxygen species, which led to the reduction in the resistance. Herein, the reason for the Ce doped SnO2 gas sensor becomes complicated as the n-n type heterojunction forms. The electrons transfer from CeO2 (Φ = 4.9 eV) to SnO2 (Φ = 5.2 eV), resulting in higher resistance (figure 10). As a reducing gas, the increased resistance is beneficial for enhanced response [58]. Moreover, the Ce4+ can change to Ce3+ by capturing electrons in reducing atmosphere at elevated temperature. It creates plenty of vacancies, which can increase the amount of chemisorbed oxygen and enhance the response of sensors [59]. Besides, the hydrangea macrophylla-like microstructure plays an important role on the gas sensitivity for abundant surface is beneficial to gas absorption and reaction on the surface.

Figure 10. Dynamic response curves to 5 ppm acetone of (a) Ce0Sn sensor and (b) Ce6Sn sensor.
Download figure:
Standard image High-resolution image
4. Conclusion
In summary, Ce-doped SnO2 microspheres were synthesized by hydrothermal method. The HRSEM results indicated that the hydrangea macrophylla-like microstructure SnO2 formed and constructed by abundant nanoflakes. The TEM and XPS results provided that the Ce element (Ce4+ and Ce3+) existed on the surface of the Ce-doped SnO2 microspheres. The sensing characterization of prepared SnO2 doped with several Ce contents (0, 2, 6 and 10 mol%) were investigated. The sensing characterization test results showed that the Ce-doped SnO2 improved the response to acetone during the concentration range of 0.2–20 ppm. Especially, the sample of SnO2 doped with 6 mol% Ce had the best gas sensitive performance to acetone. The n-n type heterojunction and flower-like hierarchical microstructure affected the gas sensing properties jointly.
Acknowledgments
The authors appreciate the support from National Natural Science Foundation of China (Nos. 61703446, 61703216, 51803245 and 51973246) and Science and Technology Project of Henan Province (Nos. 172102210073 and 182102210125). This work is also supported by Program for Interdisciplinary Direction Team in Zhongyuan University of Technology, China.