
Abstract
Full-Heusler compounds have three crystal structures with a different order degree; the highly ordered L21, partially disordered B2, and completely disordered A2 structures. To reveal the effects of the order degree on thermoelectric (TE) properties of the full-Heusler compounds, Mn2VAl samples with varied L21 and B2 order degrees are prepared by changing preparation conditions, and their Seebeck coefficients and electrical conductivities are measured in a wide temperature range. As the B2 order degree becomes higher, the Seebeck coefficient increases, leading to the increase of the power factor (PF). The maximum PF is 2.84 × 10⁻⁴ Wm−1 K−2 at 767 K for the Mn2VAl sample with the highest B2 order degree. This study demonstrates that the TE properties of Mn2VAl can be enhanced by increasing the fraction of the B2 phase. A relation between the Seebeck coefficient and crystal structures is also discussed based on the calculation of the electronic density of states of Mn2VAl with the L21 and B2 structures.
Export citation and abstract BibTeX RIS

Original content from this work may be used under the terms of the Creative Commons Attribution 4.0 licence. Any further distribution of this work must maintain attribution to the author(s) and the title of the work, journal citation and DOI.
1. Introduction
Thermoelectric (TE) materials are attracting attention because they can generate electric power from thermal energy without using fossil fuels [1–6]. To realize high power generation, a TE material should have high Seebeck coefficient, S, and high electrical conductivity, σ. The power factor, PF (= S2σ), is used as a measure of the power generation from the TE materials. Recently, research on full-Heusler compounds as a TE material has made rapid progress [7–18]. Most full-Heusler compounds possess magnetism which enriches a possibility to achieve high TE properties. Our previous work revealed that a half-metallic full-Heusler Mn2VAl compound is a promising p-type TE material [17]. Compared with other full-Heusler compounds, the Mn2VAl compound has an advantage that it can be easily prepared by various methods such as arc-melting [17, 19–21], spark-plasma-sintering (SPS) [17], induction-melting [22, 23], and ultra-high-vacuum magnetron sputtering technique [24–26]. A disadvantage of the Mn2VAl compound is its low PF = 2.7 × 10⁻⁴ Wm−1 K−2 at 717 K [17], being inferior to an n-type half-metallic full-Heusler Co2MnSi compound (2.9 × 10⁻³ Wm−1 K−2 at 550 K [16]).
A new strategy to improve the PF of the Mn2VAl compound is controlling an order degree which is a characteristic of the full-Heusler compounds. Their crystal structures are clarified in terms of the order degree; the highly ordered L21, partially disordered B2, and completely disordered A2 structures. The L21, B2, and A2 order degrees correspond, respectively, to the existence fraction of the L21, B2, and A2 structures in a prepared full-Heusler compound. The change in the order degree alters electronic states and hence affects TE properties. In fact, the prepared Mn2VAl sample crystallizes in a L21 + B2 structure, which exhibits a higher Seebeck coefficient than the calculation based on the L21 structure [17]. Similar deviation between measured and calculated Seebeck coefficients is reported for Co-based full-Heusler compounds [16]. The prepared Co-based full-Heusler samples contain the B2 structure, whereas the L21 structure is adopted in the calculation of the Seebeck coefficient. Thus, it is expected that the increase in the fraction of the B2 phase of the Mn2VAl compound, i.e., the decrease in the L21 order degree, enhance the Seebeck coefficient and PF. In this work, we prepared Mn2VAl samples with different order degrees by changing preparation conditions, and revealed the relation between the order degree and TE properties.
2. Methodology
A mixture of stoichiometric amounts of Mn granules (99.9%, Kojundo Chemical Laboratory), V powder (99.5%, Kojundo Chemical Laboratory) and Al granules (99.99%, Kojundo Chemical Laboratory) were dry-type ball-milled (BM) for 4 h, 12 h, 24 h, 30 h, or 36 h under Ar atmosphere and subsequently wet-type ball-milled for 4 h. The obtained mixture of the fine Mn, V, and Al powders was sintered by SPS (SPS-520S, Fuji Electronic Industrial) at 1173 K for 5 min, 60 min, or 240 min under an applying pressure of 50 MPa. During this SPS process, chemical reaction between Mn, V, and Al powders occurred, and Mn-V-Al compounds including Mn2VAl were produced. The packing density of all samples exceeded 90%.
The crystal structure of the SPSed samples was analyzed by powder x-ray diffraction (XRD; D8 ADVANCE, Bruker) with a Cu Kα radiation. The L21 and B2 order degrees (S111 and S200, respectively) were evaluated by using the Webster model [27] expressed as:


where I with subscript '111/220/200' and 'exp/calc' is the XRD peak intensity of 111, 220, or 220 peak in the experimentally obtained XRD patterns or in the calculated ones for the L21 or B2 phase. The fractions of the L21 and B2 phases are estimated by S111 and S200-S111, respectively. The composition was confirmed by using a scanning electron microscope equipped with an energy-dispersive X-ray spectrometer (SEM-EDX; JSM-IT100, JEOL). The S and σ were measured simultaneously in a He atmosphere from 300 K to 1100 K using TE properties measurement system (ZEM-3, Advance-Riko).
The AkaiKKR package [28] was used to perform the Korringa-Kohn-Rostoker calculation under the coherent potential approximation for Mn2VAl with the L21 and B2 structures. The local density approximation was used for the calculation. The angular momentum cut-off was 2, i.e., up to d-scattering was considered. To calculate total and partial density of states (DOS), the imaginary part at the Fermi level (EF) was set at 0.0001 Ry.
3. Results and discussion
By adjusting the BM time and/or the SPS time, we attempted to prepare Mn2VAl samples. Figure 1 shows XRD patterns of SPSed samples prepared by using BM powders with a different BM time from 4 h to 36 h. The SPS time was set at 5 min. Also shown in the figure is a simulated XRD pattern of Mn2VAl in the L21 structure using a reported lattice constant of 5.897 Å [29]. A single phase of Mn2VAl was obtained when the BM time was between 12 h and 30 h. The 111, 200, 220, 311, 222, and 400 peaks for the Mn2VAl phase [29] were identified. The lower 111 peak intensity for the Mn2VAl samples than that in the simulation indicates that all Mn2VAl samples crystalized in a L21 + B2 structure. As the BM time was extended, the 111 peak intensity decreased, i.e., the fraction of the L21 phase decreased and instead the fraction of the B2 phase increased. The estimated B2 fraction in the Mn2VAl samples is plotted against the BM time on the blue surface in figure 2. With increasing the BM time, the B2 fraction increased from 27% to 66%. The increase of the BM time decreases the size of the Mn, V, and Al grains, which makes it easier to promote the displacement of V and Al atoms in Mn2VAl during the SPS process. Probably, this is a reason for the increase of the B2 fraction.

Figure 1. XRD patterns of the SPSed samples by changing the BM time. The SPS time was 5 min. Using the lattice parameter of 5.897 Å [29], an XRD pattern for Mn2VAl in the L21 structure is simulated and shown at the bottom of the figure.
Download figure:
Standard image High-resolution image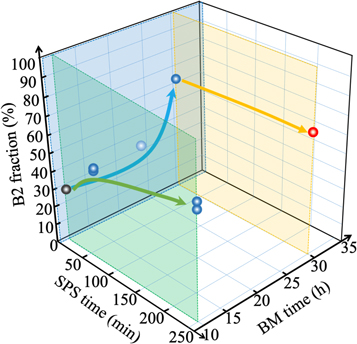
Figure 2. Relationship between the preparation conditions and the B2 fraction of the Mn2VAl samples.
Download figure:
Standard image High-resolution imageNext, we investigated the relation between the SPS time and the B2 fraction as shown on the green surface in figure 2. The BM time was 12 h. As the SPS time became longer, the B2 fraction increased from 27% to 66%. This result can be explained by considering that the longer SPS time provides enough time to exchange between V and Al atoms in Mn2VAl, resulting in an increase in the B2 fraction. Because the longer BM time and longer SPS time both increased the B2 fraction, we prepared a Mn2VAl by setting the BM time at 30 h and the SPS time at 240 min. As plotted on the orange surface in figure 2 (red circle), we obtained the highest B2 fraction of 66% among the samples. The above experimental results demonstrate that the B2 fraction can be successfully controlled from 27% (black circle) to 66% by changing the BM time and/or the SPS time. Hereafter, we call each Mn2VAl sample 'the x% sample', using the B2 fraction of x%. On a separate note, we confirmed the lattice constant of all Mn2VAl samples was within a range of 5.886 Å–5.887 Å. In addition, the SEM-EDX observation confirmed that the composition of all samples was Mn:V:Al = 2:1:1.
Figure 3(a) shows the temperature dependent S of the 27% and 66% samples. Both samples showed a similar temperature dependence; with increasing temperature, the S value increased and then decreased above 767 K, which is attributed to the magnetic phase transition of Mn2VAl as pointed out in our previous work [17]. Mn2VAl is a ferrimagnetic compound below ∼767 K, above which it transforms to a paramagnetic phase [19]. These magnetic properties are not significantly affected by the order degree in the case that Mn2VAl is in a L21 or B2 structure, because calculated exchange parameters are similar between the two structures [30]. On the other hand, we found no obvious difference between the measured Seebeck coefficients in the heating process and the cooling process within the error range (not shown here). This means that the structural change from a L21 structure to a B2 structure in Mn2VAl occurs at much higher temperature (>1100 K). Thus, the ferrimagnetic to paramagnetic phase transition leads to the decreased S due to the increased hole carriers accompanied by the magnetic phase transition. Importantly, the 66% sample showed higher S values than the 27% sample. The maximum S value of 27.7 μVK−1 at 767 K was recorded for the 66% sample, which was 1.7 times as high as that of the 27% sample. Furthermore, this value was the highest among the samples prepared in this study (figure 3(b)), and was also slightly higher than the literature value (green circle) [17]. We can conclude from figure 3(b) that the S value became higher with increasing the B2 fraction. The relation between the S value and crystal structures will be discussed later.

Figure 3. (a) Temperature dependent S of Mn2VAl samples with a different B2 order degree. (b) Relationship between the B2 fraction and S of the Mn2VAl samples at 767 K. The green circle is a data reported in [17]. The gray curve is only guide to the eye.
Download figure:
Standard image High-resolution imageFigure 4(a) shows the temperature dependent σ of the 27% and 66% samples. Opposite to the results of S, the σ value of the 66% sample was lower than that of the 27% sample. According to the formula σ = neμ (n, e, and μ are the hole carrier density, electric charge, and carrier mobility, respectively), the lower σ is due to the decrease in hole carrier density and/or the decrease in carrier mobility caused by the partial disorder in the B2 structure. However, the σ values of all samples plotted in figure 4(b) did not show clear dependence on the B2 fraction. In particular, two samples with the B2 fraction of ∼60%, indicated by a dotted gray circle in figure 4(b), contained severe cracks. Excluding these samples, one can find a slightly decreasing tendency of σ with increasing the B2 fraction.

Figure 4. (a) Temperature dependent σ of Mn2VAl samples with a different B2 order degree. (b) Relationship between the B2 fraction and σ of the Mn2VAl samples at 767 K. The green circle is a data reported in [17]. The gray dotted line is only guide to the eye.
Download figure:
Standard image High-resolution imageFrom the measured S and σ, PF was calculated. Figure 5(a) shows the temperature dependent PF of the 27% and 66% samples. Reflecting the temperature dependence of S, PF increased with increasing temperature and decreased above 767 K. Because of the higher S of the 66% sample than that of the 27% sample, the 66% sample showed higher PF than the 27% sample. The PF value at 767 K for all samples are plotted in figure 5(b). The green circle indicates the literature data [17]. One can see that the PF value increased as the B2 fraction increased. In the present work, the highest PF of 2.84 × 10⁻⁴ Wm−1 K−2 at 767 K was obtained for the 66% sample, which was higher than that of the 27% sample by 2.7 times.

Figure 5. (a) Temperature dependent PF of Mn2VAl samples with a different B2 order degree. (b) Relationship between the B2 fraction and PF of the Mn2VAl samples at 767 K. The green circle is a data reported in [17]. The gray curve is only guide to the eye.
Download figure:
Standard image High-resolution imageFinally, we discuss a reason for the increasing S with increasing the B2 fraction in terms of the electronic DOS of Mn2VAl. Figure 6(a) shows the total and partial DOSs of Mn2VAl with the L21 structure. The fine structures in the total DOS agreed well with those reported in an earlier literature [31]. At EF, the total DOS of the majority-spin electrons (0.090 states/eV) were significantly fewer than that of the minority-spin electrons (3.3 states/eV), corresponding to the half-metallic characteristic of Mn2VAl. The spin polarization was 95%. Figure 6(b) shows the total and partial DOSs of Mn2VAl with the B2 structure. Although the fine structures as found in the DOS for the L21 structure were broadened due to the disorder in the B2 structure, the B2 structure maintained the half-metallic nature comparable to the L21 structure; the total DOS of the majority- and minority-spin electrons at EF were 0.10 states/eV and 2.8 states/eV, respectively, leading to the spin polarization of 93%. The L21 and B2 structures both exhibited high half-metallicity, and hence it is concluded that their magnetic properties do not relate to the difference in S between the L21 and B2 structures.

Figure 6. Calculated total and partial density of states (DOS) of Mn2VAl with (a) L21 and (b) B2 structures. An enlarged view of the partial DOS of sp-electrons for (c) L21 and (d) B2 structures.
Download figure:
Standard image High-resolution image
It is pointed out that dominant carriers for the S value of full-Heusler compounds are not localized d-electrons but itinerant sp-electrons [16]. Thus, we compared the partial DOS of sp-electrons around EF for the L21 and B2 structures as shown in figures 6(c) and (d), respectively. According to Mahan et al [32], the S value of a metal is proportional to the first derivative of DOS and inversely to the DOS at EF expressed as:

To estimate the S value of the majority- and minority-spin electrons, we fitted a line, DOS(E) = AE + B, to the DOS around EF, which is drawn in figures 6(c) and (d) together with its equation. Using the coefficients A and B, the S value can be estimated as  The calculated values were
  eV−1,
eV−1,  eV−1,
eV−1,  eV−1, and
  eV−1. It is found that majority-spin electrons contributed more to S than minority-spin electrons, making the sign of S of Mn2VAl positive. In addition,
  was higher than
  mainly reflecting the steeper DOS of the majority-spin sp-electrons for the B2 structure than that for the L21 structure. Thus, it is expected that the B2 structure shows higher S than the L21 structure, which is consistent with our experimental result of the increasing S as the B2 fraction increased.
From the above considerations, we conclude that the B2 fraction should be increased to realize high PF for Mn2VAl owing to the increase in S. In this work, the B2 fraction was increased to 66% by controlling the BM time and the SPS time. In addition to changing these preparation conditions, post-preparation treatment such as annealing will be performed to further increase the B2 fraction of Mn2VAl, which enables Mn2VAl to be utilized for TE power generation devices.
4. Conclusion
In summary, by adjusting the preparation conditions (the BM time and/or SPS time), we demonstrated a successful fabrication of p-type full-Heusler Mn2VAl samples with different B2 fractions. It was revealed that the change in the B2 fraction in the Mn2VAl samples affected the TE properties; the S and σ values increased and decreased, respectively, with increasing the B2 fraction. Because the increase of S surpassed the decrease of σ, the maximum PF of 2.84 × 10⁻⁴ Wm−1 K−2 was recorded at 767 K for the Mn2VAl sample with the highest B2 fraction (66%) among the samples prepared in this work. Through the calculation of electronic density of states (DOS) of Mn2VAl with the L21 and B2 structures, we found that the reason for the increase of S along with the higher B2 fraction was mainly due to the change in the DOS of the majority-spin sp-electrons. A higher PF will be realized by achieving higher B2 fraction in Mn2VAl through the optimization of post-preparation treatment as well as preparation conditions.
Acknowledgments
This work was partly supported by the Grant-in-Aid for Scientific Research (B) (No. 17H03398) from the Ministry of Education, Culture, Sports, Science, and Technology of Japan, and by Tsinghua-Tohoku Collaborative Research Fund.