
Abstract
Although carbon fiber reinforced epoxy composites (CF/EP) have been widely used in many fields, it is still unknown if such composites could be used in extreme environments exposed to high-intensity thermal radiation that could result in severe damage to materials. In this case, CF/CP has been prepared through thermocompression method and the thermal radiation experiment has been designed and performed. The obtained results show that the parameters including irradiation power density and irradiation time directly affect the damage degree. After irradiation with 4–6 W cm−2 of thermal radiation, decomposition occurred in all CF/EP composites. In addition, the numerical simulation method was used to calculate the effect process, and the results showed that when the thermal radiation coefficient was 0.88, the calculated temperature history was consistent with that of the experiment. After irradiated at 6 W cm−2 for 30 s, the decomposition thickness reaches to 0.7 mm, indicating the high-intensity thermal radiation has caused an obvious effect on CF/EP.
Export citation and abstract BibTeX RIS

Original content from this work may be used under the terms of the Creative Commons Attribution 4.0 licence. Any further distribution of this work must maintain attribution to the author(s) and the title of the work, journal citation and DOI.
1. Introduction
A strong explosion could form an extremely high temperature, which further leads to the generation of the high-intensity thermal radiation. The generated thermal radiation usually covers a large area, with potential peak intensities up to several hundred W cm−2 [1, 2]. Such high intensity could result in a severe damage to traditional structural materials.
Carbon fiber reinforced epoxy composites (CF/EP) are the common structural materials and have been widely used in aerospace, aviation, transportation, and other fields owning to their high specific strength and modulus [3, 4]. With the increasing application range of CF/EP, these composites could face extreme situations, such as explosion. Many researchers tried to use laser radiation to study the damage behavior under thermal radiation [5–8]. Although these two types of radiation have some physical process similarities, thermal radiation belongs to the continuous spectrum and the irradiation area is large, while laser radiation is often monochromatic and the irradiation area is small, resulting in significant differences in both energy coupling and irradiation effects [9–12]. To the best of authors' knowledge, studies on the thermal radiation effect of CF/EP have minimally been reported. Direct measurement of the coupling characteristics of the thermal radiation spectrum is difficult, which is very important for understanding the damage mechanism and engineering application.
Acquiring high-intensity thermal radiation within a large uniform area is really difficult under the current available instrument condition [13, 14]. In this study, a relatively low-intensity thermal radiation source is temporarily used to design and carry out an experimental study on the thermal irradiation effect on CF/EP. The key parameters, including material temperature and the thermal decomposition process, are measured and the thermal response law of CF/EP under thermal radiation is analyzed. On this basis, the process of the irradiation effect was modeled by the numerical simulation method, and the thermal radiation absorption coefficient of the material was obtained by the parameter inversion method. In addition, the decomposition depth and thermal stress distribution of CF/EP under thermal radiation were also calculated.
2. Experimental
The irradiation experiment was conducted on the radiation platform of the thermal radiation source in the State Key Laboratory of Fire Science, University of Science and Technology of China. The structure of the platform and the position diagram of each measuring instrument are shown in figure 1. The thermal radiation source is composed of a silicon and molybdenum rod array, which generates thermal radiation through heating. The thermal radiation power density can reach 8 W cm−2 under an irradiation area of 530 mm × 530 mm. Infrared thermography and thermocouple were used to measure the temperature history of the irradiated surface and back surface of the samples. A high-speed camera was used to monitor the dynamic process of sample irradiation. Photodetectors recorded the start and end times of irradiation by collecting optical signals.

Figure 1. Schematic of the thermal radiation platform.
Download figure:
Standard image High-resolution imageEpoxy resin (Model: E51) and alicyclic amine modified epoxy curing agent (Model: 6182) was obtained from Beijing Tonglian Hengxing Technology Co., Ltd Carbon fibers (Model: T300) were provided by Yancheng Xiang Sheng Carbon Fiber Technology Co., Ltd Carbon fiber CF/EP samples were prepared through compression molding, and the volume ratio of carbon fiber is 60%. The size of the CF/EP sample was 10 cm × 10 cm and the thickness was 3 mm. The irradiation experiments were conducted at different power densities (4–6 W cm−2) and irradiation times (20–60 s).
3. Results and discussion
3.1. Macro-morphologies of CF/EP during irradiation process
A temperature increase is produced on each CF/EP sample that is thermally irradiated, which leads to thermal decomposition and even combustion. The thermal response of the CF/EP composites is different under different irradiation conditions. Figure 2 shows the macro-morphologies of CF/EP at different thermal radiation parameters. No obvious phenomenon was observed when the sample was irradiated at 4 W cm−2 for 30 s (see figures 2(a) and (b)). However, when the power density was increased to 6 W cm−2 for 30 s, a large amount of white smoke was released, indicating the pyrolysis of CF/EP (see figures 2(c) and (d)).
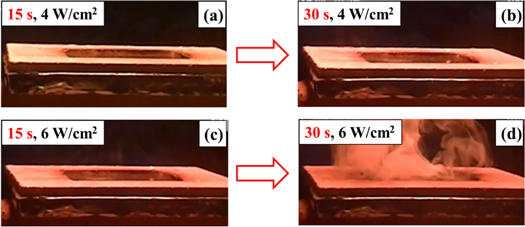
Figure 2. Macro-morphologies of CF/EP under different radiation parameters: (a) 15 s, 4 W cm−2, (b) 30 s, 4 W cm−2, (c) 15 s, 6 W cm−2, and (d) 30 s, 6 W cm−2.
Download figure:
Standard image High-resolution image3.2. Temperature evolution of CF/EP during the irradiation process
The spatial distribution and variation of temperature on the irradiated surface were recorded by infrared thermography. Figure 3(a) shows the spatial distribution image of the temperature recorded by the infrared thermal imager at 15 s under a power density of 6 W cm−2. It can be observed that the temperature distribution on the irradiated surface of materials is not uniform. There are two reasons for the uneven temperature distribution of the samples. First, the spatial distribution of thermal radiation is not uniform, and the second reason is due to the heterogeneity of the sample itself. In this experiment, the spatial unevenness of the thermal radiation emitted from the light source was calibrated and detected to be less than 2%. Based on this fact, the main reason for the uneven surface temperature is the material itself. Under the condition that the irradiation location is the same, the front surface temperature distribution of different samples presents different characteristics, which to some extent confirms the above inference.

Figure 3. (a) Temperature distribution of the front surface, (b) center temperature change with time.
Download figure:
Standard image High-resolution imageFor the irradiation effect of materials, the main concern is temperature. Figure 3(b) shows the temperature change process at the center of the sample at different irradiation times (20 s, 30 s, and 45 s) under a power density of 6 W cm−2. It can be seen from the figure that the temperature trend of samples under different irradiation times is similar, reflecting the same thermophysical characteristics of the materials. Near the end of the 30 s and 45 s irradiation periods, the temperature history curve suddenly increased, while the temperature history curve of 20 s did not change. Combined with the measurement results of the high-speed cameras, it can be concluded that pyrolysis of the materials is the cause of the abrupt temperature increase. The pyrolysis of the material produces a large amount of flue gas (which can be visually seen from the high-speed camera), and further radiation of the flue gas leads to the temperature increase measured by the thermal imager. Thus, abrupt changes in material temperature also provide an indicator for whether or not the sample will decompose.
To precisely detect the pyrolysis time of the CF/EP, a photodetector is used to record the time history of irradiation. A typical irradiation time history recorded by the detector under 5 W cm−2 irradiation for 45 s is shown in figure 4. The irradiation time history in the experiment can be divided into two categories: (1) when the material is not pyrolyzed, the time history curve is continuous and smooth, and (2) when the length of time increases, the curve gradually becomes wobbly. The gas produced by pyrolysis causes oscillation in the optical signal recorded by the photodetector. Therefore, the oscillation in the above time history indicates the pyrolysis of the sample.

Figure 4. Typical irradiation time course measured by photodetector and comparison with center temperature measured by infrared camera under 5 W cm−2 irradiation for 45 s.
Download figure:
Standard image High-resolution imageIn addition, by comparing the irradiation time history recorded by the photodetector with the temperature history measured by the infrared thermograph, the pyrolysis time and temperature of the sample can be determined more definitely. It can be ascertained from figure 4 that the pyrolysis time of materials determined by the photodetector and infrared thermograph is strictly unified.
Based on the measurement data obtained by the thermal imager and detector, the pyrolysis time and temperature of CF/EP under different power densities can be determined, and the amount of thermal radiation energy required for the initiation of pyrolysis of materials can be further determined, as shown in table 1. It can be seen that the pyrolysis time of CF/EP is related to the power density. However, the pyrolysis temperature is in the range of 340 °C–360 °C, which is basically consistent with the pyrolysis temperature of EP [15, 16]. In addition, the higher the power density, the lower the energy required for pyrolysis. The energy requirement results of this study were 166 and 147 J cm−2 in the cases of 4 and 6 W cm−2, respectively. The main reasons for the above results are the lower the power density, the longer the irradiation time required for pyrolysis, and the more significant the heat diffusion from the surface to the interior under thermal irradiation. In the subsequent calculation of the thermal response of materials, the internal temperature distribution of materials under different power densities will be further analyzed to verify the above inference.
Table 1. Pyrolysis time, temperature, and energy needed during the pyrolysis process irradiated by thermal radiation at different power densities.
| Power density (W cm−2) | Pyrolysis time (s) | Pyrolysis temperature (°C) | Energy needed during pyrolysis (J/cm2) |
|---|---|---|---|
| 4.0 | 41.4 | 354 | 166 |
| 5.0 | 30.2 | 344 | 151 |
| 6.0 | 24.6 | 360 | 147 |
3.3. Calculation model and parameters used for thermal response calculations
To further explore the irradiation process of CF/EP, the thermal response of CF/EP under thermal radiation was calculated by numerical simulation. The basic equation of the model is the Fourier heat conduction equation. Because CF/EP undergoes pyrolysis after heating, the chemical reaction process caused by pyrolysis should be considered in the equation. The basic form of the equation is as follows [11]:

where  is the solid density,
  is the solid thermal capacity,
  is the solid thermal conductivity,
  is the latent heat of decomposition,
  is the degree of decomposition of the material,
  is the density in the case of undecomposition,
  is the density in the case of complete decomposition; and B, n, and E are the pyrolysis parameters of the material.
We used the full-size model for calculation (10 cm × 10 cm × 3 mm) and the number of grid cells was 144,000, as shown in figure 5. The heat flow boundary condition of uniform irradiation was applied to the front surface of the material, while the natural convection boundary condition was applied to the back surface. Hence, the boundary conditions of the equation are as follows:

where A is the absorption coefficient for thermal radiation, which will be discussed later, I is the thermal radiation intensity, h is the convective heat transfer coefficient, and T0 is the ambient temperature.
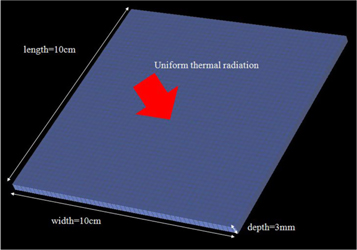
Figure 5. Diagram of the simulation model.
Download figure:
Standard image High-resolution imageMaterial parameters are the key factors affecting the accuracy of the numerical simulation. The required parameters in this calculation include the thermophysical parameters such as density, heat capacity, and thermal conductivity as well as the absorption coefficient of thermal radiation. The thermophysical parameters used for computing are listed in table 2. The density, thermal conductivity, and thermal capacity were taken from reference [16], and all of the other parameters listed were from a study performed by Dimitrienko [17].
Table 2. Thermophysical parameters used for computing.
| Property/parameter | value | Property/parameter | value |
|---|---|---|---|
 (kg m−3) (kg m−3) |
1700 |
 (kg/m3) (kg/m3) |
1255 |
 (W/(m·K)) (W/(m·K)) |
1.1 |
 ( W/(m·K)) ( W/(m·K)) |
0.4 |
 (J/(kg·K)) (J/(kg·K)) |
0.0452 T + 1080 |
 ( J/(kg·K)) ( J/(kg·K)) |
0.259 T + 1041 |
| B (s−1) | 2667 | E (kJ/kg) | 240 |
| n | 1 | H (kJ/kg) | 996 |
The absorption coefficient of thermal radiation plays an important role in the irradiation effect of materials, which can be obtained by the following equation:

where Aλ is the spectral absorption coefficient of wavelength, λ, and Dλ is the energy ratio of wavelength λ in the spectral interval,  which is determined by the actual spectral distribution of thermal radiation.
For monochromatic lasers, thermal radiation can be directly measured by experimental methods; for thermal radiation, which has a wide spectral range, on the one hand, the experimental measurement of the spectral absorption coefficient, Aλ, is difficult; on the other hand, Dλ, related to the irradiation source, is difficult to obtain. To this end, we attempt to obtain the thermal radiation absorption coefficient through parameter inversion and use more experimental data to verify the parameter.
3.4. Calculation results and analysis for thermal response
Because the absorption coefficient of thermal radiation cannot be obtained directly, the 4 W cm−2 irradiation experiment is considered as the benchmark to obtain the absorption coefficient of thermal radiation under the irradiation condition by the parameter inversion method. According to equation (3), under irradiation with the same light source (with the same spectrum), the absorption coefficient of thermal radiation should be equal. Therefore, the absorption coefficient is used to calculate the material effect under the irradiation of 5 W cm−2 and 6 W cm−2 to verify the results.
A detailed description of the parameter inversion method can be found in the study by Liu, et al [18]. According to the inversion results of the irradiation experiments at 30 s, 45 s, and 60 s, the thermal radiation absorption coefficient changes within the range of 0.85–0.90. Figure 6 presents the calculated and measured front surface temperatures with different absorption coefficients under 4 W cm−2. As can be seen from the figure, when the absorption coefficient is within the range of 0.85–0.90, the calculated temperature is relatively close to that of the measured. The average value (0.88) is taken as the optimal absorption coefficient of CF/EP under this irradiation condition.
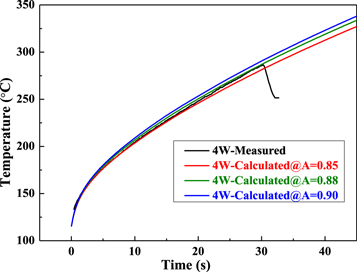
Figure 6. Calculated and measured front surface temperatures with different absorption coefficients and measured under 4 W cm−2.
Download figure:
Standard image High-resolution imageTo further confirm the thermal radiation absorption coefficient of the material, we compared the calculated results of the back-surface temperature with the measured data. The back-surface temperature was measured using a thermocouple with a total of 5 points marked by A, B, C, D, and O. The position distribution is shown in figure 7(a). Owing to the influence of material inhomogeneity (similar to the front surface temperature measurement), the temperature of each measuring point deviates. To reduce the data uncertainty, the center point of the back surface (marked by O) is taken as the standard, and the results are presented in figure 7(b). The obtained back surface temperature agrees with the experimental data when the thermal radiation absorption coefficient is 0.88, further indicating that for CF/EP, the thermal radiation absorption coefficient of 0.88 is reasonable.

Figure 7. (a) Spatial distribution of temperature measurement points on the back surface, (b) comparison between the measured data and the calculated results of the back surface.
Download figure:
Standard image High-resolution imageThe thermal radiation absorption coefficient of the material obtained above was used to calculate the 5 and 6 W cm−2 irradiation experiments. The calculated temperatures of the front and back surfaces were compared with the measured data, as shown in figures 8(a) and (b).
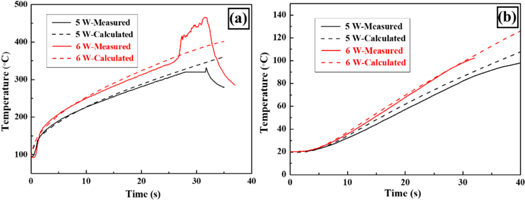
Figure 8. Comparison of the calculated and measured front and back surface temperatures when the absorption coefficient equals 0.88 under 5 and 6 W cm−2: (a) front-surface temperatures and (b) back-surface temperatures.
Download figure:
Standard image High-resolution imageIt can be seen that under irradiation with different power densities, the temperature history calculated by using the absorption coefficient is consistent with the experimental measurement, which verifies the credibility of the parameter and the calculation model. Combined with the calculation formula for the thermal radiation absorption coefficient, it can be considered that for CF/EP, the absorption coefficient is applicable under thermal radiation with the same or similar spectrum (light source temperature of approximately 1,200 °C) as was utilized for this experiment.
According to the analysis mentioned above, when the CF/EP is thermally irradiated with different power densities, a longer irradiation time could lead to a higher heat diffusion into the material interior, which results in an increase in the energy required for surface pyrolysis when the thermal radiation power density decreases. To quantitatively prove this, we compared the internal temperature distribution of samples at pyrolysis times shown in table 1 for 4, 5, and 6 W cm−2 irradiation. The cross-section temperature distribution and centerline temperature as depth are calculated using the model described above, and the obtained results are shown in figures 9(a) and (b), respectively.

Figure 9. Temperature distribution under 4, 5, and 6 W cm−2 at pyrolysis times shown in table 1: (a) Cross-section temperature distribution and (b) centerline temperature as depth.
Download figure:
Standard image High-resolution imageIt can be observed from figure 9(a) that the transverse temperature of the material is generally uniform under uniform thermal irradiation. Along the longitudinal direction (the thickness of the material), the temperature gradually decreases from the front surface to the back. The temperature of the front surface is significantly higher than that of the back surface, which is caused by the low thermal conductivity of the CF/EP. At the pyrolysis time of the materials, the high-temperature zone (about 330 °C) in the material under 4 W cm−2 irradiation was larger than the zones at 5 and 6 W cm−2, while the low-temperature zone was relatively small. This is caused by long-time heat transmission. When the power density is set at 4 W cm−2, it takes 41.4 s for the pyrolysis of CF/EP. The long-time irradiation process results in continuous heat transmission inside the composite, leading to a larger temperature zone. According to the centerline temperature as depth shown in figure 9(b), it is obvious that the internal temperature of the material is higher for 4 W cm−2 than 5 and 6 W cm−2, indicating that more heat diffuses into the interior.
In addition, according to the degree of decomposition of the material (f), the chemical decomposition depth of CF/EP can also be calculated. Figure 10 is the degree of decomposition along the direction of thickness of CF/EP irradiated at different power densities for 30 s. With the increase of power density from 4 W cm−2 to 6 W cm−2, the degree of decomposition in the surface of samples also shows increasing trend. When the power density reaches to 6 W cm−2, the decomposition thickness is around 0.7 mm. Although the degree of decomposition is pretty low (less than 0.5%), the relatively high decomposition thickness indicates that thermal radiation has caused an obvious effect on CF/EP.

Figure 10. Degree of decomposition along the thickness direction of CF/EP.
Download figure:
Standard image High-resolution image3.5. Calculation model and parameters used for mechanical properties
When the temperature of CF/EP keeps increasing during thermal radiation, the thermal stress could be formed because of the non-uniform temperature fields. In order to analysis the mechanical property changes of CF/EP caused by thermal radiation, the stress distribution was calculated through thermal decoupling method. Firstly, the temperature distribution of CF/EP can be obtained according to the aforementioned calculation method. The mechanics equilibrium equation can be solved by combining the temperature distribution results and mechanical parameters of CF/EP. Then, the thermal stress distribution can be obtained.
The mechanics equilibrium equation is as follows [19, 20]:

where σi (i = x, y, z) is the stress in different directions. τ is the tangential stress. fi (i = x, y, z) is the body force. In the case of no body force, f = 0. In the range of elastic deformation, the relation between stress and strain is as follows:

where E is the elasticity modulus, v is the Poisson's ratio, and a is the coefficient of thermal expansion. In this thermal radiation experiment of CF/EP, the elasticity modulus (E) is 21 * e9. The Poisson's ratio (v) is 0.3. The coefficient of thermal expansion (a) is 2.0 * e−6 [2, 21].
3.6. Calculation results and analysis for mechanical properties
According to the calculation method mentioned above, the calculated thermal stress distribution results of CF/EP irradiated at 4 W cm−2, 5 W cm−2, and 6 W cm−2 for 30 s are shown in figures 11(a)–(c) respectively. Due to the uniform thermal radiation, the thermal stress distributes relatively uniform in the surface of CF/EP, and it gradually decreases along the thickness direction. When the power density is 4 W cm−2, the stress is around 1.6 MPa. With the power density increased to 6 W cm−2, the stress is increased to around 3.2 MPa. By comparing with the strength of CF/EP itself, the thermal stress is not so high that could cause obvious mechanical damage to CF/EP.

Figure 11. Stress distribution results of CF/EP irradiated at different power densities for 30 s: (a) 4 W cm−2, (b) 5 W cm−2, and (c) 6 W cm−2.
Download figure:
Standard image High-resolution image
According to the aforementioned experimental and numerical simulation results, the power density directly affects the damage behavior of CF/EP. A higher power density could result in the pyrolysis of CF/EP in a shorter time. However, a low power density and long-time irradiation could also result in severe damage to the composites. In addition, when pyrolysis occurs, the sample irradiated at a low power density for a long time shows a higher inside temperature of the composite than that of the sample irradiated at high power density for a short time. The temperature and mechanical property evolution on the surface and inside of the composites plays a significant role in understanding the specific damage process of CF/EP.
4. Conclusions
Based on the radiation platform of the thermal radiation source, experiments were designed and performed on the thermal response of CF/EP under different power density thermal radiations, and key parameters such as material temperature and pyrolysis process were detected. Under the thermal radiation intensities of 4–6 W cm−2, the surface of CF/EP exhibits obvious thermal decomposition, and the time and energy required for pyrolysis gradually decrease with the increase in power density. On this basis, the thermal radiation absorption coefficient of CF/EP is deduced by the numerical simulation method, and the calculation shows that when the absorption coefficient is 0.88, the material temperature, calculated under different power densities, is in concurrence with the experimental results. When the CF/EP is irradiated at 6 W cm−2 for 30 s, the decomposition thickness reaches to 0.7 mm, and the stress in the surface of the composites is increased to 3.2 MPa. This study provides a threshold value for CF/EP under thermal radiation and a significant reference to polymer matrix composites when these composites are used in extreme environments exposed to strong thermal radiation [22].