

Abstract
The 0.1C-18Cr-1Al-1Si ferritic heat-resistant stainless steel has attracted considerable attention to high-temperature applications due to its favorable combination of creep and oxidation resistance. In this paper, the microstructural evolution and precipitation behavior of the 0.1C-18Cr-1Al-1Si ferritic heat-resistant stainless steel is studied from the compression deformation data in the temperature range of 850 °C–1050 °C and the strain rate range of 0.01–1 s−1. Experimental results demonstrate that higher temperatures and lower strain rates enhance the dynamic recrystallization (DRX) process with remarkable effectiveness. The main precipitates are proved as the AlN phases and the (Cr,Fe)23C6 carbides during hot deformation. With an increase in the deformation temperature, the size of (Cr,Fe)23C6 and AlN gradually increases, and volume fraction gradually decreases. When the strain rate decreases, the average size and volume fraction of (Cr,Fe)23C6 and AlN gradually increase. At the lower temperatures, the occurrence of dynamic recrystallization (DRX) is strongly influenced by (Cr,Fe)23C6 formed on the grain boundaries, mainly because it causes a pinning effect, which hinders the movement of dislocations and delays the occurrence of the DRX.
Export citation and abstract BibTeX RIS

Original content from this work may be used under the terms of the Creative Commons Attribution 4.0 licence. Any further distribution of this work must maintain attribution to the author(s) and the title of the work, journal citation and DOI.
1. Introduction
Ferritic heat-resistant steel (FHSS) has been widely used in high-temperature heat-generating units due to its high thermal conductivity, low coefficient of linear expansion, and low cost [1–3]. The 0.1C-18Cr-1Al-1Si FHSS is a strong candidate for the high-temperature application, which is related to the formation of uniform Cr2O3 and Al2O3 scales on its surface to improve the oxidation resistance [4]. However, the problem with increasing Cr content and adding Al is that this can lead to a formation of the M23C6-type (M = Cr and Fe) carbides and AlN precipitates, the coarsening rate of which will accelerate at high temperatures and in turn significantly affect the changes in mechanical properties during hot deformation [5–8]. FHSS exhibits the poor formability and abnormal grain coarsening at high temperatures [9, 10]. Therefore, controlling the precipitates and hindering the grain growth is very significant for improving product properties. Furthermore, precipitates and grain size are greatly affected by processing parameters during hot deformation [11, 12]. Therefore, investigation of deformation temperatures, as well as the strain rate, is of vital importance.
Some studies related to the 0.1C-18Cr-1Al-1Si FHSS have focused primarily on improving the oxidation resistance [4, 13]. However, microstructural evolution and precipitation behavior during the hot deformation process has received little attention. Furthermore, the state of the Al element and its effect on hot deformation behavior in the steel is unclear. Thus, this work focuses on the analysis of microstructural evolution and precipitation behavior of the 0.1C-18Cr-1Al-1Si FHSS, aiming to enhance the final product quality for clarifying hot-rolling schedules.
2. Materials and experiments
The experimental steel used in this work was a 200-kg ingot. The ingot was heated to 1200 °C for 60 min and then hot rolled into a plate of 12 mm thickness. The chemical composition (in wt%) of the 0.1C-18Cr-1Al-1Si FHSS was determined by optical emission spectroscopy, as listed in table 1. The specimens for hot compression were cut from the hot-rolled plate and processed into cylindrical specimens of Φ10 mm × 15 mm. The microstructure before hot deformation is presented in figure 1(a), the average grain size was 127.3 μm as measured by the Image J software, and some precipitates were distributed on the grain boundaries or within the grains. A hot compression test was performed employing a Gleeble3800 thermal-mechanical simulator. The hot compression experiment process is shown in figure 1(b). First, the specimens were heated in order to homogenize the microstructure at a rate of 20 °C s−1 to 1200 °C for 5 min. Second, they were cooled to the desired deformation temperature at a cooling rate of 10 °C s−1 and kept for 20 s to achieve a uniform temperature. Third, the deformation was conducted at 850 °C–1050 °C to a true strain of 0.8, using a strain rate range of 0.01 to 1 s−1. After deformation, the specimens were instantly quenched by water. The quenched specimens intended for analysis were cut into two halves along the direction of the compression axis. After being mechanically polished and etched with 5 g Cu2SO4 + 20 ml HCl + 20 ml H2O, their analysis was carried out by an optical microscope (OM) and a scanning electron microscopy (SEM). The metal film for a transmission electron microscope (TEM) was selected from the same position as OM and SEM, and after being mechanically polished, twin-jet electropolishing was conducted in 8% perchloric acid and 92% acetic acid. An equilibrium phase diagram and precipitation behavior of the investigated steel were predicted by the Thermo-Calc software and the TCFe8 database.
Table 1. Chemical composition of the steel used in the study (wt%).
| C | Si | Mn | P | S | Cr | Al | N | Fe |
|---|---|---|---|---|---|---|---|---|
| 0.09 | 1.01 | 0.89 | 0.007 | 0.005 | 18.02 | 0.98 | 0.0122 | Bal. |

Figure 1. (a) Optical microstructure before hot deformation and (b) process of hot compression experiment.
Download figure:
Standard image High-resolution image3. Results and discussion
3.1. Thermodynamic analysis
The equilibrium phase diagram of the 0.1C-18Cr-1Al-1Si FHSS is represented in figure 2(a). As can be seen, the microstructure is ferritic at 850 °C–1050 °C, and there is no phase transformation. Moreover, the possible precipitates at this temperature range are the AlN phase and the M23C6 carbide. The element contents of the AlN phase and the M23C6 carbide are presented in figures 2(b) and (c). The AlN phase contains N and Al elements, and no change occurs with a decrease in temperature. The M23C6 carbide contains Fe, Cr, C, and Mn, and with a decrease in temperature, the content of Cr and C gradually increases, Fe content gradually decreases, and Mn content has no change.
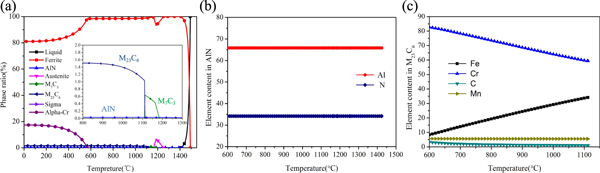
Figure 2. (a) The equilibrium phase diagram of 0.1C-18Cr-1Al-1Si FHSS calculated by Thermo-Calc software; (b) elements content in AlN; (c) elements content in M23C6.
Download figure:
Standard image High-resolution imageIt can be predicted that the 0.1C-18Cr-1Al-1Si FHSS will form the AlN phase and the M23C6 carbide in the temperature range of 850 °C–1050 °C, and this can provide a reference for identifying the precipitates during hot deformation.
3.2. Experimental flow curves
The flow curves of the 0.1C-18Cr-1Al-1Si FHSS under different strain rates are exhibited in figure 3. At a strain of 0.05, with an increase in the deformation temperature and a decrease in the strain rate, the flow stress gradually reduces. This can be explained by the fact that higher temperatures or lower strain rates can provide high dislocation mobility and promote the dislocation annihilation, nucleation, and the growth of new grains [14–16]. Moreover, when the strain rate is 1 s−1, the flow curve appears to have a single peak and then tends to hold steady at 1050 °C, which shows the characteristics of dynamic recrystallization (DRX) [17]. However, the flow curves show no peak stresses at 850 °C and 950 °C, which exhibits the characteristics of the dynamic recovery (DRV) [18]. At various deformation temperatures with 0.1 s−1, the flow curves show signs of the occurrence of DRX. It is worth noting that the flow curves are characterized by waving shapes at 0.01 s−1. This is due either to machine compliance or to a high rate of data acquisition.
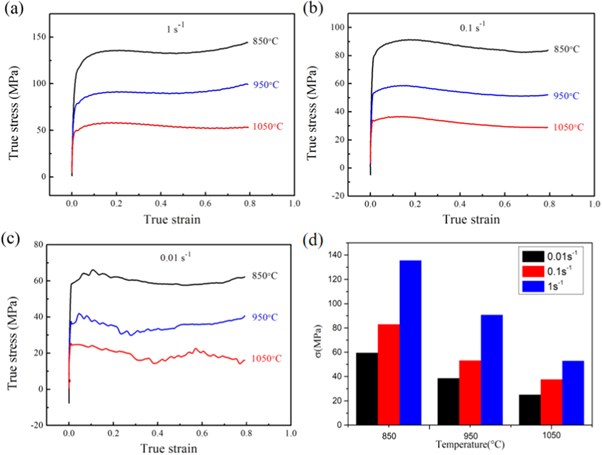
Figure 3. The flow curves of 0.1C-18Cr-1Al-1Si FHSS at the stain rate of (a) 1 s−1; (b) 0.1 s−1;(c) 0.01 s−1 ; and (d) variation of flow stress(σ) at the strain of 0.05 under different temperatures.
Download figure:
Standard image High-resolution imageDuring hot deformation, the dominant softening mechanisms of the 0.1C-18Cr-1Al-1Si FHSS are DRV and DRX, and this is consistent with other materials [19–22]. Furthermore, DRX of the 0.1C-18Cr-1Al-1Si FHSS is greatly affected by the strain rate and the deformation temperature. DRX is more likely to occur in the condition of a lower strain rate and a higher deformation temperature.
3.3. Determination of critical condition for initiation of DRX
A critical condition for the DRX initiation can be determined based on the results of the flow curves that can explain the DRX kinetics. Usually, the critical stress can be determined by the work-hardening rate (θ = dσ/dε) versus the flow stress plots, and the corresponding strain of critical stress is considered to be the critical strain [23].
Figure 4(a) shows the relationship between the work-hardening rate and the true stress plots at 1050 °C/0.1 s−1. In figure 4(a), σc, σp, σsat, and σss are represent critical stress, peak stress, saturation value, and steady-state stress, respectively. From figure 4(b), it can be seen that the θ-σ plot is divided into three domains: the hardening domain, the hardening + DRX domain, and the DRX domain. It can be noticed that the hardening + DRX domain decreases with a decrease in the strain rate.
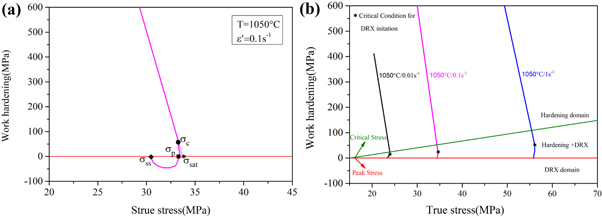
Figure 4. (a) The θ-σ plot obtained by flow curves to determine the various stress and (b) θ-σ plot obtained at 1050 °C with various stain rate.
Download figure:
Standard image High-resolution imageTable 2 shows that εc increases with a decrease of the deformation temperature or an increase of the strain rate, which indicates that increasing the deformation temperature or reducing the strain rate is beneficial to the occurrence of DRX. This happens mainly because as the deformation temperature increases, the grain boundaries and dislocations are more likely to migrate. This promotes the occurrence of the DRX, resulting in a decrease of the critical strain. With an increase in the strain rate, the deformation time decreases, leading to a serious plugging of dislocations and an increase in the dislocation density. At the same time, since there is not enough time to evolve and rearrange, critical strain increases.
Table 2. Values of σc, σp, σsat, and σss under different deformation conditions.
| Conditions | σc/MPa | σsat/MPa | σss/MPa | εc |
|---|---|---|---|---|
| 850 °C/0.01 s−1 | 64.8 | 73.2 | 58.1 | 0.18 |
| 950 °C/0.01 s−1 | 42.1 | 47.2 | 34.0 | 0.04 |
| 1050 °C/0.01 s−1 | 24.8 | 28.6 | 15.9 | 0.02 |
| 1050 °C/0.1 s−1 | 34.7 | 34.3 | 30.6 | 0.03 |
| 1050 °C/1 s−1 | 56.5 | 68.3 | 55.2 | 0.06 |
3.4. Establishment of the DRX fraction model
The method of Avrami analysis is a standard way to describe the given deformation temperature and strain rate [23–27]. In this paper, the DRX process was analyzed using a new method proposed by Jonas et al that divides the experimental flow curve into the DRX and the DRV curves, as shown in figure 5. The point corresponding to σc and εc represents the DRX nucleation initiates. At the same time, it also denotes the point where the deviation between the DRX curve and the DRV curve begins [23]. The point corresponding to σp and εp is the peak stress and peak strain, after which softening begins to increase. The σss is a steady-state value under the DRX condition, and the σsat is a saturation value under the DRV condition.

Figure 5. The DRX and DRV curves of stress and strain.
Download figure:
Standard image High-resolution imageWork-hardening is a function of the dislocation density ρ and strain ε, which is calculated as follows [28]:

where h is the athermal work-hardening rate, and r is the DRV rate. According to equation (1), the flow equation corresponding to the DRV can be derived as follows [27]:

The equation (2) can be further simplified as the following relation:

where σ0 is the yield stress at the strain of 0.02. The values of r and σsat can be obtained by the slope and intercept of σθ versus σ2 curve.
The difference between the recovery curve and the DRX curve is identified as Δσs (shown in figure 5) and it is considered to be the net softening needed to be applied directly in order to achieve DRX. The fractional softening of DRX (X) can be expressed as follows [23]:

The maximum value of Δσs is σsat − σss, where X = 1, which indicates the material has fully-formed DRX grains.
The Avrami analysis for static recrystallization (SRX) can be expressed as follows [27]:

where X is the recrystallized fraction, k and n are the Avrami constant and the time exponent, respectively. t50 is characteristic time, which represents the time needed to reach a 50% recrystallization volume fraction. It is described as follows [27]:

where A represents the experimental constant, d0 is the grain size, and p, q, and v are the stain exponent, the strain rate, and the grain size, respectively. QSRX is the activation energy, and R is the gas constant. Equations (5) and (6) can be applied well to DRX by replacing time exponent (n) and activation energy (QSRX).
The DRX fraction at various strains can be calculated using equations (4)–(6) [23]. Figure 6 expresses the DRX fraction calculated under various conditions. It is evident that as the deformation temperature increases or the strain rate decreases, DRX fraction (X) increases. The intersection between the DRX fraction (X) curve and the x-axis is the critical strain (σp). At the same deformation temperature or strain rate, the intersection point increases with an increase of the strain rate or a decrease of the deformation temperature, which is consistent with the above-mentioned change of the critical strain as it relates to the deformation temperature and the strain rate.
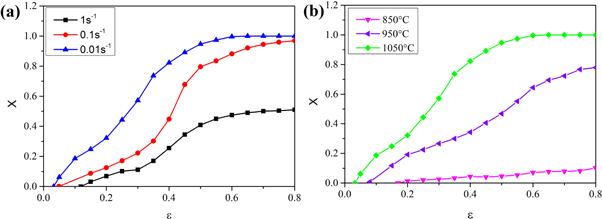
Figure 6. The DRX fraction (X) change with ε at (a) 1050 °C with various strain rates; (b) 0.01 s−1 with various deformation temperatures.
Download figure:
Standard image High-resolution image3.5. Microstructural evolution
The microstructure of the 0.1C-18Cr-1Al-1Si FHSS under different deformation conditions is presented in figure 7. It reveals that the deformation temperatures have great effect on the microstructure of the 0.1C-18Cr-1Al-1Si FHSS after hot compression. For instance, at 0.01 s−1/850 °C, the original coarse ferrite grains are subjected to axial compression and are clearly elongated along the direction of the vertical compression. Moreover, some grain boundaries appear to have jagged features which is a sign of the early stages of the DRX [29], indicating that the DRV is the primary softening mechanism under this condition. At 0.01 s−1/950 °C, partial fine DRXed grains occur near the ferrite grain boundaries (elliptical area in figure 7(b)). Thus, the DRX is not sufficient under this condition, and partial DRX or DRV is the softening mechanism. When the deformation temperature is further increased (0.01 s−1/1050 °C), the initial ferrite grains gradually transform into equiaxed recrystallized grains, which suggests that the DRX is complete. Therefore, it can be concluded that the dominant softening mode at 850 °C is DRV and that partial DRX occurs at 950 °C. A further increase in the deformation temperature can achieve a complete DRX.
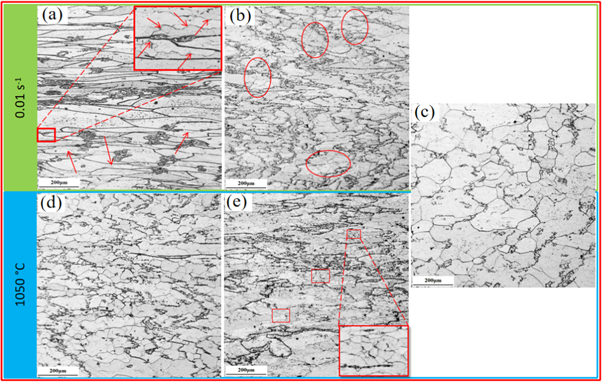
Figure 7. Microstructure of the 0.1C−18Cr−1Al−1Si FHSS deformed under different deformation conditions: (a) 0.01 s−1/850 °C; (b) 0.01 s−1/950 °C; (c) 0.01 s−1/1050 °C; (d) 1050 °C/0.1 s−1;and (e) 1050 °C/1 s−1.
Download figure:
Standard image High-resolution imageThe strain rates also have a significant effect on the microstructure of the 0.1C-18Cr-1Al-1Si FHSS after hot compression. For example, at a higher deformation rate, such as 1 s−1 (figure 7(e)), many fine recrystallized grains (rectangle region) appear inside the local grain, indicating that the softening mechanism is mainly DRX. As the strain rate decreases to 0.1 s−1 (figure 7(d)), numerous recrystallized structures can be seen, which indicates that DRX has occurred. When the deformation rate is 0.01 s−1 (figure 7(c)), the recrystallization is completed and the volume fraction of the DRXed grain is dramatically enlarged. It is generally accepted that DRX is a rate-controlled process that is carried out by grain boundary migration. Therefore, the strain rate has a great influence on the nucleation and growth of DRX. Compared with the higher strain rate, the diffusion process of the grain boundary can be fully carried out at a lower strain rate, which can prolong the incubation period of DRX and has sufficient time for DRX nucleation and growth [30].
Figure 8 shows that the strain rate and deformation temperature have a significant influence on the DRX fraction and the DRX grain size. The DRX fraction and grain size increase rapidly with an increase in the deformation temperature and a decrease in the strain rate. At 0.01 s−1/850 °C, the DRX fraction is about 10%, and the DRX grain size is about 16 μm. While at 0.01 s−1/1050 °C, the DRX fraction is about 100%, and the DRX grain size is about 75 μm. An increase in the deformation temperature can provide more thermal energy for grain boundary migration and accelerate the DRX process [31].

Figure 8. Plots of (a) DRX fraction and (b) DRX grain size at various strain rate and deformation temperatures.
Download figure:
Standard image High-resolution image3.6. Precipitate characteristics during hot deformation
Figure 9 provides the evolution of precipitates under different hot deformation conditions. All of the precipitates can be observed on the initial ferrite grain boundaries or within the grains. According to the volume fraction and average size of the precipitates, as measured by the Image J software (shown in figure 10), the characteristics of the precipitates formed during hot deformation are closely associated with the deformation temperature and the strain rate. As the deformation temperature increases, the volume fraction of the precipitates gradually reduces, while the average size of the precipitates gradually increases.

Figure 9. The evolution of precipitates under different hot deformation conditions.
Download figure:
Standard image High-resolution image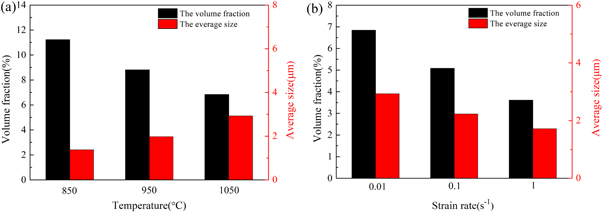
Figure 10. Volume fraction and average grain size of precipitates under various conditions (a)strain rate 0.01 s−1; (b)deformation temperature 1050 °C.
Download figure:
Standard image High-resolution imageThe SEM morphology and EDS analysis of the precipitates at 950 °C/0.1 s−1 and 1050 °C/0.1 s−1 are presented in figure 11. It can be seen from figure 11(a) that a polygonal precipitate sized about 5 μm (marked A) forms on the grain boundary. The strip-shaped or block-shaped precipitates (marked B and C) form within the grains or on the grain boundaries. The EDS result of the polygonal precipitate indicates that it is rich in N and Al, as well as small amounts of C, Cr, and Fe. The strip-shaped or block-shaped precipitates are found to be rich in C, Cr, Fe, and contain a small amount of Mn. Similarly, at 1050 °C (figure 11(b)), the polygonal precipitate (marked D), which consists of N, Al, and small amounts of C, Cr, and Fe forms on the grain boundary. The precipitates marked E and F consist of C, Cr, and Fe, and a small amount of Mn. So it can be safely stated that the A and D precipitates are the same, while the B, C, E, and F precipitates are also the same.
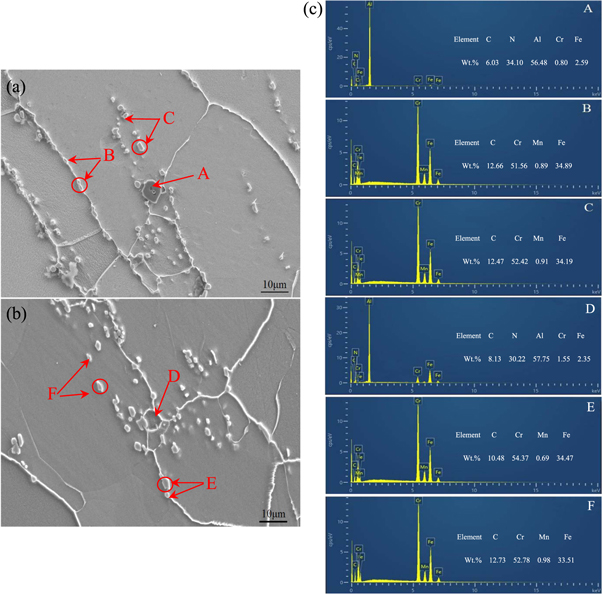
Figure 11. SEM images and EDS analyses of precipitates (a) 950 °C and 0.1 s−1; (b) 1050 °C and 0.1 s−1; (c) EDS analysis of (a) and (b).
Download figure:
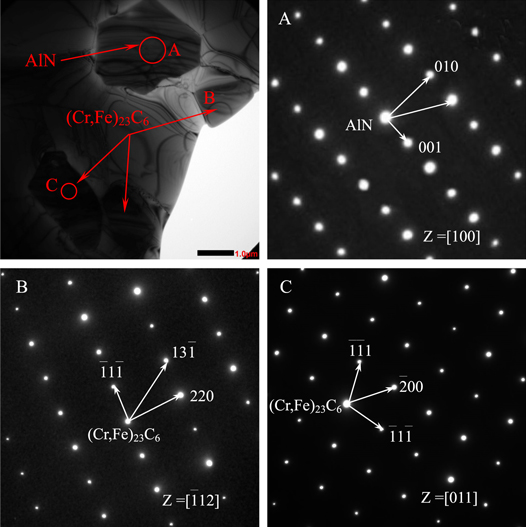
Standard image High-resolution imageTo confirm the type of precipitates more accurately, the precipitates were analyzed by TEM. Typical SAED (selected area electron diffraction ) patterns (shown in figure 12) were demarcated to determine the crystal structure of the precipitates. As shown in figure 12, the size of the polygonal precipitate (marked A) is about 5 μm. Analysis of the polygonal precipitate using the SAED pattern with Z = [100] suggests that it is the AlN phase. Combining this with the analysis of EDS of SEM and the result of the SAED patterns analysis, we can confirm that the polygonal precipitate that formed on the ferrite grain boundary is an AlN phase, which is in agreement with the previous reports [32, 33]. The size of the strip-shaped or block-shaped precipitates (marked B and C) is about 1.2–2 μm. Analyses of the SAED patterns of B and C are indexed to a complex FCC structure in [ 12] and [011] zone axes, respectively. Combined with the analysis of EDS of SEM and the SAED patterns, it can be determined that the strip-shaped or block-shaped precipitates formed within the grains or on the grain boundaries are (Cr,Fe)23C6 which is consistent with other literature reports [34–36]. Analysis of the results of the precipitates is consistent with the thermodynamic prediction by Thermo-Calc software.
Figure 12. TEM image and SAED patterns of precipitates at 1050 °C and 0.1 s−1.
Download figure:
Standard image High-resolution image
It is evident that the AlN phases form on grain boundaries, and the (Cr,Fe)23C6 carbides form inside the grains or on the grain boundaries. With an increase in the deformation temperature, the average size of (Cr,Fe)23C6 and AlN gradually increases, and volume fraction gradually decreases, while with a decrease in the strain rate, the size and volume fraction of (Cr,Fe)23C6 and AlN gradually increase. In addition, the strip-shaped or block-shaped precipitates formed on the grain boundaries are identified as (Cr,Fe)23C6 carbides, and their volume fraction gradually decreases with an increase in the temperature (figure 10).
Compared with the higher temperature, the diffusion rate and growth rate are relatively low at lower temperatures, which is not conducive to the growth of (Cr,Fe)23C6 and AlN, so their average grain size remains small [37]. Moreover, the softening mechanism at a lower temperature is mainly DRV, and the large dislocation density provides a more effective nucleation site for deformation-induced precipitation and promotes the formation of (Cr,Fe)23C6 and AlN [38]. In addition, at a set deformation temperature, with a decrease in the strain rate, the volume fraction and average size of (Cr,Fe)23C6 and AlN increase. It can be inferred that a low strain rate can supply sufficient time for the formation and growth of (Cr,Fe)23C6 and AlN [39].
Based on the analysis in section 3.5 (figure 7), at low temperatures the softening mechanism is DRV, and DRX gradually occurs with an increase in the deformation temperature. At lower temperatures, the occurrence of dynamic recrystallization (DRX) is strongly influenced by (Cr,Fe)23C6 formed on the grain boundaries. This happens because the formation of (Cr,Fe)23C6 leads to the pinning effect on the grain boundaries, thereby preventing the movement of dislocations and delaying the occurrence of DRX [40].
4. Conclusion
The hot compression of the 0.1C-18Cr-1Al-1Si FHSS was investigated in the temperature range of 850 °C–1050 °C and a strain rate ranging from 0.01 to 1 s−1. During hot deformation, the microstructural evolutions and precipitation behaviors were systematically investigated, providing a reference for enhancing the final product quality of this steel. The conclusions drawn are as follows:
- 1.The strain rate and temperature have a significant influence on the DRX of 0.1C-18Cr-1Al-1Si FHSS. DRX is more likely to occur under a lower strain rate and higher deformation temperature.
- 2.DRV is the dominant softening mechanism at 850 °C/0.01 s−1. Partial DRX occurs at 950 °C/0.01 s−1. Further increase in the deformation temperature can achieve complete DRX. The DRX fraction and DRX grain size increase rapidly with an increase in the deformation temperature and a decrease in the strain rate.
- 3.The main precipitates of the 0.1C-18Cr-1Al-1Si FHSS are proved as the AlN phases and the (Cr,Fe)23C6 carbides during hot deformation, which is consistent with the thermodynamic prediction by Thermo-Calc software. The AlN form on the grain boundaries and the (Cr,Fe)23C6 form on the grain boundaries or within the grains.
- 4.With an increase in the deformation temperature, the average size of the (Cr,Fe)23C6 carbides and the AlN phase gradually increase, while the volume fraction gradually decreases. With a decrease of strain rate, the size and volume fraction of the (Cr,Fe)23C6 carbides and the AlN phase gradually increase.
- 5.At the lower temperatures, the occurrence of the dynamic recrystallization (DRX) is strongly influenced by (Cr,Fe)23C6 formed on the grain boundaries, which leads to a pinning effect on the grain boundaries, which in turn prevents the movement of dislocations and delays the occurrence of the DRX.
Funding
The authors acknowledge support of this work by the National Natural Science Foundation of China (51774226), the Scientific Research Program of Shaanxi Education Department (17JF013), the Key Program of Shaanxi Province (2018ZDXM-GY-149), the Major Program of Science and Technology in Shanxi Province (No. 20181101016), and the Major Program of Science and Technology in Shanxi Province (No. 20191102006:3).
Conflicts of interest
The authors declare no conflict of interest.