
Abstract
In this work, we report the structural, optical and magnetic properties of Co doped ZnO thin films fabricated by nebulizer spray pyrolysis technique. Five different thin films were fabricated with various doping concentration of cobalt. These thin films posses hexagonal wurtzite structure with polycrystalline nature and strongly oriented along with (002) and (101) direction. From x-ray diffraction pattern, average crystallite sizes were calculated and are found to be decreases with Co doping concentration. The dislocation density and microstrain values of the coated films increased gradually with doping concentration. The SEM/AFM studies reveal the change from spherical shape to petal shaped grains and it is also found that the size of grains and roughness decreases with Co increasing doping concentration. The lowering of the optical band gap energy from ∼ 3.24 eV to 3.05 eV shows doping by Co in ZnO gives rise to band gap bowing in ZnO:Co thin films. The M-H curve confirms the god ferromagnetism in Co doped ZnO thin films.
Export citation and abstract BibTeX RIS

Original content from this work may be used under the terms of the Creative Commons Attribution 4.0 licence. Any further distribution of this work must maintain attribution to the author(s) and the title of the work, journal citation and DOI.
1. Introduction
Metal-oxide semiconductors such as ZnO, CdO, MnO, SnO2 plays major role in various technological research fields especially in solar cell, gas sensors and spintronics. Dilute magnetic semiconductors (DMS) are of great interest for its ferromagnetic property to be used in spintronic devices [1, 2]. Ferromagnetic Curie temperatures of the III–V DMS materials are very low compared to other semiconductors, for practical applications [3]. Zinc Oxide (ZnO) semiconductor material has a wide and direct band gap (3.37 eV) which can manipulate the spin external magnetic field. Here, the motivation of present work is to prepare room temperature ferromagnetism (RTFM) for spintronic devices. Among the various metal oxides, doped ZnO system exposed good magnetic properties at room-temperature [4]. Pure ZnO material have much intrinsic defects so, when transition metal is doped with ZnO structure it could alter the intrinsic defects levels which helps to enhance the magnetic properties of spintronics as well as for gas sensing applications. ZnO posses magnetic properties with influence of cobalt ions (Co), so ZnO:Co DMS can act as a ferromagnetic at room temperature [5]. The transition metal ions like Mn [6], Ni [7] and Co [8] were doped with ZnO thin films and were analyzed via RTFM previously. ZnO systems can be improved by doping cobalt due to its abundant electron- states and high solubility. Hence spintronics has been realized and it is to be used in sensors, photonics and piezoelectric areas [9, 10]. Some applications of spintronic devices are magnetic sensors, storage devices [11] and quantum computing applications [12]. The physical aspects of spintronics were used in tunnel magnetoresistance [13] and in huge magnetoresistance [14]. Hard disk drives make use of the objectives of spintronics in commercial form.
Recently, different chemical and physical techniques were utilized to prepare thin films and are follows: Successive Ionic Layer Adsorption and Reaction (SILAR) [15], chemical bath deposition [16], molecular-beam epitaxy [17], liquid phase evaporation deposition, sol–gel coating [18], hydrothermal [19], magnetron sputtering [20], pulsed laser deposition [21], chemical vapor deposition [22] and spray pyrolysis [23] etc Nebulizer spray pyrolysis attracted amid of other methods because of its novelty. Further it provides high purity film with uniform arrangement of atoms on the film surface. Moreover various parameters such as film thickness, rate of deposition, morphology and size of the particle can be controlled easily for the deposition of large area. Recently, fabrication of Fe- doped zinc oxide thin films on a glass substrate using sol-gel spin coating technique was done by Verma et al [24]. Al doping effects on the properties of the ZnO and AZO thin films prepared by RF sputtering technique were also investigated [25]. However, no report is available on the deposition of ZnO:Co thin films by nebulizer spray pyrolysis method. In this work ZnO:Co thin films on glass substrate were deposited by varying concentration of Co ions by nebulizer spray pyrolysis method for the first time. The structural, optical, morphological and magnetic properties of ZnO:Co thin films were systematically investigated.
2. Experimental details
2.1. Depositionof ZnO films
Analytical grade Zinc Acetate dihydrate (Zn (CH3COO)2.2H2O) and Cobalt Chloride Hexahydrate [CoCl2.6H2O] were used as the starting material of zinc and cobalt respectively to prepare the ZnO:Co thin films on glass substrate (borosilicate) using nebulizer spray pyrolysis method. 0.2 M of Zinc Acetate dissolved in 10 ml of de-ionized water for zinc source. Here during the fabrication of all thin film, the temperature of the substrate is maintained at 450 °C (±5 °C). To produce aerosol particles, the compressed air in nebulizer spray technique was used which act as gas carrier. The pressure of the compressed air was maintained at 1.5 mega pascal (Mpa). The distance between spray nozzle and substrate was maintained at 5cm. The doping concentration of cobalt ions was varied in terms of 1%, 3%, 5% and 7%. Table 1 gives the experimental parameters used for the preparation of Co doped with ZnO thin films. Figure 1 shows that the photographic images of coated ZnO:Co thin films. These images indicate that on increasing the doping concentration of Co from 1% to 7% the colour of the film changes from white to dark green in comparison with the undoped film.
Table 1. Deposition Parameters for Co doped ZnO thin films.
| Source material | Zinc Acetate dihydrate (Zn(CH3COO)2.2H2O), Cobalt chloride Hexahydrate [CoCl2.6H2O] |
|---|---|
| Molar concentration | 0.2M |
| Substrate | Glass |
| Temperature | 450 °C (±5 °C) |
| Pressure | 1.5 mega pascal (Mpa) |
| Nozzle to substrate distance | 50 mm |
| Cobalt doping (%) | 0%, 1%, 3%, 5% and 7% |

Figure 1. Photograph Image of ZnO:Co thin films with various Co doping (%).
Download figure:
Standard image High-resolution imageX-ray diffractometer having a CuKa radiation source with a wavelength λ = 1.5418 Å is used to study the thin film in the range of 10–80° using PAN analytical X' Pert Pro instrument. SEM analysis provided the morphology of thin film layers and was analyzed using the model EVO 18 ZEISS. The surface topography and roughness of the films were analyzed using an atomic force microscopy (AFM). The thickness of the sample was analyzed using Stylus profilometer (MitutoyoSJ-301). Transmittance, reflectance and absorption of the thin films were studied by a double-beam Lambda Perkin Elmer UV–vis NIR spectrophotometer in the wavelength range of 300 nm-1100 nm. The magnetization measurement was performed using Lakeshore 7407 vibrating sample magnetometer for the prepared ZnO:Co thin films.
3. Results and discussion
3.1. X-ray diffraction analysis
Figure 2 illustrates the XRD patterns of pristine ZnO and ZnO:Co films. The percentage of dopant concentrations were varied upto 7%. ZnO and ZnO:Co films exhibited polycrystalline nature with multiple peaks along (1 0 0), (0 0 2), (1 0 1), (1 0 2), (1 1 0), (1 0 3), (2 0 1) and (0 0 4) planes associated with hexagonal wurtzite crystal structure. The observed speaks have good correlation with the JCPDS file :89–0510. In all XRD patterns, the (002) and (101) peaks were dominant in which (002) plane intensity is higher than the other planes. XRD pattern and EDX clearly indicates the incorporation of cobalt ion into the ZnO lattice structure as substitutional atom. The x-ray pattern shows that the diffracted peaks intensity reduces with increase in Co doping level. This may be due to the inclusion of Co ions can be substitutionally incorporated into the ZnO lattice; consequently the ZnO host lattice orientation could be reduced. In addition, the different ionic radius of Co and Zn can be created some lattice imperfections resulting the peak intensity was decreased. The effect of cobalt incorporation into ZnO, results lowering of intensity and in phase of FWHM as shown in figure 2. XRD patterns were in good agreement with the available literature of ZnO:Co films deposited by ultrasonic spray pyrolysis technique [26]. Relative intensity of the peak (002) is predominant for all the prepared films (undoped to 7% Co doped films). The crystallite sizes were calculated using (002) plane from XRD. The lattice parameters ratio (c/a) for all ZnO:Co was calculated and is equal to 1.602 which is in good agreement with standard value (1.60). The overall structure was not affected on doping Co2+ [27].

Figure 2. The XRD pattern of Co doped ZnO thin films.
Download figure:
Standard image High-resolution imageThe lattice parameters of hexagonal wurtzite structure were determined using the following equation [28]

Here the Miller indices are (h k l) and a, b and c are the lattice parameters. The lattice parameters were determined using (1 0 0), (0 0 2), (1 0 1), (1 0 2), (1 1 0), (1 0 3), (2 0 1), (0 0 4) planes and using d the inter-planar spacing for the hexagonal wurtzite structure. Lattice parameter of ZnO films is given in table 2 and they are in agreement with JCPDS card file data (89–0510).
Table 2. Lattice parameter values for Co doped ZnO films.
| Lattice parameter values (Å) | |||||
|---|---|---|---|---|---|
| Observed values | Standard values | ||||
| Co- doping Concentration (%) | a | c | a | c | Unit cell volume (Å3) |
| 0 | 3.24760 | 5.20213 | 3.248 | 5.205 | 47.5156 |
| 1 | 3.24615 | 5.19214 | 47.3821 | ||
| 3 | 3.24457 | 5.19496 | 47.3616 | ||
| 5 | 3.24601 | 5.18902 | 47.3496 | ||
| 7 | 3.24388 | 5.19485 | 47.3406 | ||
XRD profiles were used to analyze the size of the crystallite (D) using Scherrer's formula [29].

Where D is average crystallite size, β is full width at half maximum (FWHM) value of XRD peak, k is a constant shape factor or numerator value (0.9), θ is Bragg's angle, λ is the wavelength of x-ray (1.5406 Å). Average crystallite sizes were given in table 3. It was noticed that the size of the crystallites decreased with the raise in Co doping level. This may be due to the Co2+ can be substitutionally incorporated into the Zn2+ sites of ZnO lattice; consequently the host ZnO crystallite size could be reduced. Ravichandran et al [30] reported the same nature. Here the mobility of atoms on the surface increases for the increase in Co doping level and develops as a cluster, consequently crystallites were agglomerated [31]. Simultaneously the agglomerated crystallites form coalescence of larger grains.
Table 3. Structural parameters of ZnO thin films deposited in various Co doping concentration.
| Dislocation density (δ × 1014)lines.m−2 | Strain (10–3) | ||||
|---|---|---|---|---|---|
| Co- doping concentration (%) | Thickness (nm) | Average crystallite size (nm) | (002) | (002) | Texture Coefficient TC(hkl) |
| 0 | 340 | 45.8 | 3.13 | 2.07 | 1.28 |
| 1 | 358 | 42.5 | 4.01 | 2.34 | 1.20 |
| 3 | 370 | 39.2 | 4.54 | 2.50 | 0.97 |
| 5 | 395 | 38.2 | 5.02 | 2.62 | 0.90 |
| 7 | 410 | 37.5 | 5.58 | 2.76 | 0.71 |
By knowing the crystallite size the dislocation density (δ) can be determined using Williamson and Smallman's formula for (002) plane [31].


Microstrain (ε) of the prepared ZnO films for (002) plane were calculated using equation (4) [32]

The values of dislocation density and microstrain were found to be increased gradually with the increase of Co doping level upto 7% as shown in table 2. As per the calculated results, the dislocation density and micro strain values were increased due to the decrease in crystallite size. Because the presence of Co2+ in the ZnO lattice; resulting the film defects could be literally increased. The crystallinity of the prepared ZnO films were noticed to be reduced which may be caused because of the doping.
The preferred orientation of deposited films i.e. texture coefficient can be analyzed by the below equation [16].

where,  is the measured intensity,
  is the JCPDS constant intensity and N is the total number of reflection. The texture coefficient is important for all polycrystalline materials. The prepared films have the texture coefficient values less than one (<1) for the predominant plane above 3% of Co doping level. This less value of TC represents the lack of grains along the preferred orientation.
3.2. Surface morphology
Pristine and ZnO:Co thin films SEM images were shown in figures 3(a)–(e). The film has uniform surface with spherical shaped grains on the entire substrate in figure 3(a). Figure 3(b) exhibits same spherical shaped grains randomly distributed on films surface. Figure 3(c) reveals small petal like structure dispersed throughout the surface. The grain size reduced with increase of cobalt doping concentration whereas it forms densely packed network. It is clearly observed that for increase in cobalt concentration from 1% to 7% the grain size was found to be decreased [33, 34] according to the figures 3(d), (e). Here it was noticed that the dopant deteriorate the degree of crystallization through its substitution. Sumati Pati et al [35] noticed the same change in morphology. The layers grown at higher doping possess poor crystallinity, may be due to the low radii of cobalt as compared to Zn [36].
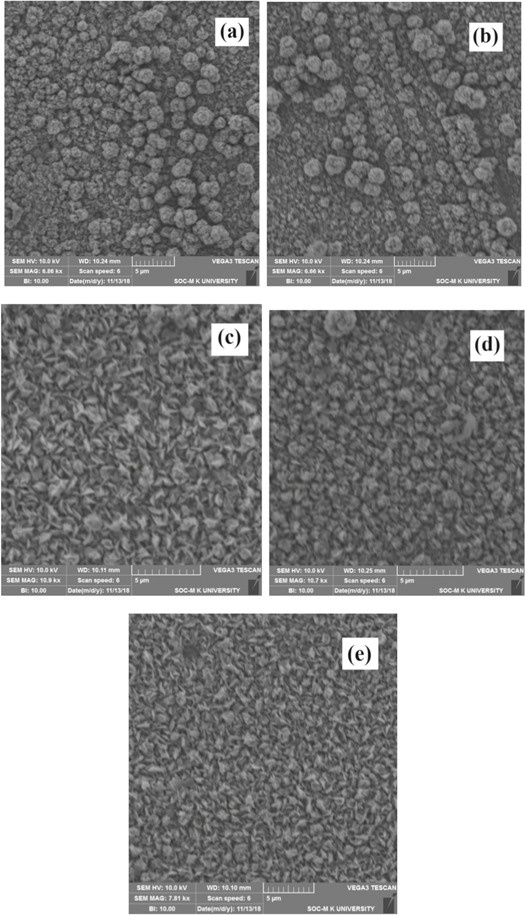
Figure 3 (a)–(e). SEM images of undoped and Co-doped ZnO thin films.
Download figure:
Standard image High-resolution image3.3. Energy dispersive x-ray analysis
In this work EDX analysis was performed to analyse the pure and Co doped ZnO thin films. Figures 4(a), (b) represents the EDX analysis for pure and 7% Co doped ZnO films. The EDX spectrum reveals the existence of peaks related to elements Zn, O and Co [37]. These results suggested that the dopant cobalt was successfully dispersed into the ZnO crystal structure, which leads to enhance the magnetic properties. Some extra peaks were identified at 1.8 keV and 3.6 keV corresponding to Si and Ca, respectively which comes from substrate, precursor solution, and solvent, ambient gas pressure, etc.

Figure 4. EDX images of (a) undoped and (b) 7% Co doped ZnO thin films.
Download figure:
Standard image High-resolution image3.4. AFM analysis
Atomic force microscopy (AFM) helps to visualize the growth of particles on the film surface [38]. The 3D micrographs of prepared pure and ZnO:Co thin films were given in figures 5(a–e), recorded with a scan area of 2.5 μm × 2.5 μm. The AFM images indicate that these coating cover the entire film surface. The surface roughnesses of the films were reduced from 160 nm to 95 nm with respect to Co doping level [39] from undoped to 7%. The surface roughness of undoped ZnO thin film was greater than the doped ZnO films. The Co doping element can creates some lattice desorption or lattice imperfections during the growth process; consequently the host ZnO lattice could be slightly affects at higher doping concentration [40]. The weak transmittance of the thin films is due to scattering and reflection of light from the rough surfaces of the thin films.
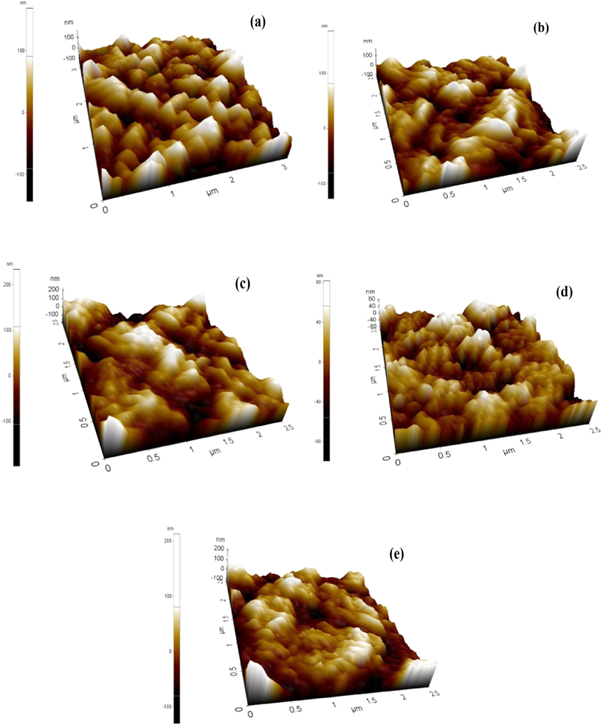
Figure 5 (a)–(e). AFM analyses of undoped and Co doped ZnO thin films.
Download figure:
Standard image High-resolution image3.5. Optical studies
Optical transmission spectra of pure ZnO and Co doped ZnO thin films were observed from 300–1100nm. The transmittance is shown in figure 6 for the prepared ZnO thin films. Transmittance in the visible region was above 75% which start reduced for the Co doping level. Because of increase in Co doping level, the grain size was reduced which leads to the increase in grain boundary density. Consequently the level of light scattering will raises which in turn lessen transmittance of the prepared ZnO:Co films [41, 42]. From the transmittance spectrum, it is clearly observed the absorption edge found to be shifts towards the higher wavelength region on increasing the Co doping level. It can be reduced the band gap value of deposited films.

Figure 6. Optical transmittance spectra of undoped and Co doped ZnO thin films.
Download figure:
Standard image High-resolution imageThe optical energy gap (Eg) of the deposited ZnO was found by the use of absorption spectra with the equation (6) [43]

where, α is the absorption coefficient, ν is the frequency of the incident photon, A is a constant, h is the Planck constant. Figure 7 expresses the band gap obtained for the undoped and ZnO:Co thin films. The observed band gap of ZnO:Co thin films shows the band gap (Eg) values reduced from 3.24 eV to 3.05 eV for the increase of Co doping level. The obtained band gap values were perfectly matched with the literatures [21, 44]. The reduction in bandgap occurs through increase in absorption edge near the higher wavelength. Structural changes on ZnO were occurred on doping Co element causes the reduction in bandgap. The structural deformation occurs via Co doping through the replacement of substitutional or interstitial zinc ions on the ZnO structure. The doping of Co gives supplementary energy levels near the valance band edge of the host ZnO energy gap, but reduction in the energy linked to direct transition [15]. When Co ions located at substitution sites, the carrier concentration increased which increase the grain size. Hence it shows better crystallinity which leads to decrease in band-gap.
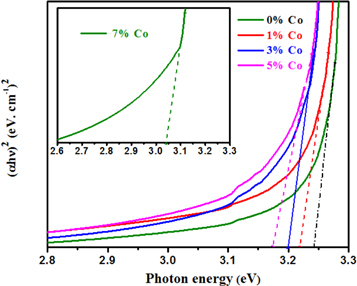
Figure 7. The plot of (αhν)2 vs (hν) for undoped and Co-doped ZnO thin films.
Download figure:
Standard image High-resolution imageThe optical parameters such as refractive index (n), extinction coefficient (k) and optical dielectric properties (ε) can be calculated from the following relations [23, 42]


where, a, λ and k are the absorption coefficient, wavelength, and the extinction coefficient, respectively. Figure 8 shows that the variation of refractive index and extinction coefficient with an increase in the Co doping concentration on the ZnO film. The refractive index and extinction coefficient for the prepared ZnO thin films varied from 1.68–1.87 and 0.085–0.16 for the increase of Co doping level. This may be due to increase in the extinction coefficient caused by to the enhancement in the light scattering along the grain boundary. The real and imaginary dielectric property of the ZnO:Co films can be calculated by using the following equation [23]


where ε1 and ε2 are the real and imaginary part of the complex dielectric constant. The connection between real and imaginary parts of dielectric constant against photon energy of ZnO:Co thin films are presented in figure 9. The real and imaginary parts of the dielectric constant increases for the increase of Co doping level. The obtained maximum real and imaginary parts value was 550 nm and is comparable with the value via spray pyrolysis method [45]. The real and imaginary values of dielectric constant for the prepared ZnO films increased for the increase of Co doping concentration. The obtained optical parameter values were given in table 4.
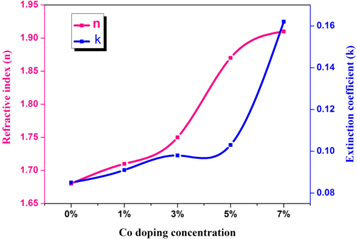
Figure 8. Refractive index and extinction coefficient versus Co doping concentration variation of ZnO thin films.
Download figure:
Standard image High-resolution image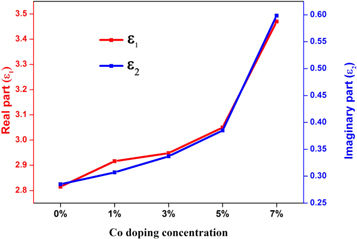
Figure 9. Real and Imaginary part of dielectric constant versus Co doping concentration variation of ZnO thin films.
Download figure:
Standard image High-resolution imageTable 4. Thickness, band gap and dielectric parameters of Co: ZnO thin films.
| Refractive index (n) | Excitation Coefficient (k) | Dielectric Constant (ε1) | Dielectric Constant (ε2) | ||
|---|---|---|---|---|---|
| Co- doping Concentration (%) | Band gap (eV) | Wavelength (550 nm) | |||
| 0 | 3.24 | 1.68 | 0.085 | 2.83 | 0.28 |
| 1 | 3.21 | 1.71 | 0.096 | 2.91 | 0.31 |
| 3 | 3.20 | 1.75 | 0.098 | 2.95 | 0.34 |
| 5 | 3.17 | 1.86 | 0.12 | 3.098 | 0.37 |
| 7 | 3.05 | 1.87 | 0.16 | 3.48 | 0.60 |
3.6. Magnetic Studies
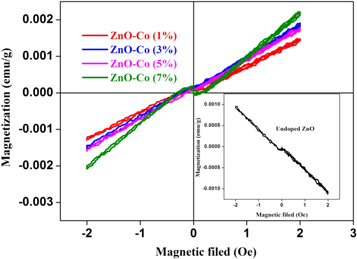
The variations of magnetization (M) with magnetic field (H) for different Co doping concentration (1% to 7%) were shown in figure10. The magnetization measurement was performed using Lakeshore 7407 vibrating sample magnetometer for the prepared ZnO:Co thin films at room temperature. Inset of figure 10 shows the magnetization measurement of undoped ZnO film, it is clearly indicates very week ferromagnetic behavior at room temperature [46, 47]. Ferromagnetic nature beings to appear with Co doped ZnO films. It is due to the minimum super imposition of ferromagnetic component on overall magnetic state. Here additional ferromagnetic component was obtained from Co sub-lattice as reported earlier [11]. However the raise in cobalt content saturates and appeared to be ferromagnetic. In our case ferromagnetism is due to the doping of Co ions, still no secondary phases were observed from cobalt metal clusters and cobalt oxide as seen from the XRD results which is shown in figure 2. Hence, co-ordination of the VSM and XRD results visualizes the presence of Co ions in ZnO thin films which helps to obtain ferromagnetism for all the prepared ZnO thin films [26]. From figure 10, it is also clear that Co doping effect the saturation magnetization as increase on increasing Co doping level. There are two main reason for the origin of ferromagnetism in ZnO:Co system: (i) presence of the cobalt oxides or the presence of clusters of cobalt metal and (ii) successful doping of the Co ions on Zn sites [11, 38, 48]. Presence of ferromagnetic behavior is due to intrinsic coupling between the atoms of doped materials. Because the energy formation of both Zn and O vacancies being large due to strong covalent Zn–O bonds, when the incorporation of Co ions into the ZnO nanostructures decreases the energy formation level consequently the vacancies are stabilized. Moreover, the exchange collaboration of Co–O–Zn–O–Co coupling increases with increasing Co doping level. The amount of oxygen vacancies performs a key role in interceding ferromagnetism conversation between Co2+ and Zn2+. In this study, the observed long good ferromagnetic behavior for ZnO:Co film due to some extrinsic defects like oxygen vacancies and it is reliable with bound magnetic polarons (BMP) model [49]. In our case, the observed magnetization level is high for 7% Co doped ZnO film and is better than the previous reports under very low magnetic field. This may be due to the following possible reasons are; (i) the higher interrelationship between defects and magnetism, (ii) intrinsic defects, such as Zn vacancy (VZn), interstitial defects and oxygen vacancy (Vo) [50]. Similar results were obtained by Singh et al [51] for 6% Co doped ZnO nanoparticles. They suggests that the inclusion of Co2+ ions in ZnO lattice increases the oxygen vacancies, consequently increase the carrier density (e−) and their interaction causes all the Co2+ ions are presented in same direction with Zn2+. From this study, we developed the room temperature ferromagnetism for Co doped ZnO films, which could be considered as a potential candidate for spintronics applications.
Figure 10. Room temperature M-H hysteresis loop on Co doped on ZnO thin films and inset shows undoped film.
Download figure:
Standard image High-resolution image
4. Conclusion
Nebulizer spray pyrolysis was employed to prepare pure ZnO and ZnO:Co DMS thin films. Polycrystalline nature was observed for all the films from XRD patterns and the crystal growth was high along the c-axis with (002) preferred orientation. The ZnO:Co thin films retain the hexagonal wurtzite-type structure of ZnO. The average crystallite size decreases with Co doping level which affects the crystalline quality. From the surface morphology studies, it was noticed that the dopant deteriorate the degree of crystallization through its substitution. The EDX data confirm the presence of Co in the ZnO thin films. The AFM images showed that the increase of Co doping reduces the grain size and surface roughness. The optical transmittance for ZnO was found to be above 75% in the visible region and it reduces for ZnO:Co thin films . The optical band gap of our ZnO samples also decreases with Co concentration. The band gap (Eg) values reduced from 3.24 eV to 3.05 eV for the increase of Co doping level. It is observed that pure ZnO shows week ferromagnetic nature whereas Co doped samples exhibit good ferromagnetic properties, which is used in the field of optoelectronic and spintronics applications. In addition, the prepared ZnO:Co films can show good sensing behavior at room temperature due to the defects like oxygen vacancies.