

Abstract
TiO2 nanorods are synthesized by hydrothermal method using the commercially available TiO2 nanopowder (P25) as a precursor. This work mainly focused on the study of the various properties and comparison among the P25, 20 mg TiO2 nanorods and 40 mg TiO2 nanorods by different characterizations. Fourier Transform Infrared Spectroscopy (FTIR) was carried out and the results confirmed the formation and presence of TiO2 nanorods by shifting peak positions from 1433 cm−1 to 1424cm−1 and 1420cm−1. The x-ray diffraction (XRD) results indicate that the crystallinity of TiO2 nanorods increased significantly and was confirmed by the variation in the diffraction peak intensity and the peak at 2θ = 25.23° is conformed the anatase phase. The Field Emission Scanning Electron Microscope (FESEM) images clearly show the formation and presence of TiO2 nanorods. Thermogravimetric Analysis (TGA) and Differential Thermal Analysis (DTA) reveal that increasing in thermal stability and differential scanning calorimeter (DSC) evaluates the increase in melting temperature of TiO2 nanorods. The UV–vis absorption spectra show the absorption peak redshift towards higher wavelength and it leads to expansion of optical activities of TiO2 nanorods. The optical band gap energy was found to be decreased to 5.3, 5.2 and 4.9 eV for P25, 20 and 40 mg respectively. The dielectric constant has increased twice and the dielectric loss by almost ten times compared to dielectric constant and dielectric loss of the P25. The current versus voltage (I-V) characteristics show the linear curve which reveals the easy flow of current is more in TiO2 nanorods. From the obtained results, it could be concluded that TiO2 nanorods are suitable for potential applications.
Export citation and abstract BibTeX RIS

Original content from this work may be used under the terms of the Creative Commons Attribution 4.0 licence. Any further distribution of this work must maintain attribution to the author(s) and the title of the work, journal citation and DOI.
1. Introduction
In the recent years, Metal oxides play a major role in the field of Nano electronics, physics, chemistry and materials science [1]. Metal oxides and combination of Metal oxides are used in both dielectric and conducting applications. Metal oxides are used in different applications like sensors, microelectronic circuits, piezoelectric devices and fuel cells. Metal oxides can be classified into four groups namely high conductors (e.g. SrRuO3), superconductors (e.g. YBa2Cu3O7), semiconductors (e.g. TiO2, ZnO, SnO2, CuAlO2) and insulators (e.g. Al2O3, MgO, BeO). Metal oxides based semiconductors and insulators have more application oriented properties as they play the key role in electronics domain [2]. Among the available metal oxides, TiO2 is one of the best materials in the field of medical electronics due to their properties such as nontoxic, biocompatible, chemically stable, high band gap, high dielectric constant and inexpensive [3]. In addition to that, TiO2 has also unique physical, chemical and electronic properties [4]. The TiO2 nanoparticles belong to transition metal oxides family. The naturally occurring TiO2 crystal has three polymorphs (phases) namely rutile, anatase and brookite [4]. Among those polymorphs rutile and anatase have wider application but rutile is the most stable than both anatase and brookite at room temperature. TiO2 is available in different forms such as bulk material, nanoparticles, nanowires, nanorods, nanotubes etc TiO2 nanoparticles have uniqueness in their physical and chemical properties due to their limited particle size and a high volume density. TiO2 nanoparticles are one of the most important metal oxide nanoparticles compared to others and are used in various number of fields. TiO2 nanoparticles are very popular for their enormous and miscellaneous applications. TiO2 nanoparticles are used in day to day products such as foods, paints, pharmaceuticals, cosmetics, plastics, toothpaste, glazes and enamel etc [5]. In advanced applications, TiO2 nanoparticles play major role such as energy field like storage cells, photovoltaic cells and environmental field like water purification, air purification, photo catalysts [6] and also biomedical fields like biosensing, drug delivery etc TiO2 bulk material and TiO2 nanoparticles are inexpensive but nanotube, nanowires and nanorods are quite expensive, to overcome this, the work concentrates to fabricate TiO2 nanorods inexpensively by hydrothermal method using P25 (Titanium nanopowder) as a precursor. The major existing methods to fabricate TiO2 nanorods are surfactant directed, electrochemical, microwave irradiation, alumina templating and hydrothermal. Among all, hydrothermal method is the best for fabrication of TiO2 nanorods with some advantages like fabricated materials have high quality with small diameters of about 10nm, also inexpensive and very convenient [7]. This method has some advantages like not harmful, temperature can be controlled manually, duration of the process is short and it can be setup easily within the room as user friendly. In this paper, TiO2 nanorods are prepared by hydrothermal method using commercially procured P25 to study the various properties such as structure, surface morphology, optical, thermal and electrical conductivity properties. The comparison among P25, 20 mg and 40 mg TiO2 nanorods is the major aim of this work. According to the results, among those ratios 40 mg TiO2 nanorods are best in thermal stability, crystal size, structure and conductivity. These studies help to state that the TiO2 nanorods are suitable for potential application. Finally the paper concludes that, the 40 mg TiO2 nanorods are the best ratio for potential applications against P25 and 20 mg TiO2 nanorods and it is well explained in the paper.
2. Experimental work
2.1. Materials used
TiO2 nanopowder (P25) purchased by sigma Aldrich USA with high purity, sodium hydroxide (NaOH) AR grade and hydrochloric acid (HCl) AR grade was purchased from FINAR for synthesis of TiO2 nanorods.
2.2. Preparation of TiO2 nanorods
The TiO2 nanopowder (P25) is used as precursor, 10N NaOH is dissolved in 40 ml of distilled water and the solution is transferred to the Teflon lined autoclave by adding 0.5 gm of P25 to the above solution and hydrothermally treated for 24 h at 130 °C then allowed to cool for 4 to 5 h at room temperature. After cooling, the collected precipitation from the autoclave is washed with deionised water for 2 to 3 times called water treatment followed by an acid treatment (HCl) to obtain the pH value of the precipitation become 7 (neutralization). Finally the powder was dried at 60 °C to produce TiO2 nanorods. The synthesis process was clearly shown in the scheme

Scheme 1. Synthesis process of TiO2 nanorods by hydrothermal method.
Download figure:
Standard image High-resolution image2.3. Preparation of TiO2/PVA film
1.98 gm of poly vinyl alcohol (PVA) is dissolved in 30 ml of distilled water and stirred for 6 h. On the other hand the synthesized 20 and 40 mg TiO2 nanorods were dissolved in 10 ml of distilled water, sonicated the solution for 5 min, add sonicated TiO2 nanorods solution drop wise to the PVA solution and stirred for 3 h to get homogeneous mixture, pour the solution to the petri dish and allow solvent to evaporate at room temperature. The film peeled off is used for further characterizations.
2.4. Characterization techniques
The x-ray diffractometer (Rigaker Miniflex II) was used to study the structural properties of the samples between 0 to 60° with the scanning rate 5° per minute. The chemical composition and functional groups of the samples are examined by using Fourier transform infrared spectroscopy (FTIR, ALPHA BRUKER), spectral range between 4000 cm−1 to 500 cm−1 wavenumber. The surface morphology of the samples was studied with Field emission scanning electron microscope (FESEM, sigma Zeiss) with operating voltage 15 kV and at the magnification 2μm. The various thermal studies like Thermogravimetric analysis (TGA), Differential thermal analysis (DTA) and Differential scanning calorimeter (DSC) were studied by the instrument (SDT Q600 TA Instruments) with temperature range between room temperature and 800 °C at the scanning rate 10 °C per minute with a nitrogen flow rate of 20 ml per minute. The two probe work station instrument (Keithley workstation) is used to examine the current voltage (I-V) characteristics of the samples in the voltage range between −5V and +5V. The dielectric studies of the samples were carried out by using Impedance Analyzer (Agilent 4294A Precision Impedance Analyzer) in the frequency range from 40 Hz to 10 kHz.
3. Result and discussions
3.1. Fourier transform infrared analysis
The Fourier transform infrared spectroscopy (FTIR) analysis helps to examine the functional groups and chemical composition recorded under the wavenumber 4000–500 cm−1 of TiO2 nanorods as shown in figure 1. For the sample P25 the peak at 3311 cm−1 indicates the hydroxyl group (–OH) and that band shifted to 3304 cm−1 in 20 mg and to 3291 cm−1 in 40 mg due to the formation of TiO2 nanorods and the broad absorption band between 3400 and 3200 cm−1 indicates stretching vibration of hydroxyl group (O–H) [8–11]. The band at 2928 cm−1is assigned to the C–H stretching [9, 12] of the sample P25 and the peak slightly shifts by increasing intensity to 2926 cm−1 and 2921 cm−1 respectively in case of 20 mg and 40 mg samples, and the band at 1433 cm−1 of P25 is shifted to 1424 cm−1 and 1420 cm−1 for the 20 and 40 mg respectively.

Figure 1. FTIR spectra of (a) P25 (b) 20 mg TiO2 nanorods (c) 40 mg TiO2 nanorods.
Download figure:
Standard image High-resolution imageThe C–O band stretching appears at the peak 1091 cm−1 is shifted to 1084 cm−1 and 1071 cm−1 respectively with increased peak intensity. The peaks at 1559 cm−1,1433 cm−1, 1375 cm−1, 1562 cm−1, 1424 cm−1, 1372 cm−1, 1571 cm−1, 1426 cm−1, 1370 cm−1 corresponds the Ti–O–C groups of P25, 20 mg and 40 mg respectively [12]. The observed FT-IR results shifting in peak positions and variation in the peak intensity confirms the change in chemical bonds and hence forms the TiO2 nanorods.
3.2. Surface morphology
Figure 2 shows the FESEM images of P25, 20 mg and 40 mg TiO2 nanorods. Figure 2(a) confirmed the presence of TiO2 nanoparticles and figure 2(b) reveal the formation of small rod like structure at 20 mg and figure 2(c) confirmed the formation of TiO2 nanorods perfectly.

Figure 2. FESEM images of (a) P25 (b) 20 mg TiO2 nanorods (c) 40 mg TiO2 nanorods.
Download figure:
Standard image High-resolution imageDuring the synthesis process, NaOH and HCl play the major role in changing the morphology. Due to the addition of NaOH and HCl the Ti–O–Ti bonds are broken and form an intermediate product like Ti–O–Na and Ti–OH bond and the process leads to formation of layered structure and after that Ti–O-Na and Ti–OH bonds treated with water (pH 7) which leads to the formation of TiO2 nanorods [13, 14].
3.3. X-ray diffractometer (XRD) analysis
The XRD pattern of the samples P25 and TiO2 nanorods are as shown in figure 3. The XRD spectra exhibits the characteristic peaks with corresponding (hkl) index values for P25 at 2θ = 15.69° [202], 22.64°, 25.23° [101], 35.15° [004], 43.21° [111], and 53.11° [211]. The major peaks intensity was varied and the peaks shifts for 20 mg to 2θ = 14.96°, 20.91°, 24.88°, 34.59°, 42.83° and for 40 mg to 2θ = 14.74°, 4.07°, 34.76° and 42.83°.

Figure 3. XRD spectra of P25, 20 mg TiO2 nanorods and 40 mg TiO2 nanorods.
Download figure:
Standard image High-resolution imageThere is also a broad peak at around 2θ = 13° in P25, its decrease intensity or vanish for 20 mg and 40 mg is attributed to the initiation of phase transformation of TiO2 nanoparticles into TiO2 nanorods. The diffraction peak at 2θ = 25.23° is confirmed the anatase phase [15] of the pure P25 and corresponding diffraction anatase phase gets stronger and intense in both the 20 and 40 mg TiO2 nanorods. The variations in the peak positions were clearly observed and the peak intensity increased significantly with increasing the weight ratio and disappearance or vanish of a broad peak at 2θ = 13° in P25 for 20 mg and 40 mg which attributed to the initiation of phase transformation of TiO2 nanoparticles into TiO2 nanorods. The observed results clearly indicate that the crystallinity was increased significantly in the nanorods.
3.4. Thermal analysis
The TGA/DTA techniques are widely used to evaluate the thermal stability of materials and the TG/DT graphs of P25, TiO2 nanorods at 20 mg and 40 mg were shown in figure 4. The three major weight loss regions are observed in TG curves [16, 17]. The first stage was observed at 30–100 °C which is attributed to the removal of water or moisture content due to the braking of carbon-hydrogen bonds in the sample. The second stage was observed between 110–230 °C which is corresponding to the loss of dopants and any acid content from the sample. The major weight loss was observed in the third stage around the 550–575 °C which is related to the destruction in the backbone of polymer chain and losses the originality of the sample.

Figure 4. TGA D−1T−1A−1 Thermograms of P25, 20 mg TiO2 nanorods and 40 mg TiO2 nanorods.
Download figure:
Standard image High-resolution imageFrom the figure 4 it is noticed that the Thermogravimetric temperature of the samples P25, 20 mg and 40 mg of TiO2 nanorods have increased upto 557 to 567 and 575 °C respectively with correspondingly increase in the decomposition temperature 319, 327 and 329 °C for P25, 20 mg and 40 mg of TiO2 nanorods respectively, which indicates the increased thermal stability of TiO2 nanorods.
3.5. Differential scanning calorimetry (DSC)
The melting temperature (Tm) of the samples was determined by DSC technique. DSC curves of P25, 20 mg and 40 mg were shown in figure 5. The thermal stability and melting temperature of the TiO2 nanorods were examined between room temperature and 700 °C. It is observed that the melting temperature was increased with increase in the ratio of TiO2 nanorods and it is responsible for enhancing the crystallinity.

Figure 5. DSC curves of P25, 20 mg TiO2 nanorods and 40 mg TiO2 nanorods.
Download figure:
Standard image High-resolution imageThe DSC curves exhibits two exothermic peaks in the temperature range from 135 to 148 °C and 528 to 549 °C. The exothermic peaks at 135 °C, 141 °C and 148 °C of P25, 20 mg and 40 mg respectively are assigned to the adsorption of water or removal of moisture content from the TiO2 nanorods [17]. The increase in the melting temperature at the exothermic peaks at 528 °C, 542 °C and 549 °C are attributed to the phase transformation of the TiO2 nanoparticles into TiO2 nanorods [17] as a result the crystallinity of the TiO2 nanorods was increased. These results are correlated with the XRD analysis.
3.6. UV–visible absorption spectra
UV- Visible absorption spectra of samples P25, 20 and40 mg TiO2 nanorods are shown in figure 6. The information about the band structure of compounds can be studied by optical absorption spectra. An electron excited from lower to higher energy state by absorbing a photon of energy of electron inter-/intraband transition or exciting transition. The main absorption wavelength of TiO2 nanorods corresponds to the intrinsic absorption of anatase phase of TiO2. The absorption shows red shift towards higher wavelength from 272 nm to 276 nm and 279 nm for P25, 20 mg and 40 mg of TiO2 nanorods respectively, it reveal the fact that the valence band shifts toward the conduction band resulting into narrowband gap. Hence the energy required for the electrons to transit from the valence band to conduction band (optical excitation) decreases due to the red shift in the absorption [18]. The obtained results suggest that, after the formation of TiO2 nanorods the optical response was expanded and hence improves in the photo catalytic properties of TiO2 nanorods [19].

Figure 6. UV absorbance spectra of P25, 20 mg TiO2 nanorods and 40 mg TiO2 nanorods.
Download figure:
Standard image High-resolution image3.7. Optical band gap energy
The optical band gaps of samples calculated using the relation between the absorption coefficient (α) and incident photon energy (hν) by the following equation,
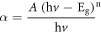
The direct optical band gap was simply a transfer of the electron from the top of the valence band to the bottom of the conduction band without any change in momentum. The relation between the absorption coefficient (α) for a direct transition and the photon energy (hν) was given by Fahrenbruch and Bube
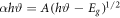
The indirect band gap is a transition of electron from the valence to conduction band which is associated with a photon of the right magnitude of crystal momentum and the bottom of the conduction band does not correspond to zero crystal momentum in indirect band gap materials and the absorption coefficient dependence on the photon energy for indirect transitions [20]. The direct optical band gap values are extracted from the linear portion of (αhѵ)2 versus photon energy (hν) plots [21] as shown in figure 7. The optical band gaps were decreased from 5.3 eV, to 5.2 eV and 4.9 eV for P25, 20 mg and 40 mg TiO2 nanorods respectively.

Figure 7. Energy band gap spectra of P25, 20 mg TiO2 nanorods and 40 mg TiO2 nanorods.
Download figure:
Standard image High-resolution image3.8. Dielectric property
The dielectric permitivity of P25, TiO2 nanorods at 20 mg and 40 mg as a function of frequency at room temperature are studied and presented the dielectric constant (ε') in figure 8 and dielectric loss (ε') in figure 9. The dielectric constant (ε') of a material is related to the dipole polarizability, which arises from electric dipoles they can change the orientation of polarization subjected to the applied electric field. The ε' of P25, TiO2 nanorods at 20 and 40 mg is frequency dependent in lower frequency because of the dipoles are response significantly with applied electric field and the contribution ofthe space charge effect towards polarization may tend to increaseat lower frequencies as a result the high dielectric constant. The ε'of P25, TiO2 nanorods at 20 and 40 mg is frequency independent at higher frequency region due to the dipoles are unable to respond with applied electric field and thus they behaviours like tightly bounded at high frequencies is reason to maintain the constant and low dielectric constant [22]. The dielectric constant (ε') and dielectric loss (ε') were calculated using following relations,


Figure 8. Dielectric constant of P25, 20 mg TiO2 nanorods and 40 mg TiO2 nanorods.
Download figure:
Standard image High-resolution image
Figure 9. Dielectric loss of P25, 20 mg TiO2 nanorods and 40 mg TiO2 nanorods.
Download figure:
Standard image High-resolution imageIt is observed that the dielectric constant (ε') and dielectric loss (ε') of P25, TiO2 nanorods at 20 and 40 mg are decreased suddenly with increase in the frequency which may be because the dipole polarization failed to change the direction of orientation with applied field or the polarisation of dipoles decrease whendipole rotation cannot follow electric field changes at highfrequencies that results in the decrease the dielectricconstant. The dielectric constant (ε') and dielectric loss (ε') increased at low frequencies due to the accumulation of charges between the sample and electrode as a result there is an increase in charge carrier density due to the increased dissociation of ion aggregation andhence the occurance of the relaxation phenomenon which results in the increase of dielectric parameters at low frequency and contribute to increase the ionic conductivity [23].
3.9. Current-voltage (I-V) characteristics
I-V characteristics of the samples were examined at room temperature by using two probes Keithley workstation instrument as shown in figure 10. I-V characteristics of the samples reveal the ohmic behaviour i.e., the current increases linearly with the increase in the applied voltage in the range −5V to +5V. The current of the TiO2 nanorods is increase in the field of induced polarization of the applied bias voltage which is attributed to enhance electrical conductivity [24]. By improving the interface and electrode contacts it is possible to obtain the good electrical characteristics with high stability which helps in high quality device applications of the TiO2 nanorods. Due to the formation of TiO2 nanorods the recombination of charge will decrease and increases the charge transfer rate, due to the path provided by straighten nanorods to flow easily. As a result the increase in the electron density and hence increases the conductivity.
4. Conclusion
The TiO2 nanorods were prepared by hydrothermal method and investigated the structure, morphology, thermal, optical and conductive properties. The phase transformation from nanoparticles to nanorods of TiO2 due to changes in the chemical structure or bonds was confirmed by the FTIR analysis. The surface morphology was studied by FESEM and noticed the formation of fine TiO2 nanorods. The increased peak intensity is evident to enhanced crystallinity as observed in XRD analysis. Thermal studies were carried out by TGA/DTA analysis and the results confirmed the increasing thermal stability of the TiO2 nanorods and the DSC analysis reveal the increased melting temperature from 528 °C to 542 and 549 °C for P25, TiO2 nanorods of 20 mg and 40 mg respectively. UV-Vis. spectroscopy exhibits the redshift in the wavelength by decreasing the energy band gaps from 5.3eV, to 5.2 and 4.9eV for P25, TiO2 nanorods of 20 mg and 40 mg respectively. The dielectric properties increased in low frequency and decreases with increased frequency. I-V characteristic shows that the linear increase in current with applied voltage. Finally, the obtained results are proved that the sensitive characteristics of the TiO2 nanorods are better than P25 for potential applications. Hence the hydrothermally synthesized TiO2 nanorods may overcome by P25 nanoparticles.

Figure 10. I-V characteristics of P25, 20 mg TiO2 nanorods and 40 mg TiO2 nanorods.
Download figure:
Standard image High-resolution image