
Abstract
In the present study, the negative real permittivity behavior of a copolyester of bisphenol-A with terephthalic acid and isophthalic acid (PAr) containing 1.5 to 7.5 wt% multi-walled carbon nanotubes (MWCNTs) have been investigated in detail. The structural and morphological analysis of the melt-mixed composites was performed by Fourier transform infrared spectroscopy using attenuated total reflection (FTIR-ATR), atomic force microscopy (AFM), x-ray diffraction (XRD), and light microscopy. The influences of the MWCNT filler on the AC impedance, complex permittivity, and AC conductivity of the PAr polymer matrix were investigated at different operating temperatures varied between 296 K and 373 K. The transition from a negative to positive real permittivity was observed at different crossover frequencies depending on the MWCNT content of the composites whereas pure PAr showed positive values at all frequencies. The negative real permittivity characteristic of the composites was discussed in the context of Drude model.
Export citation and abstract BibTeX RIS

Original content from this work may be used under the terms of the Creative Commons Attribution 4.0 licence. Any further distribution of this work must maintain attribution to the author(s) and the title of the work, journal citation and DOI.
1. Introduction
Negative real permittivity materials are the indispensable key for producing metamaterials. Metamaterials are synthetically produced materials exhibiting exotic electrical properties such as negative real permittivity and negative permeability that do not exist in natural materials [1]. Additionally, these new kind of materials can display high-frequency magnetism cloaking capabilities and electromagnetically induced transparency [2]. In recent years, polymers have also been utilized to produce materials with this type of exotic electromagnetic properties. Especially, scientists focused on the preparation of polymeric nanocomposites due to their remarkable properties such as lightweight and adjustable electrical, magnetic and mechanical parameters. Negative real permittivity has been observed for some polymer nanocomposites that include carbon-based nanoparticles [1]. Ramasamy et al reported, for example, that it is possible to observe a high negative real permittivity when the graphene addition reaches a critical concentration in polypropylene (PP) [3]. From this point of view, the present work was focused on producing novel polymer-based composites having negative real permittivity. For this purpose, the copolyester of bisphenol A with terephthalic acid and isophthalic acid, which is one of the members of polyarylate family, was chosen as the host polymer, and multi-walled carbon nanotubes (MWCNTs) were selected as the guest nanofiller. Generally, polyarylates are a type of aromatic polyesters, containing a bisphenol and aromatic dicarboxylic acids. They represent a decisive high-performance polymeric material family with unparalleled mechanical properties, high thermal stability, good processability, weather resistance, and high temperature and chemical resistance. Polyarylates, which are amorphous thermoplastics, combine some powerful properties such as high impact strength, high flame resistancy, high glass transition temperature (Tg), high heat deflection temperature, suitable electrical properties, and ultraviolet stability [4, 5]. On the other hand, because of their high Tg, it is difficult to process them. For this reason, to improve their processability, additives are utilized to decrease their melt viscosity [6]. Among various polyarylates, the polyarylate composed of isophthalic and terephthalic acids with bisphenol-A, called as 'PAr', exhibits a superior performance in brightness, transparency, and low haze when it is exposed to ultraviolet light. Moreover, it has gained great success in commercial aging tests [7]. In addition, PAr has a low specific weight, low moisture absorption, good resistance to organic gas vapors, high Tg, and its electrical conductivity can be increased by adding conductive fillers. Hence, it has been utilized in a wide variety of applications including aircraft, automobile, and electrical industries [8–11].
On the other hand, carbon nanotubes (CNTs) define a family of nanomaterials composed of graphitic carbon. Due to their remarkable electrical properties, CNTs have been used as modifiers for organic materials used in various advanced applications, including fuel cells and batteries, photovoltaics, sensors, displays, and smart clothing [12]. In particular, MWCNTs, consisting of several superimposed tubular graphite layers, have three extraordinary properties useful for industrial applications. The first one is their high electrical conductivity, which is almost equal to that of copper. Secondly, their specific mechanical strength is 15–20 times higher than that of steel. The last powerful feature of the MWCNTs from the industrial point of view is their high thermal conductivity, which is five times higher than that of copper and equal to that of diamond. An integration of these outstanding features of MWCNTs into polymer based nanocomposites makes them useful for many industrial applications [13]. CNT modified polymeric composites have been already utilized in e.g. automotive industry, as well as electromagnetic interference (EMI) shielding, electrical packaging, aerospace applications, etc [14–18].
In this study, our main objectives were the preparation of new composite material with negative dielectric permittivity by adding MWCNTs to the PAr copolymer and tuning the electrical conductivity of the composites for various technological applications. AC impedance and complex permittivity along with the AC conductivity features of PAr/MWCNT composites were investigated in dependence on the MWCNT concentration and the operating temperature. Additionally, a detailed structural and morphological analysis of the composites was made by using FTIR-ATR spectroscopy and XRD techniques along with atomic force and light microscopy, respectively.
2. Experimental
2.1. Materials
The copolyester of bisphenol-A with terephthalic acid and isophthalic acid, which is commercially known as ARDEL®D-100 (heat deflection temperature (264 psi) 174 °C, melt flow index (375 °C) 4.5 g /10 min, density 1.21 g cm−3, refractive index 1.61, tensile strength 10.000 psi, tensile modulus 300.000 psi, tensile elongation at yield 9%, dielectric strength short time (1/8' thick) 400 V mm−1, dielectric constant at 1 kHz 3.3), was purchased from Amoco Performance Product (Alpharetta, USA) (figure 1(a)). MWCNTs (figure 1(b), Nanocyl® NC 7000TM) with a carbon purity of 90% was supplied from Nanocyl S A (Sambreville, Belgium). The MWCNTs are produced by the catalytic chemical vapor deposition (catalytic CVD) process. According to the datasheet, the average diameter of the MWCNTs is 10 nm and the length of the MWCNTs varies between 0.1 and 10 μm with a mean value of 1.34 μm [19]. Their surface area is in the range of 250–300 m2 g−1 and their mass density is approximately 1.75 g cm−3. Before starting the mixing process, the MWCNTs and PAr were dried in a vacuum oven for 16 h at 80 °C and 120 °C, respectively.
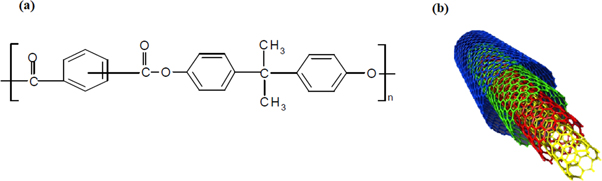
Figure 1. (a) The chemical structure of PAr and (b) schematic view of one MWCNT.
Download figure:
Standard image High-resolution image2.2. Preparation of PAr/MWCNT composites
PAr granules were powdered using a Retsch Centrifugal Grinding Mill ZM 1000 with 1 mm gap working at 1000 rpm and room temperature. PAr/MWCNT composites containing 0, 1.5, 3.75, 5, and 7.5 wt% MWCNT were obtained by melt compounding using a DSM Xplore 5 twin-screw micro-compounder operated at 300 °C and 50 rpm screw speed for 5 min. Compression molding was done at 10 bar for 60 s after tempering the material for 5 min at 300 °C, using a Vogt labor press P 200T (Berlin, Germany). Disc-shaped samples with a diameter of 30 mm and a thickness of about 0.68 mm were prepared.
2.3. Structural and morphological characterization
Fourier transform infrared (FTIR) spectroscopy of the PAr/MWCNT composites was performed with a BRUKER TENSOR 27 FTIR spectrophotometer with an Attenuated Total Reflection (ATR) accessory. FTIR-ATR spectra of composite films were measured between 2500 and 500 cm−1 with a resolution of 4 cm−1 accumulating 64 scans in the transmittance mode. X-ray diffraction (XRD) patterns of the PAr/MWCNT composites were obtained at room temperature by means of a TT-90 model Polycrystal XRD device with internal wavelengths used from Copper (Cu) anode material and generator settings of 40 mA and 45 kV. Atomic force microscopy (AFM) images were taken on cut surfaces smoothed using an ultramicrotome (Galetza Ultramicrotomie Reichert FCS). The measurements were carried out in tapping mode with height and phase contrast using a Veeco Metrology Group, NanoScope IV Dimension 3100 AFM. The scan size of the AFM images was 2 μm for all samples. Transmission light microscopy using phase contrast was performed on thin sections of the samples with a thickness of 2.5 μm, which were cut using a Jung RM 2055 Leica microtome machine at room temperature. The light microscope (Axioplan 2, Zeiss) was equipped with a CCD camera for digitalization of the images.
2.4. Characterization of the electrical properties by complex impedance measurements
Impedance and dielectric properties of the samples were determined using a Quatro Cryosystem NOVO Control Broadband Dielectric/Impedance analyzer between 1 Hz and 10 MHz in the temperature range between 293 and 373 K. The measurements were performed on the compression molded samples by the two-point probe technique with circular gold electrodes with an area of 3.14 cm2.
3. Results and discussions
3.1. Structure and morphology of the PAr/MWCNT composites
The influence of the MWCNT filler on the FTIR-ATR spectrum of the PAr composites is shown in figure 2. The characteristic ester C–O and C=O stretching bands of PAr copolymer at 1200 cm−1 and 1730 cm−1 did not change when adding MWCNTs. However, with increasing MWCNT content in the composites, the sharp peak at 1587 cm−1 with a small side peak at 1603 cm−1 caused by aromatic rings of PAr was broadened and shifted to 1600 cm−1 with the decreasing transmittance of the composites.
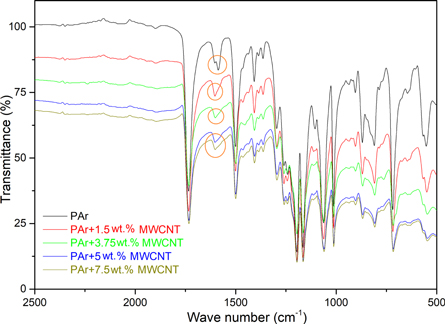
Figure 2. FTIR-ATR spectra of PAr and PAr composites with different MWCNT contents.
Download figure:
Standard image High-resolution imageThe XRD patterns of PAr and its composites containing 1.5 wt% and 7.5 wt% MWCNT are given in figure 3. In figure 3(a), the peaks at about 2θ = 20° and 45° attributed to the pure PAr [20] which were still detected for PAr/MWCNT composites (figures 3(b) and (c)), suggesting the structure of PAr was well retained during the melt mixing and compression molding processes of PAr with MWCNT. The characteristic sharp peak observed at 2θ = 25.2° (figure 3(c)) confirms the presence of MWCNTs in the composites [21–24].
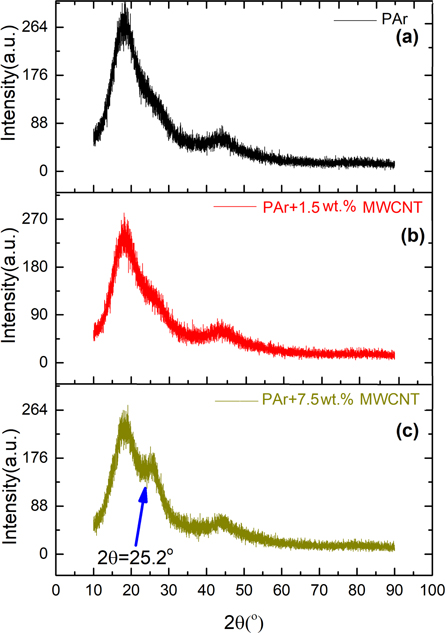
Figure 3. XRD patterns of (a) PAr, (b) PAr+1.5 wt% MWCNT, and (c) PAr+7.5 wt% MWCNT composite.
Download figure:
Standard image High-resolution imageThe AFM images of the samples are shown in figure 4. The prepared surface of the PAr is smooth exhibiting just soft cut structures in the height contrast (figure 4(a)) and a slight grainy structure in the phase contrast image (figure 4(b)). On the other hand, in the composite of PAr+7.5 wt% MWCNT, nanotubes protruding from the smooth cut surface can be clearly seen in the height contrast mode (figure 4(c)) as well in the phase contrast (figure 4(d)), where they appear as hard fillers. Thus, AFM proofs a good dispersion state of MWCNT on the nanoscale.

Figure 4. AFM images of (a) height contrast of PAr, (b) phase-contrast of PAr, (c) height contrast of PAr+7.5 wt% MWCNT h, (d) phase-contrast of PAr+7.5 wt% MWCNT.
Download figure:
Standard image High-resolution imageThe light microscopy images (figure 5) of the composites illustrate a strong darkening of the samples when MWCNTs are incorporated. Whereas the pure PAr sample appears to be transparent with some structures induced by the embedding, the composites have greyish appearance illustrating dispersed MWCNTs with some remaining carbon nanotube agglomerates, which were not dispersed in the polymer matrix. The MWCNT agglomerates appear as black spots with wide particle size distributions (ca. 5 to 30 μm) and their size and number increase with MWCNT content.
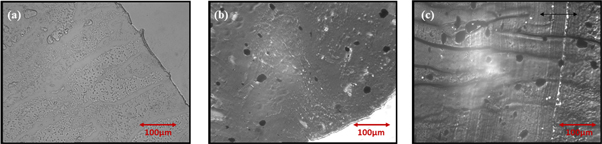
Figure 5. Light microscopy images of (a) PAr, (b) Par + 1.5 wt% MWCNT and (c) Par + 7.5 wt% MWCNT composite.
Download figure:
Standard image High-resolution image3.2. Impedance spectroscopy measurements of the samples
Impedance spectroscopy measurements are generally used for analyzing the complex permittivity and charge transport mechanism of dielectric materials [25, 26]. The complex impedance ( ) is defined as

where  (the real part of the impedance) describes the frequency dependent resistance,
  (the imaginary part of the impedance) is known as the loss factor of the material and
  The frequency dependent
  and
and  measurements of the samples at room temperature (296 K) are shown in figures 6(a) and (b), respectively. The real part value of the complex impedance of PAr decreases with frequency and reaches very low values in the 10 MHz region (figure 6(a). Whereas PAr shows a continuous decrease in
  with frequency, the real part of the complex impedance exhibits a plateau behavior at lower frequencies for all MWCNT containing composites. As is clearly observed in figure 6(a), the plateau value of the real part of complex impedance decreases with increasing MWCNT content. Furthermore, the frequency where
  starts to decrease with frequency shifts to higher values with increasing filler loading. The plateau for the
  observed at the low and mid-frequency domains, can be related to the direct current (DC) conductivity behavior of the material [27]. The decrease in
  value of the composites due to increasing MWCNT content can be interpreted that the MWCNTs are well dispersed within the polymer matrix (see figures 4, 5), forming a conductive network that becomes more perfect with higher nanotube content.
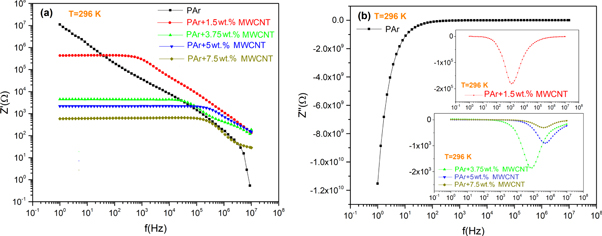
Figure 6. Frequency dependence of the (a) real and (b) imaginary parts of the complex impedance of PAr and PAr/MWCNT composites at room temperature.
Download figure:
Standard image High-resolution imageAs shown in figure 6(b), relaxation peaks in  are observed only for the PAr /MWCNT composites and the relaxation frequency shifted to higher frequencies with increasing MWCNT content up to 5 wt% loading. The relaxation frequency of the 7.5 wt% MWCNT containing sample is slightly lower than PAr + 5wt% MWCNT, possibly caused by worse MWCNT dispersion at this higher loading. On the other hand, no relaxation peak was observed for PAr in the measured frequency interval of the impedance analyzer. However, the frequency dependence of
  PAr implies that it may have a low-frequency relaxation peak which is not covered by the frequency measurement interval of our device. The observation of a peak in the
  versus frequency plot of the composite samples implied that a relaxation process occurs in the materials. Additionally, the height of the relaxation peak decreases with the MWCNT content in the composites. The decrease in the peak height can be interpreted that the bulk resistance of the samples decreases. Moreover, that
  approached zero at high frequency for all samples suggests that there is no polarization contribution to the real part of permittivity at high frequencies.
It is known that varying the measuring temperature influences the AC impedance spectra. Exemplarily, the frequency dependencies of the real and imaginary parts of impedance for Par + 1.5 wt% MWCNT and Par + 7.5 wt% MWCNT composites are given for different temperatures varying between 296 K and 373 K in figure 7. The temperature dependences of the  and
and  characteristics of all composite samples resemble each other. As shown in figure 7, the real part of the AC impedance decreased as the temperature increases. This behavior is known as negative temperature coefficient (NTC) behavior [28, 29]. NTC resistors, where the resistance decreases as the temperature rises, are used in various industrial and healthcare applications for temperature monitoring and control. In this regard, using conductive fillers is an effective method to control the resistance of NTC thermistors. Thus, PAr/MWCNT composites can be used as NTC material in electronic applications [30, 31]. Additionally, the decrease in the
  value with increasing temperature hints to the semiconducting nature of the samples. On the other hand, as the temperature increases, the relaxation frequency shifted toward higher frequencies for both composites. The observation of a single relaxation peak in the
  versus frequency spectra which is hierarchically shifted to high frequencies with temperature is an indication of the presence of the thermally activated non-Debye-type relaxation process [32]. Moreover, since the relaxation frequency, fr, is inversely proportional to the relaxation time, τr, the relaxation time decreases with increasing temperature. In figure 8, the inverse temperature dependence of the ln τr is shown for the PAr composites. The temperature dependence of the relaxation time follows the Arrhenius relation

where τ0, Ea, and kB correspond to the pre-exponential factor, activation energy, and Boltzmann constant, respectively. By calculating the slope of the linear fit lines given in figure 8, activation energies of the PAr composites containing MWCNTs were found to be between 0.033 and 0.088 eV. According to Yakuphanoğlu et al these low activation energy values can be associated with the occurrence of intermolecular conduction processes in the materials [33].

Figure 7. Temperature dependence of the real and imaginary parts of the complex impedance for Par + 1.5 wt% MWCNT and Par + 7.5 wt% MWCNT composites.
Download figure:
Standard image High-resolution image
Figure 8. ln τr versus 1/T and activation energies EA of PAr/MWCNT composites.
Download figure:
Standard image High-resolution imageThe Nyquist plots (plotting  versus
  ) of the PAr and the PAr composites are given in figure 9. It is observed that the development of a semi-circle in the Nyquist plot is only hinted when the temperature increases from 296 K to 373 K for PAr (figure 9(a)). On the other hand, as shown in figures 9(b)–(e), regardless of the MWCNT content and operating temperature, the composites exhibit single depressed semicircles. The occurrence of a single semicircle also implies that single relaxation processes occur in these materials. The equivalent circuit of the composites can be considered as a parallel-connected resistor and capacitor circuit. Additionally, since the centers of these semicircles are below the real axis of the complex impedance, the relaxation process can be considered as non-Debye type. Moreover, the MWCNT addition significantly decreased the diameter of the semicircles at each temperature operated, and increasing temperature decreases the size of the semicircle. This also corresponds to the reduced bulk resistance of the samples.
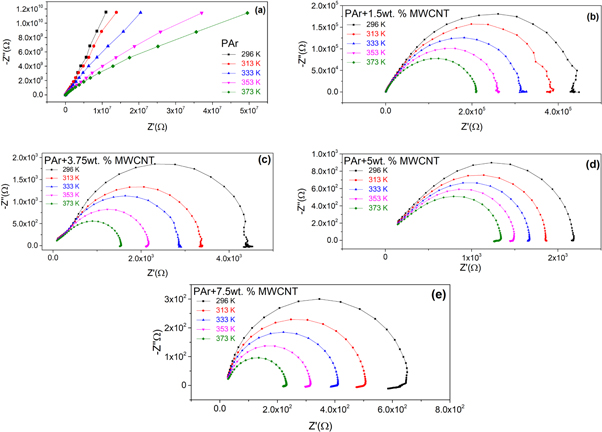
Figure 9. The Nyquist plots of (a) PAr, (b) Par + 1.5 wt% MWCNT, (c) Par + 3.75 wt% MWCNT, (d) Par + 5 wt% MWCNT, and (e) Par + 7.5 wt% MWCNT composites.
Download figure:
Standard image High-resolution image3.3. Complex permittivity analyses of the samples
The complex permittivity properties of the samples are described by

where the real part of the function ( ) defines the energy storage and the imaginary part of the function (
 ) represents the dielectric loss behavior of the samples. The variation of the real part of the complex permittivity as a function of frequency at room temperature for PAr and PAr/MWCNT composites are given in figure 10.
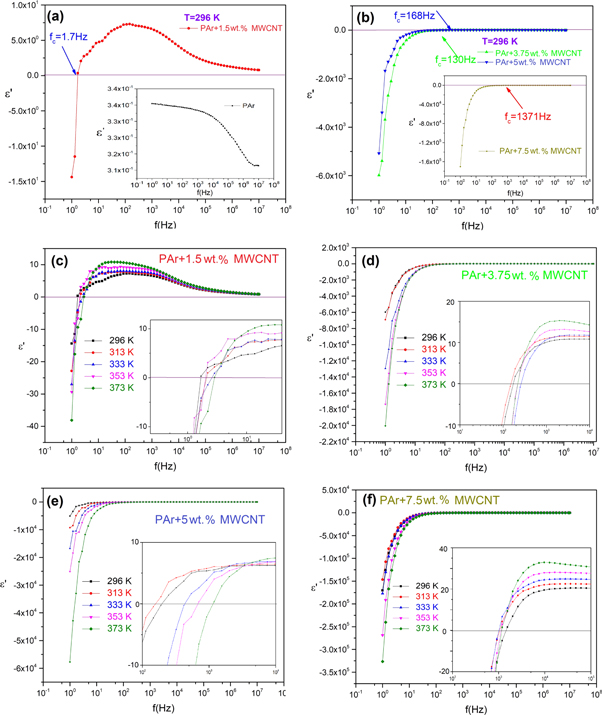
Figure 10. Frequency dependence of the real part of permittivity of (a) PAr and Par + 1.5 wt% MWCNT, (b) Par + 3.75 wt% MWCNT, Par + 5 wt% MWCNT, and Par + 7.5 wt% MWCNT composites at room temperature. The frequency dependencies of the real part of permittivity of (c) Par + 1.5 wt% MWCNT, (d) Par + 3.75 wt% MWCNT, (e) Par + 5 wt% MWCNT, and (f) Par + 7.5 wt% MWCNT at different temperatures.
Download figure:
Standard image High-resolution imageAccording to figure 10(a),  values for the PAr decrease with frequency and are positive at room temperature. Additionally, the MWCNT containing PAr composites display strong frequency dependence at low frequencies along with negative
  and almost frequency independent plateaus with positive
  at the mid and high frequencies. As is clearly seen from figure 10, the PAr composites have very low positive
  values compared to the negative
  values. Due to this reason, the positive
  values are appeared to be constant in the mid and low-frequency regions. In the light of figure 10, it was revealed that the addition of MWCNT to PAr induces negative permittivity in the composites, at least in the low-frequency range. According to Hilt et al the negative dielectric permittivity of the CNTs can be related to their metallic conductivity [34]. Moreover, the negative
  values that are observed in the low-frequency range for the PAr/MWCNT composites depend on the MWCNT content (see figures 10(a) and (b)). Additionally, by referring the frequency dependences of the real part of all samples at different temperatures given in figures 10(c)–(f), it was determined that a crossover frequency, fc, which represents a transition from
  to
to  state, can be defined for these composites. The variation of the fc depending on the MWCNT content and operating temperature is given in figure 11(a). As the MWCNT content increases in the PAr matrix, the frequency range, in which negative
  is observed, becomes wider at each spot temperature.

Figure 11. (a) Influence of the operating temperature and MWCNT content on the cross over frequency and (b) variation of the real part of the permittivity of PAr with both temperature and MWCNT content at 1 Hz.
Download figure:
Standard image High-resolution imageFurthermore, below fc,  becomes more negative with MWCNT addition. Depending on the MWCNT content and operating temperature, the change in the real part of the permittivity at the spot frequency of 1 Hz is shown in figure 11(b). For example, the PAr composites containing 1.5 wt% and 7.5 wt% MWCNT have values of
  and
and  at T = 296 K and at f = 1 Hz, respectively. A similar significant increase in the negative value of the real part of dielectric permittivity was determined at the other temperatures. As the MWCNT content increases in the PAr composites, the electrical conductive network becomes denser. As a result of the electrical network, the negative value of the permittivity of MWCNTs containing PAr composites is very high relative to that of the pure PAr. Similar behavior was also reported for Polypyrrole /MWCNT (PPy/MWCNT) composites by Kou et al [35]. Additionally, Ramasamy et al observed that PP/graphene nanocomposites exhibit negative real permittivity for the graphene concentration of 30 wt% below 480 Hz [3]. When their result is compared with PAr/ 7.5 wt% MWCNT composite's negative real permittivity, we achieved the negative
  below 1300 Hz for very low MWCNT addition concentration. Furthermore, the negative real permittivity was determined in Polyaniline/CNT (PANI/CNT) composites by Zhu et al. They reached the maximum negative
  as −2 × 10⁻³ for 5wt% CNT addition [36]. In our case, 5wt% MWCNT addition to PAr matrix leads to more negative real permittivity value (−5 × 10³). In the light of these results, MWCNT added PAr composites may be a promising candidate for probing metamaterial characteristics.
The notable increase in the real part of complex permittivity observed at low frequencies due to MWCNT addition can also be interpreted as the increase in the number of the accumulated charge carriers at the interfaces between the MWCNTs and the PAr matrix [2]. Therefore, a huge number of micro-capacitors are formed in the composites that lead to such an increase in the real part of permittivity [37].
The frequency dependences of the loss tangent of the complex permittivity of the PAr and the selected composites are shown in figure 12 for all temperatures. The tangent loss spectrum of PAr has a peak with very low intensity in the order of 0.013 at frequencies between 105 Hz and 107 Hz depending on the operating temperature (figure 12(a)). When 1.5 wt% MWCNT is added to PAr, the related high-frequency peak of pure PAr disappeared, while a sharp negative and then a positive peak appeared in the vicinity of 1.7–3 Hz in the loss tangent spectra at all temperatures (figure 12(b)). Similar negative and positive peaks were also observed for the other composites, but at different frequencies and intensities (figures 12(c) and (d)). At all tested temperatures, the frequency, at which the tangent delta values switch from negative to positive values, covers the related cross over frequencies summarized in figure 11(a). According to Yao et al the observation of such peaks in the loss tangent versus frequency curves is an indicator of the formation of resonance in the material [38]. Pendry et al considered the negative permittivity found in the artificially synthesized negative refractive index materials as a consequence of the plasma-like resonance of free electrons [39]. Hence, this resonance was induced into the PAr matrix by the incorporated MWCNT which results in negative permittivity. From this point of view, both the metallic nature of the MWCNT and the plasma oscillations of the delocalized electrons provided the negative permittivity to the PAr. Hence, the negative permittivity phenomenon observed in the composites containing carbon-based nanostructures can be discussed in the context of the Drude model [35, 40].

Figure 12. Variation of the tangent loss at different temperatures varying from 296 K to 373 K for (a) PAr, (b) Par + 1.5 wt% MWCNT, (c) Par + 5 wt% MWCNT, and (d) Par + 7.5 wt% MWCNT.
Download figure:
Standard image High-resolution imageAccording to the Drude model, the complex permittivity is defined by equation (4):

In equation (4),  is the plasma frequency (
 where N is the charge carrier density, e is the charge of the electron, and
  is the electric permittivity of free space), ω is the angular frequency of the electric field applied, and γ represents dissipation due to damping the plasma oscillations in the material [41–43]. When the dissipation is negligible, the real part of complex permittivity can only be negative if
  is greater than the angular frequency of the external electric field.
As is seen in our experimental results for PAr, the real permittivity is positive at all frequency range. The positivity of  is due to the limited number of free electrons per unit volume (N) since PAr is an insulating material. From this point of view,
  is always smaller than the angular frequency of the applied electric field (
 ). Hence, the ratio of
  is less than 1 and
  in the whole frequency band for PAr. When 1.5 wt% MWCNT is added to the PAr matrix, the number of free electrons per unit volume (N) starts to increase due to the formation of a conducting network. This effect results in the increase of
  that lead to observe the ratio of
  which is greater than 1 at low frequencies. As a result, negative
  values were observed at low frequencies for 1.5 wt% MWCNT added PAr composite. On the other hand, when the MWCNT content in the PAr matrix reaches 7.5 wt%,
  becomes much greater than 1 and very high negative permittivity values were detected between a wider frequency interval compared to the Par + 1.5 wt% MWCNT composite. In this respect, it can be deduced that addition of MWCNT has a significant effect on the plasma frequency of the composite and increasing MWCNT contribution enhances the plasma frequency by increasing the number of charge carriers in the material. In this respect, composites, which exhibit the negative permittivity at different frequencies, should have higher conductivity at the corresponding frequencies compared to pure PAr.
The frequency dependences of the imaginary component of the complex permittivity of the samples are shown in figure 13. The imaginary part of the complex permittivity of pure PAr is relatively small (10−3) in the studied frequency range. In the low-frequency region, it increases with increasing frequency up to approximately 105 Hz and then decreases rapidly, and reaches a value of zero in the high-frequency region at room temperature. Additionally, the frequency where the peak is observed in the  versus frequency curve shifted toward higher frequencies with increasing temperature. Moreover, it was determined that the relaxation peaks observed in pure PAr at the high frequencies disappear in the composite containing 1.5 wt% MWCNT for all investigated temperatures along with a significant increase in the order of
  (104) in the low-frequency region (figure 13(b)). The increase in the magnitude of the imaginary part of the complex permittivity is also observed for the other composites containing higher percentages of MWCNT (3.75 wt%, 5 wt%, and 7 wt%) at all investigated temperatures (figures 13(c), (d)). In the light of all these frequency and temperature responses of the materials' permittivity, the dielectric relaxation of these materials can be considered as thermally activated.
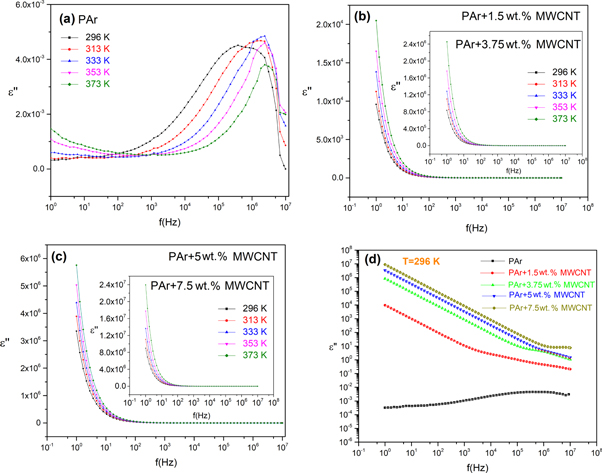
Figure 13. The frequency dependence of the real part of complex permittivity at different temperatures for (a) PAr, (b) Par + 1.5wt% MWCNT and Par + 3.75wt% MWCNT, (c) Par + 5wt% MWCNT and Par + 7.5wt% MWCNT, and (d) the variation of the frequency dependence of  with MWCNT content at room temperature.
Download figure:
Standard image High-resolution imageOn the other hand, according to Wang et al [44], the imaginary part of the  can arise due to DC (direct current) conductivity, interfacial polarization, and orientations of dipoles in such composite systems. These effects are combined in the definition of
  given in equation (5):

where  corresponds to DC conductivity,
  and
and  are the static and high-frequency dielectric permittivities, and
  represents the relaxation time [45]. As is known, when
  is dominant due to DC conductivity, it manifests itself as a straight line with a slope of '−1' in the frequency spectrum of
  As shown in figure 13(d), the
  versus frequency curves of the MWCNT containing PAr composites at room temperatures show straight lines with the slope of approximately '−1' (−0.96, −0.99, −1.00, and −1.01 for 1.5%, 3.75%, 5%, and 7.5% MWCNT, respectively) in the low and mid-frequency regions. Similar slopes were observed for the composites at other temperatures. From this point of view, the pre-dominant dielectric loss at the related frequencies is mainly due to DC conduction of the composites. On the other hand, as the frequency increases to high frequencies, the slopes of the related curves deviate from '−1' and accordingly the dielectric loss is mainly caused by the polarization at high frequencies for these composites. Otherwise, as shown in figure 13(d), the dielectric loss in pure PAr arises dominantly from the dielectric polarization at all frequencies.
3.4. AC conductivity analyses
The complex conductivity ( ) is defined in terms of its real and imaginary parts (
 and
and  respectively) by equation (6)

 is also considered as the AC conductivity and is calculated by

According to Jonscher's power law, the AC conductivity can be divided into two parts: the frequency-independent component ( ) and the frequency-dependent component (
 where A is a constant and s is a temperature-dependent frequency exponent, which takes values between zero and one) [46]. The temperature dependence of the frequency exponent s indicates the AC conduction mechanism in the materials since it identifies the degree of interaction between mobile carriers and environments surrounding them [47].
To figure out the dominant conduction mechanism of the samples, the angular frequency dependence of the real part of the complex conductivity was investigated in detail. The variations of  the samples with ω are shown in figures 14(a)–(e) for different temperatures. Pure PAr displays a strong linear frequency dependence in the whole frequency interval at all temperatures. Additionally, it was determined that the pure PAr's frequency-dependent conductivity does not change with temperature. On the other hand, the MWCNT containing PAr composites have two different conductivity dependencies on the angular frequency. The composites exhibit frequency-independent DC conductivity at the low and mid-frequency ranges followed by a strong frequency-dependent region at the high-frequency region at all studied temperatures. Moreover, the frequency interval at which the DC conductivity is observed is widening as the MWCNT percentage increases from 1.5 to 7.5 wt%. The DC conductivity values of the samples were calculated by extrapolating the ln
  versus ln ω curves to ω = 0, and are shown in figure 14(f) for different temperatures. As the MWCNT content enhances in the PAr matrix, the DC conductivity increases significantly. It is clearly seen that all MWCNT containing samples are above the electrical percolation threshold which is lower than 1.5 wt% and can be estimated to be about 1.1 wt%.
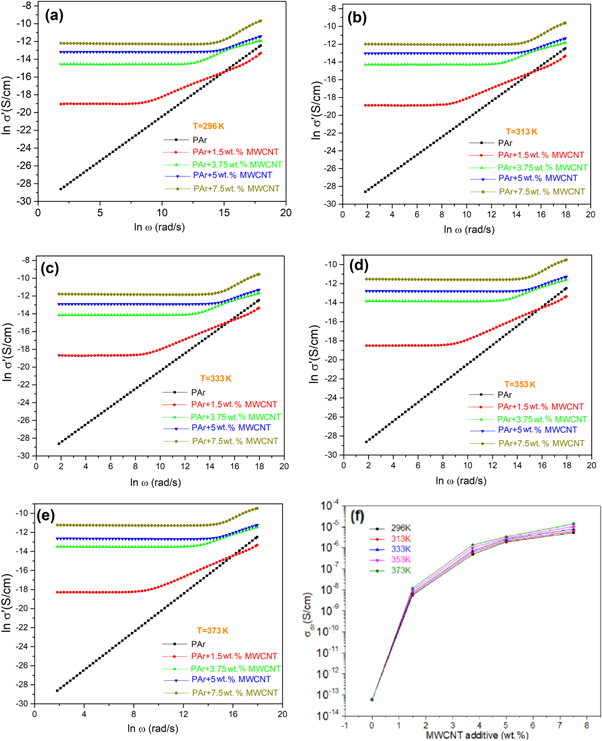
Figure 14. The angular frequency dependence of the sample's real part of the complex conductivity σ' in natural logarithmic scale for (a) 296 K, (b) 313 K, (c) 333 K, (d) 353 K, and (e) 373 K. (f) The variation of σDC with MWCNT content and temperature.
Download figure:
Standard image High-resolution imageIn figure 15(a), the linear relation between ln σDC and the inverse of measuring temperature is shown for the composites. Since the curves shown in figure 15(a) obey the Arrhenius relation, the related activation energies could be calculated. The activation energies vary between 0.06 and 0.117 eV. Such low activation energies determined from DC conductivity also imply hopping conduction for the charge carriers' transport in the composites. To determine the dominant AC conduction mechanism in the samples including PAr, the high frequency s parameters were calculated from the slope of the curves given in figures 14(a)–(e) for all temperatures. The variation of the s parameter with temperature for the samples is illustrated in figure 15(b). The s parameter of the pure PAr is temperature independent and has a value of 1, while the s parameters of the composites are decreasing with increasing temperature and vary with the MWCNT content. However, the decrease of the s parameter with temperature is lower in the composites containing 3.75 wt% and 5 wt% MWCNT compared to 1.5 wt% and 7.5 wt% MWCNT addition.

Figure 15. (a) The Arrhenius plots of DC conductivity, and (b) the temperature dependence of the frequency exponent s (acc. to equation (7)).
Download figure:
Standard image High-resolution image
From this point of view, the dominant AC conduction mechanisms are considered to follow the Nearly Constant Loss (NCL) model [48] for the pure PAr and the Correlated Barrier Hopping (CBH) model for the PAr composites. In the NCL model, which was observed to fit in different material families, the AC conductivity depends linearly on frequency [49, 50]. NCL model also indicates a negligible angular frequency dependence of  [47]. Additionally, this model represents a localized hopping of charge carriers without any significant translational motion. In this context, the AC conductivity mechanism in the pure PAr can be interpreted as the localized small hopping without leaving its site. On the other hand, CBH model which is observed in the MWCNT added PAr composites implies that a carrier charge transport is performed by hopping mechanism from one site to another, which is separated by a potential barrier, Wb. Ultimately, the MWCNT addition results in a translational charge carrier motion by performing hopping mechanism due to the existence of the conductive network in PAr matrix.
4. Conclusions
In this study, the effect of the addition of MWCNTs to a PAr matrix on the AC impedance, complex permittivity, and AC conductivity was investigated within the frequency interval of 1 Hz and 10 MHz at different temperatures between 296 K and 373 K. PAr/MWCNT composites containing different MWCNT contents varying from 1.5 to 7.5 wt% were prepared by melt compounding. The structure and morphology of the PAr/MWCNT composites were investigated by using Fourier transformed infrared (FTIR-ATR) spectroscopy, atomic force microscopy (AFM), x-ray diffraction (XRD) techniques, and light microscopy. The AC impedance of the PAr/MWCNT composites exhibited a negative temperature coefficient making the materials suitable for use in temperature sensor applications. Additionally, the AC impedance results showed that MWCNT addition increases the electrical conductivity of the PAr. The complex permittivity studies of the samples revealed that the MWCNT filler provides negative real permittivity to the PAr in the low-frequency to the mid-frequency regions, depending on the concentration of the filler. Negative real permittivity is an exotic property of materials and one characteristic of metamaterials. Moreover, by increasing the MWCNT percentage in the PAr matrix, the absolute value of the negative permittivity can be enhanced significantly and also the frequency interval, where the  property is observed, can be extended to the 1 kHz region. From this point of view, PAr based materials with desirable negative real permittivity value can be fitted to the desired frequency by choosing the right MWCNT percentage. The
  property of the composites was also discussed by considering the plasma oscillations of the delocalized electrons in the context of the Drude model. Furthermore, the AC conductivity investigations pointed out that pure PAr displays strong frequency-dependent AC conductivity which indicates NCL model behavior for the whole frequency band, while PAr/MWCNT composites exhibit DC conductivity in the low and mid-frequency bands and AC conductivity at the high frequencies band that can be associated with CBH model behavior. In conclusion, the PAr/MWCNT composites may be utilized as source material for both temperature sensor applications and as model for meta-material investigations.
Acknowledgments
The authors would like to thank Helfried Kunath for sample preparation and Andreas Janke for AFM measurements of samples. This research did not receive any specific grant from funding agencies in the public, commercial, or not-for-profit sectors. Additionally, Dolunay Şakar Daşdan thanks the IPF Dresden for providing a grant for a research stay at IPF Dresden.