
Abstract
In this work graphene oxide has been functionalized using Para chloro benzoic acid (PCBA). Three different concentrations of PCBA were used for functionalization on the GO surface. Functionalization was confirmed by the study of X-ray diffraction (XRD) and Fourier transform infra-red spectroscopy (FTIR) characterization. Raman characterization was used for the study of defects on the functionalized GO surface. Langmuir–Blodgett technique was used for the deposition of a thin film. This deposited layer was used as a sensing layer for the detection of ammonia gas. Aluminum contacts were made for electrical measurement using thermal evaporation technique and annealed to obtain a good quality of contacts. The sensor behavior was observed for all three concentrations of PCBA and it has been observed that increase in PCBA concentration leads to the high sensor response and the maximum response was observed for the higher concentration of PCBA i.e. 75 mM. The senor was tested for different gas concentrations varied from 100 ppm to 1200 ppm. Also the selectivity and long term stability of prepared devices has been investigated.
Export citation and abstract BibTeX RIS

Original content from this work may be used under the terms of the Creative Commons Attribution 4.0 licence. Any further distribution of this work must maintain attribution to the author(s) and the title of the work, journal citation and DOI.
1. Introduction
Ammonia gas generated from various industries and chemicals is the main source of environment pollutants and long term exposure of this causes serious health problems to human beings [1–3]. Detection of ammonia is also very important in many fields like industry, Medical application and indoor air quality monitoring. Consumption of ammonia can cause tears, horse voice, chest tightness, headache, vomiting, fatigue and some cases leads to the respiratory distress syndrome [4]. Some conventional methods like chromatographic and spectroscopic techniques were widely used for tracking down the toxic gases [5–7]. But these methods have some limitations; spectroscopy method has poor sensitivity and chromatographic method involves complex sample preparation [8–11]. Thus there is a need of simple and highly sensitive, portable gas sensors. Variety of metal oxide gas sensors are used for detection of dangerous gases but these devices needed high temperature for their operation [12].
In recent years Graphene based sensors (grapheme/rGO) dragged the attention of research groups [13–16] due to its outstanding properties like superior thermal conductivity [17], large surface area and excellent electronic transport properties [18, 19]. Schedin et al [20] explained the sensing mechanism of graphene based sensors and observed the sensor response for nitrogen dioxide and ammonia gases. Chemically reduced graphene oxide ammonia gas sensor [21] was fabricated and effect of reduction time on sensor response, response time and recovery time were studied. Leenaers et al [22] investigated the physical adsorption of pristine graphene with different gas molecules (NH3, CO, H2O, NO2, NO using DFT calculations. In defiance of huge application potential, graphene in its pure form has the drawback of poor dispersibility in various solvents and low sensitivity in sensing application. In recent years combination of graphene and metal oxides was used effectively to boost the sensing characteristics [23–26]. RGO/SnO2 hybrid ammonia gas sensor was reported by R.Ghosh et al [27]in which the effect of SnO2 concentration on RGO was observed with enhanced response and good selectivity of the sensor. ZnO nanowire reduced graphene oxide nanocomposites based ammonia gas sensor was prepared by T.Wang et al [28] which demonstrates excellent response, good stability and short response and recovery time as compared with RGO or ZnO based ammonia gas sensors. C.Wang et al [29] reported rGO-Graphene hybrid ammonia gas sensor with high sensitivity of 2.8% for 0.5 ppm concentration of ammonia with detection limit of 36 ppb. Graphene decorated with metal nanoparticle has also been used for gas sensing application. A ternary composite of Pd/SnO2/RGO was reported by Su et al [30] for ammonia gas sensing application. Y Zhou et al [31] reported ternary rGO/TiO2/Au composites and demonstrates the effect of RGO and UV illumination on the sensing behavior of the composite. H Tail et al [32] studied the ZnO/rGO bilayer as a sensing film for the excellent ammonia sensing with fast response and recovery time. However it's very difficult task for a sensor to diagnose the mixture of gases.
Among different synthesis techniques mass production of graphene has been achieved by chemical route [33–35]. Graphene oxide is used as the starting material for the bulk synthesis of graphene in chemical synthesis method. Apart from graphene, GO also provide an excellent base for some exciting applications in the field of gas/bio sensing [36, 37] and water desalination [38]. The outstanding properties of GO like, dispersibility in water and other solvents [39], large scale fabrication possibility [40], large surface area [41, 42] and availability of different functional groups on surface [43] has attracted the interest of research groups. It has been reported that GO surface consists of single sheet with different types of hydrophilic functional groups attached (e.g. epoxy, hydroxyl and carboxyl groups) which helps in binding target gas molecules [44]. The oxygen functional groups present on GO surface decreases the conductivity of GO. Therefore, to increase the conductivity of GO further processing is required on GO surface. Surface modification using covalent functionalization is a promising method for enhancing the electrical properties of GO for gas sensing applications. The functionalized Graphene oxide has widely used for the detection of gases like H2S, NO2 and acetone etc [45, 46]. Functionalizations not only boost the physiochemical characteristics but also enhances the electrical, mechanical, thermal and dispersion properties of GO [47, 48]. Many research groups have worked on the molecular adsorption of gas molecules on the GO surface and find out that residual oxygen or oxygen containing groups provide the active defects sites through reduction and modification of GO surface and therefore leads to the enhanced sensor response [49–51]. Several groups reported the change in structure and characteristics of GO after functionalization. Yu et al [52] reported the effect of surface modification of graphene on the electrical and electrochemical characteristics. Fluoride functionalized GO was also used for excellent gas sensing applications [53]. Sysoev et al [54] observed the effect of fluorine and hydroxyl species in adsorption of ammonia and nitrogen dioxide gases on graphene layers. Zhu et al [55] compared the sensors response of textured substrate GO and planer substrate GO in the range of 5 to 100 ppm of ammonia concentration and observed a enhanced response in textured GO because of large surface area for efficient adsorption which demonstrate the effect of micro structured GO film on the sensor response.
In the current research scenario, there is still a wide scope for efficient functionalization of GO surface for improved material characteristics. In the presented work, the surface of graphene oxide (GO) has been functionalized using esterification reaction to attach the Para Chloro benzoic acid (PCBA) group on the surface. The thin films of GO and functional GO were then used in ammonia gas sensing application. The sensor response was compared with pristine GO and it has been observed that the functionalized sensor exhibits good response, repeatability and good selectivity towards ammonia.
2. Experimental section
2.1. Synthesis of GO and functionalized GO (BGO)
Graphite powder, Sodium nitrate and Sulphuric acid (H2SO4) (5g:10g: 230ml) were poured into the flask and mixed together using magnetic stirring in ice bath [56]. 30 gram of Potassium permanganate (KMnO4) was added into the above mixture with continue stirring for half an hour. Addition of Potassium Permanganate is exothermic reaction and results in a raise of temperature of overall solution. So addition of potassium permanganate must be performed slowly and mixture should be placed in ice bath during this step. After 25 minutes of continue stirring raised the temperature to 90 °C. After two hours, 150 ml of DI water was added into the mixture. To complete the reaction 30% H2O2 was also added into the solution. For purification purpose the above solution was washed with DI water many times. Finally the Synthesized Graphene Oxide (GO) was dried overnight at 60 °C.
Functionalization of GO was done using esterification reaction in the presence of some catalysts (like HOBT and DCC). In order to observe the effect of PCBA concentration on the GO characteristics, three different PCBA concentrations (15 mM, 50 mM and 75 mM) have been used. Functionalized graphene oxide was synthesized by mixing PCBA in DMF under constant stirring for 1 h to get homogenous solution. In a separate beaker GO was mixed in DMF and ultrasonicate the solution. These separately prepared solutions were mixed together under constant stirring for half an hour. Now, the solution was placed into the water bath and maintained the temperature at 60 °C under constant magnetic stirring for further 2 h. DCC and HOBT were added into the solution under constant stirring and maintained the temperature at 60 °C for 24 h. After that, centrifugation was used to separate the liquid and solid part. Solid part was again added into DMF/DI water and centrifuged several times to remove side products. Change in the color from brown to black was occurred which indicates some reduction of graphene oxide after the functionalization [57]. BGO material thus obtained was placed in oven at 70 °C to remove moisture. Equation (1) represents the formation of ester. In this reaction (–OH) group of graphene oxide and (–COOH) group of benzoic acid reacts with the help of coupling agent and form the ester group. Where R'OH represents the graphene oxide with –OH group attached and RCOOH represents the Para chloro benzoic acid with –COOH group.

2.2. Material characterization
Fourier Transform infrared spectroscopy (FTIR) was used to study the surface functional groups present on GO and functionalized GO using Perkin Elmer model spectrum 65 system. Pellets of the synthesized material were formed by mixing with KBr powder and scanned from wave number 4000 to 500 cm−1. X-ray diffraction (XRD) was used for structural characteristics of GO and functionalized GO using x-ray diffractometer (XPERT-PRO Diffractometer) in the 2θ range from 5° to 40° with step size 0.01° steps s−1. Raman spectroscopy (Renishaw In Via Raman microscope) has been used for the analysis of structural defects.
2.3. Fabrication of sensing device
The standard cleaning process of RCA (Radio Corporation of America) was used for the cleaning of contaminations like organic, inorganic, metal and native oxide etc from silicon wafer surface. SiO2/Si was used as a substrate for sensor preparation. Sensing film of the functionalized Graphene oxide (BGO) was prepared by Langmuir-Blodgett (LB) technique. The LB has the advantage of good quality of thin films over other deposition methods (e.g. sol-gel, spin coater). 20 mg of the BGO was dispersed in 20 ml of DMF by ultrasonication for several hours to achieve good homogenous suspension. Low temperature annealing of the thin films were done in order to obtain good quality of the layer and good adhesion to the substrate. For electrical study of the prepared device aluminum contacts were made using vacuum coating system.
2.4. Experimental setup and measurement
For the measurement of current voltage characteristics Keithley 2400 source meter was used. L-B deposited thin film of BGO was used as a sensing layer. The prepared sample was tested in exposure of ammonia gas using two probe method. Response of the prepared device was recorded for different ammonia gas concentration at room temperature (∼30 °C). Sensor response of the prepared device is calculated by the equation (2):

Where Rgas and Rair = sensor resistance in target gas and in air environment respectively.
The response of the sensor was recorded for different ammonia concentration varied from 100 to 1200 ppm.
Figure 1 shows the experimental set up for the sensing characteristics.

Figure 1. Set up used for electrical measurement.
Download figure:
Standard image High-resolution image3. Results and discussion
3.1. X-Ray Diffraction
The X-ray diffraction (XRD) spectra of pristine GO and BGO was shown in figure 2. The XRD spectra of GO shows a sharp diffraction peak at 2θ = 10.5° with the interlayer of 8.3 Å. The increase in interlayer distance from 3.3Å in case of graphite [56] to about 8.3Å for GO is due to the introduction of various functional groups by the oxidation of graphite. The main diffraction peak of graphite exiting at 2θ = 26.4° is absent in diffraction pattern of GO which confirms the oxidation of graphite.
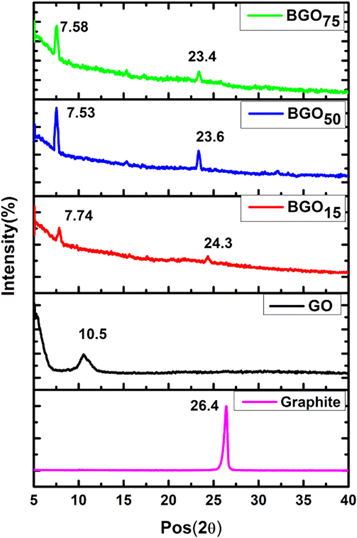
Figure 2. Shows the x-ray Diffraction of GO and BGO.
Download figure:
Standard image High-resolution imageAfter functionalization the diffraction peak of GO shifted toward lower angle and interlayer spacing increases in BGO. For all three concentration of PCBA corresponding shift in diffraction peak and interlayer distance was shown in table 1.The shift in diffraction peak of BGO15, BGO50, BGO75 were 2θ = 7.74°, 7.53° and 7.58° respectively. This shifting of main diffraction peak confirms the functionalization of graphene oxide with PCBA. The large value of interlayer spacing implies more attachments of functional group on the GO surface after functionalization. This increase in'd' spacing confirm the attachment of PCBA on the surface of graphene oxide.
Table 1. Interlayer spacing ('d') and Peak position (2θ) obtained from XRD for Graphite, Graphene oxide and BGO samples.
| Parameter | GR | GO | BGO15 | BGO50 | BGO75 |
|---|---|---|---|---|---|
| Peak (2θ) | 26.43 | 10.56 | 7.74 | 7.53 | 7.58 |
| d-spacing(nm) | 0.33 | 0.83 | 1.08 | 1.16 | 1.15 |
Table 2. Intensity ratio (Id/Ig) of GO and BGO calculated from Raman spectra.
| Sample name | Intensity ratio(Id/Ig) |
|---|---|
| Graphene Oxide | 0.96 |
| BGO15 | 1.01 |
| BGO50 | 1.02 |
| BGO75 | 1.32 |
3.2. Fourier transforms infrared spectroscopy:
Fourier transform inferred spectroscopy (FTIR) is a useful tool to enlighten the covalent attachment between GO and PCBA. FTIR spectrums of pristine GO and BGO with all concentration of PCBA have shown in figure 3. In the FTIR spectra peaks seen at 1588 cm−1, 1309 cm−1, 1043 cm−1 was due to C=C vibrations, C–O stretching vibrations and C–OH/C–O–C vibrations of the alkoxy groups respectively [58–60]. Absorption band near 1740 cm−1 was due to the C=O stretching of the COOH groups. After functionalization the new peaks in all BGO samples at 1632 cm−1, 1630 cm−1, 1632 cm−1 was observed due to the characteristics carbonyl C=O Stretching. Peaks occurred at 2852 cm−1 and 2946 cm−1 was due to the symmetric and anti symmetric –CH2 vibrations [61]. The characteristics peak near ∼3120 cm−1 in GO was due to OH stretching which become narrow after functionalization (peak near 3326 cm−1 in BGO) due to esterification reaction. Moreover the peaks at near 1240 cm−1, 1248 cm−1, 1245 cm−1 and 1632 cm−1, 1630 cm−1, 1632 cm−1 confirm the creation of ester group.
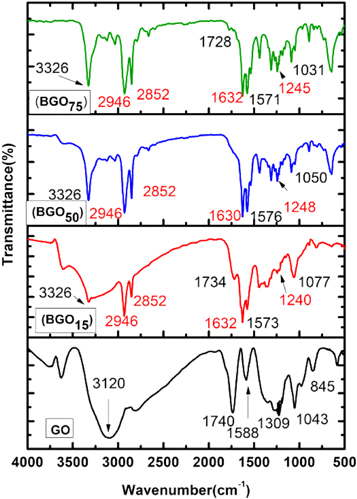
Figure 3. FTIR spectroscopy of GO and BGO.
Download figure:
Standard image High-resolution image3.3. Raman spectroscopy
Raman spectrum for both GO and BGO were shown in figure 4. This technique is used for characterization of carbon materials [62]. The G and D band peak in GO was observed near 1582 cm−1 and 1350 cm−1 respectively. The sharp G and D band was observed in GO which indicates that the bonds are uniform in nature. The intensity ratio (Id/Ig ) of D and G band gives estimation about the defects densities. Id/Ig ratio was calculated and found to be 0.96 in GO as shown in table 2.

Figure 4. Raman spectroscopy of GO and BGO samples.
Download figure:
Standard image High-resolution imageAfter functionalization, the G band was shifted at 1588 cm−1, 1590 cm−1, 1600 cm−1 for BGO15, BGO50, BGO75 respectively which indicates the shifting of sp2 bonded carbon atom. The D band of BGO was occurred near 1341 cm−1, 1343 cm−1, 1342 cm−1 in case of BGO15, BGO50, BGO75 respectively. The 2D and D + G peaks was also observed in all BGO samples; these peaks indicate the increased disorder and restoration of sp2 carbon in BGO. The intensity ratio Id/Ig of BGO samples was calculated and found to be 1.01, 1.02, 1.32 for BGO15, BGO50 and BGO75 as shown in table 2. Increase in intensity ratio further proves increase in disorder and defects in BGO.
3.4. Gas sensing characteristic of BGO
3.4.1. Sensing study
The fabricated samples of pristine GO and BGO i.e. BGO15, BGO50 and BGO75 were characterized for various ammonia concentration (100 ppm to 1200 ppm) as shown in figure 5. As shown in figure 5(a) the pristine GO shows little respsone towards ammonia gas at 100 ppm. The response of GO has incresed after the functionlaization. All BGO samples have enhanced response as compared with pristine GO. However sensor response of sample BGO75 was observed to be higher than samples BGO15 and BGO50 as shown in figures 5(b)–(d). At low ppm the response of the sensor was low due to the less number of ammonia molecules available for adsorption on the sensor surface. As concentration of ammonia molecules increases, response of the sensor also increases. The reason of this increased response might be due to the more physisorption at defects sites and chemisorptions of ammonia molecules via making hydrogen bond with ester group on the surface of BGO, which increase the response of the sensor. Both these facts help in increased trapping of gas molecules and therefore lead to the higher response of the sensor. Table 3 shows the sensor response of all functionalized GO at 100 ppm and 1200 ppm. Figures 6(a)–(c) and table 4 represents the comparison of slope and Adj. R square value of the functionalized sensors.

Figure 5. (a) Shows the response of the sensor (a) GO (b) BGO15, (c) BGO50 and (d) BGO75 with time.
Download figure:
Standard image High-resolution imageTable 3. Gas sensor response of all concentration of PCBA at 100 ppm and 1200 ppm concentration.
| Sample Label | Sensor Response(%) at 100 ppm | Sensor Response (%) at 1200 ppm |
|---|---|---|
| BGO15 | 4.0 | 14.8 |
| BGO50 | 5.3 | 17.3 |
| BGO75 | 6.7 | 18.9 |
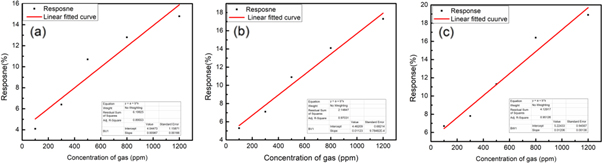
Figure 6. (a) Linear fitted response of the sensor (a) BGO15, (b) BGO50 and (c) BGO75 with different ammonia concentration.
Download figure:
Standard image High-resolution imageTable 4. Comparison between Slope and Adj.R square values of gas sensor response (100–1200 ppm).
| Name of the Sample | Adj. R2 | Slope |
|---|---|---|
| BGO15 | 0.89 | 0.009 |
| BGO50 | 0.97 | 0.011 |
| BGO75 | 0.95 | 0.012 |
3.4.2. Gas sensing mechanism
The resistance of the pristine GO increases in the exposure of ammonia gas which indicates its p type behavior. GO in the presence of ammonia gas shows little resistive response because of the sp3 configuration on GO surface which leads to the blocking of Π electron transfer. Therefore the change in resistance was lower in case of pristine GO. The response of pristine GO thin films towards different concentration of ammonia was shown in figure 5(a). The interaction of sensing material and gas molecules can be boosted by the generation of chemically active defects. Functionalized GO have enough such defects which include structural defects and oxygen functionalities in carbon lattices [63]. The carbon vacancies and oxygen groups (ester) encourage the surface reaction with the ammonia gas molecules, which results in strong chemisorptions of adsorbates as compared to pristine GO/Graphene based materials in which physisorption occurs with comparatively minimal effect on the substrate electronic properties. When exposed to ammonia gas, resistance of the BGO decreases which suggests that the BGO behaves as an n-type material. Ammonia is known to be electron donor and donated the electrons when adsorbed on the surface of sensing material (BGO). Due to this electron donation the electron concentration in BGO increases. This increase in negative carrier concentration results in a decrease in overall resistance of the sensing material.
The ammonia molecules adsorption and dissociation on the functionalized GO (BGO) (shown in figures 7(a)–(d)) has mutated the electrical and structural characteristics and transferred the charge carriers from ammonia to functionalized GO [44].

Figure 7. Schmatic representation of BGO structure and ammonai adsorption (a) BGO structure before and after ammonia adsorption on holow sites (b) BGO with epoxide group and ammonia adsorption at C-top sites resulting in a NH2 and OH group (c) BGO structure with carbon vacancy and after ammonia adsorption at defects sites by dissocating into NH2 and H and forming bonds with carbon atoms (d) Hydrogen bonding via coordination of oxygen atom of ester group and hydrogen of ammonia (NH...O).
Download figure:
Standard image High-resolution imageFirst possibility of adsorption of gas molecules is the physical adsorption on the active sites of the sensing material. The NH3 molecule can be adsorbed at the defect sites on the surface of BGO. This type of arrangement leads to the physical adsorption of NH3 molecule at the surface as shown in figure 7(a). Second, the ammonia molecules may also interacts with the carbon defects and vacancy sites by dissociating into NH2 and H and chemisorbed on the available sites of the functionalized GO by forming bonds with the carbon atoms as shown in figures 7(b)–(c). Third, in addition of the above facts, the molecular interaction of NH3 with functionalized material also happened via hydrogen bonding with ester groups (NH...O) [64] as shown in figure 7(d).
Thus it may be possible that both physical adsorption and chemical adsorption via dissociation of ammonia molecules and forming bonds with BGO structure are the main reason of enhanced sensing response of the BGO.
3.4.3. Selectivity, long term stability and response and recovery time of the prepared sensor
Characteristics of the sensor like selectivity, long term stability and response and recovery time have also investigated for the prepared sensor. For selectivity measurement, the response of the sensor was observed in various environment like ammonia, propanol, chloroform, acetone and toluene as shown in figure 8(a). The response obtained for various gases such as ammonia, propanol, chloroform, acetone and toluene were 6.7%, 1.5%, 0.8%, 1.7% and 1.2% respectively It has been observed that the response of the functionalized GO (BGO) was maximum for ammonia gas, means that the prepared sensor is highly selective to ammonia gas. The long term stability of the sensor (800 ppm) was investigated for time duration of 30 days and found that resposne of the sensor was stable for one month. The response of the sensor remains unaffected for a period of 20 days. After 20 days there is slight decrement in the sensor resposne (<2%) upto 30 days. Therefore the fabricated sensor represents good long term stability as shown in figure 8(b). The response and recovery time of the sensor were shown in figure 9(a) and table 5 represents the response and recovery time of sample BGO75 at 1200 ppm concentration of ammonia gas. The definition of the response time is the time required to reach 90% of the steady final value and recovery is defined as the time required for recovering 90% base line value. For the fabricated sensor the response and recovery time is 80 s and 115 s respectively. It has been observed that the response of the prepared sensor is maintained after repaeted the cycle at 800 ppm when exposed to ammonia gas, which indicates that the functionalized GO (BGO) has a good repeatability property as shown in figure 9(b).
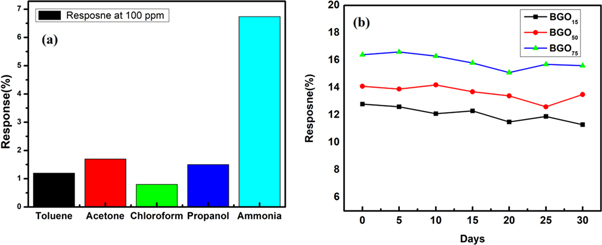
Figure 8. (a) Selectivity of the prepared sensor in different environment (b) long term stability of functionalized GO sensor (800 ppm).
Download figure:
Standard image High-resolution image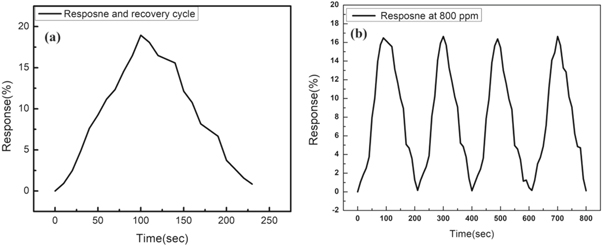
Figure 9. (a) Response and recovery cycle (1200 ppm) (b) repeatability cycle (800 ppm) of the sensor device BGO75.
Download figure:
Standard image High-resolution image
Table 5. Response and recovery time of functionalized GO (BGO).
| Sample Name | Response time (sec) | Recovery time (sec) |
|---|---|---|
| BGO75 | 80 | 115 |
4. Conclusion
Functionalization of the graphene oxide (GO) has been done with Para chloro benzoic acid. Functionalized GO (BGO) was characterized using XRD, FTIR and Raman spectroscopy. FTIR and XRD characterization confirmed the attachment of Para Chloro benzoic acid on the surface of GO. Functionalization causes increase in the number of defect sites as confirmed by Raman spectra which acts as a trap sites for gas molecules. Sensing characteristics were observed for both GO and BGO with different concentration of ammonia gas. It has been observed that the sesnor response of GO enhanced after the functionalization. It has been found that the sensor response varies from (6.7% to 18.9%) for high concentration of PCBA i.e. sample BGO75. Response and recovery time was also recorded for the sensor and was found to be ∼80 s and ∼115 s at room temperature. The selectivity measurements showed that the presented device is selective towards ammonia gas. The stability of the fabricated device was also recorded for 30 days.