
Abstract
In view of enhanced bioactivity and photocatalytic applications, the doped material has gained much attention and present study was focused on the preparation of Zn doped WO3 (Zn–d–WO3) via precipitation method. The prepared Zn–d–WO3 was characterized by Scanning Electron Microscopy (SEM), x-ray diffraction (XRD), Energy-dispersive x-ray (EDX). The effect of Zn concentration was studied on antibacterial, antifungal and photocatalytic activities along with structural and morphological variation. The Zn–d–WO3 was triclinic, spherical and rod shaped and particle size was decreased as the Zn concentration increased. The antimicrobial activity of Zn–d–WO3 was evaluated against a panel of bacterial strains (Escherichia coli, Pasturellamu ltocida, Bacillus subtilis, Staphylococcus aureus) and fungal strain (Aspergillus niger, Aspergillus flavus, Penicillium notatum). The Zn–d–WO3 showed promising antibacterial activity with minimum inhibitory concentration (MIC) values in the range of 211–387 (μg ml−1), whereas the antifungal activity was less than the standard (Fluconazole), which revealed that the Zn–d–WO3 are highly active against bacterial strains since activity was comparable with standard drug (Rifampicin). The photocatalytic activity (PCA) was evaluated by degrading methylene blue (MB) dye in an aqueous solution and dye degradation of 78% and 92% was achieved in 120 min under visible and UV irradiation, respectively. Results revealed that the Zn–d–WO3 could possibly be used as photocatalyst for the degradation of dyes in wastewater.
Export citation and abstract BibTeX RIS

Original content from this work may be used under the terms of the Creative Commons Attribution 4.0 licence. Any further distribution of this work must maintain attribution to the author(s) and the title of the work, journal citation and DOI.
1. Introduction
The properties of materials at nano level are entirely different due to behavior and interaction of atoms in a unique manner. The properties at nanoscale changed as compared to the properties of bulk materials [1–4]. The selection of proper method for the preparation of nanoparticles (NPs) depends upon binding sites specificity, compatibility with bio-molecules, solubility, shape, size, surface properties and degree of biodegradability. For many decades, the NPs have been used widely for different purposes and doping of metal oxides have been used to enhance the properties for applications in different fields like solar cells, photocatalysis and photodegradation and sensors etc [5–7]. NPs have been synthesized using different approaches and table 1 shows summary of methods employed for synthesis of WO3 NPs and their doping [8–17].
Table 1. Summary of methods used for the fabrication of tungsten-based NPs and application in different fields.
| NPs | Methods | Characterization | Application | References |
|---|---|---|---|---|
| Tungsten oxide-doped zinc oxide nanoparticles | Hydrothermal | Photocatalyst, degradation of Direct Blue 15 dye | [18] | |
| Tungsten-trioxide nanowire | Hydrothermal | Different size of NPs with hexagonal geometry | [19] | |
| WO3 NPs | Acid catalyzed co-precipitation method. | Spherical particles with average size ∼55 nm | Photocatalyst, degradation of MB dye | [20] |
| Tungstate with divalent transition metals | Precipitation | Photocatalyst, degradation of Methylene Blue (MB) and Methyl Orange (MO) | [21] | |
| W-ZnO nanocomposite | Sol-gel | Hexagonal wurtzite structure | Photocatalyst, degradation of MB dye | [22] |
| Zn-doped tungsten nanoparticles | Microwave irradiation | Spherical shape, 36–48 nm | Photocatalyst, degradation of MB and Rhodamine Blue | [23] |
| Sn-doped WO3 | Co-precipitation | Monoclinic, 22–44 nm | [24] | |
| Transition metal co-doped WO3 | Precipitation | Photocatalyst, degradation of Gentamicin and antibacterial agent | [25] | |
| Manganese doped tungsten oxide NPs | Microwave irradiation | Spherical, 35–40 nm | [26] | |
| ZnWO4 nanoparticles | Microwave irradiation | Wolframite, 10 nm | Photocatalyst, degradation of MB and Rhodamine Blue | [27] |
| ZnO nanorods with tungsten oxide | Hydrothermal | Monoclinic, 18–26 nm | Photocatalyst, degradation of endocrine disrupting chemicals | [28] |
| Zn–d–WO3 | Precipitation | Triclinic, spherical and rod shaped in nm range | Photocatalyst, degradation of MB dye, antimicrobial agent | Present study |
Precipitation method is an efficient approach used to form many types of semiconductors, metal deposited NPs and film coated NPs. In this method, colloidal solution is formed which act as precursor and coagulated into NPs [29]. The size, structure, doping efficiency and many other characteristics are characterized by SEM, XRD, FTIR, UV/Visible spectroscopy, thermal gravimetric analysis (TGA) and transmission electron microscopy (TEM) [30–37]. Nanotechnology has makes immense applications in different fields. In the field of medicine, nano-capsule are used to transmit drugs in the body at targeted place. The most treatments done by nanotechnology are tissue regeneration, bone repair, immunity, cancer treatment, diabetes cure and NPs are also active antimicrobial agents [38]. The nanotubes and nano-capsule are concentrated at the tumor part of the body that help in destruction of the tumor cells [18–20,24, 39]. The main drawback of ZnO as a photocatalyst is the absorption wavelength of material lies in ultra violet region. This causes excessive electron–hole recombination. Additionally, ZnO has the ability to promote photochemical corrosion [40]. The photocatalytic properties of ZnO may vary with particle size, morphology, and crystallinity of the materials. Modifications such as thermal treatment and/or doping the materials with other metals ions could enhance photocatalytic activity through limiting the recombination of electron–hole pairs and improving the absorption of light [41–47]. Under the current scenario of water pollution [48–55], there is need to prepare and utilized catalysts active under solar light to enhanced the cost effectiveness of catalytic process [56].
In view of aforementioned facts, the objective of the present study was to synthesize Zn–d–WO3 NPs using different concentrations Zn ions. The prepared Zn–d–WO3 was characterized by SEM, XRD and EDX techniques. Antibacterial, antifungal and photocatalytic activities were also evaluated.
2. Material and methods
2.1. Chemical and reagents
All the chemicals and reagents used during this research work were of analytical grade and were purchased from Merck and Sigma-Aldrich. Milli pure water (Milli Pure Water System) was used for the preparation of solutions.
2.2. Synthesis of Zn–d–WO3
Zn–d–WO3 was prepared by precipitation method. For this purpose, 0.1% solution of Zn(NO3)2 solution was prepared in 20 ml of 2-propanol and placed in a conical flask and stirred for 20 min at 70 °C on hot plate with moderate supply of water in condenser. After 20 min of stirring, 0.1 M solution of citric acid was added into the flask containing 0.1% solution of Zn(NO3)2 and again stirred for about 20 min. Then, 20 ml of distilled water was added to homogenize the mixture. Then NaOH solution was added to maintain the pH around 5. After 20 min when the solution was completely homogenized, 0.5 g of WO3 was added and stirred it for 7 h at 70 °C, cooled down and the solution was centrifuged for 20 min. The liquid portion was decanted and distilled water was added and centrifuged again for 20 min. After centrifugation, the solid material was filtered. The material was washed with water and then ethanol. The prepared material was dried into oven at 70 °C for 3 h and calcination was done at 700 °C for 5 h. To prepare Zn–d–WO3 at 0.2% and 0.3% concentration, the concentration of zinc nitrate and citric acid was 0.2 M and 0.3 M and the same procedure was adopted as used to prepare Zn–d–WO3 at 0.1% concentration (table 2).
Table 2. Synthesis of Zn–d–WO3 NPs at different concentrations.
| Metal used for doping | Zn (0.1 %) | Zn (0.2 %) | Zn (0.3 %) |
|---|---|---|---|
| Solvent | 2-propanol | 2-propanol | 2-propanol |
| Stabilizing Agent | Citric acid (0.1 M) | Citric acid (0.2 M) | Citric acid (0.3 M) |
| pH | 5 | 5 | 5 |
| Metal Precursor (WO3) | 0.5 g | 0.5 g | 0.5 g |
| Stirring Time (hours) | 4 | 4 | 4 |
| Centrifugation (rpm) | 2000 | 2000 | 2000 |
| Calcination (°C) | 700 | 700 | 700 |
2.3. Antibacterial activity evaluation
2.3.1. Selection of bacterial and fungal strains
For antibacterial activity, Escherichia coli, Pasteurella multocida, Staphylococcus aureus and Bacillus subtilis were used and for antifungal activity, Aspergillus niger, Aspergillus flavus and Penicillium notatum were employed. This was done by agar disc diffusion and minimum inhibitory concentration method.
2.3.2. Bacterial/ fungal, cultures preparation
Fresh cultures were prepared using growth media for bacterial (nutrient broth, Oxoid, UK) and fungal growth (potato dextrose broth, Oxoid, Uk). To avoid contamination standards sterilized condition were followed. Microbial cultures were stored at 4 °C and 1 × 10⁸ CFU/ml of cell cultures were used for disc diffusion and minimum inhibitory concentration studies.
2.3.3. Antimicrobial assay by disc diffusion method
Antimicrobial activity of WO3 and Zn–d–WO3 (with different concentration of Zn were tested against a panel of bacterial and fungal strains. Fresh growth media for bacterial and fungal growth were prepared and using wet sterilization method, media was autoclaved at 121°C for 15 min to avoid the risk of contamination. Wicks paper discs of size 9 mm were prepared and also sterilized. In each petri plate, 20 ml autoclave media (Nutrient agar for bacteria and potato dextrose agar for fungal) were poured and 20 μl of fresh culture of each tested microorganism were also added and mixed well, poured in petri plates and media was solidified. 100 μl of positive control Rifampicin as an antibacterial and Fluconazole for antifungal, WO3 and Zn–d–WO3 were placed on sterilized disc separately and with the help of forceps discs were laid flat on growth medium. The Petri plates were then incubated at 37 °C for 24 h (for bacteria) and at 28 °C for 48 h (for fungal strains). Sample having antimicrobial activity, inhibited the bacterial and fungal growth, shows clear zones, which were measured using zone reader in mm [57].
2.3.4. Minimum inhibitory concentrations (MIC)
For minimum inhibition concentration, serial dilution method was used for all tested samples. In 96 well plate, a volume of 100 μl of test material was placed into the first row of the labeled well plate. In all other wells 50 μl of growth media for bacterial and fungal growth were added separately. Using serial dilutions method, test samples were diluted in descending order and in last well test sample were discarded. As an indicator, 10 μl resazurin were added in each well and finally, 10 μl of tested microorganism culture (5 × 10⁶ CFU/ml) was added. In each plate one row for negative and positive controls were run. Finally, 96 well plates were rapped with aluminum foil to avoids dehydrated and incubated separately for bacterial and fungal on their optimum temperature, 37 °C for 24 h for bacteria and 28 °C for 48 h for fungal growth. After stipulated time period, the absorbance was measured at 500 nm. Any color change from purple to pink or colorless was recorded as positive. The lowest concentration at which color changes occur was taken as MIC value [58].

Figure 1. Structure of MB dye used for PCA study of prepared catalyst.
Download figure:
Standard image High-resolution image2.4. Photocatalytic activity (PCA) evaluation
The PCA of WO3 and Zn–d–WO3 was evaluated by degrading MB dye (Figure 1) under UV and visible light irradiation. For visible light, solar stimulator 150 W Xe Lamp was used, whereas medium pressure mercury lamp was used for UV irradiation. A 15 mg of catalyst was mixed with 100 ml of dye solution (0.6 g l−1) and irradiated to both UV and visible lights. Before irradiation, the dye-catalyst suspension was stirred for 30 min in dark followed by irradiation for 120 min. After 120 min of irradiation, 3 ml solution was taken, filtered and absorbance was recoded at 664 nm (CE Cecil 7200, UK) and percentage degradation was measured using relation shown in equation (1) (where C0 and Cf are the dye initial and final concentrations). All the degradation experiments were performed in triplicate and data was averaged.

3. Results and discussion
3.1. Characterization
The present study is focused on the synthesis, characterization and application (antimicrobial and photocatalytic) of Zn–d–WO3. The XRD patterns of Zn–d–WO3 are shown in figures 2(a)–(c). It was noted that the diffraction peaks of the Zn–d–WO3 indexed with PDF#83–0949. The obtained 2θ values with hkl values were observed at 16.75° (101), 23.63° (020), 24.92° (200), 27.67° (201), 29.75° (211), 32.52° (022), 34.46° (220), 36.16° (212), 43.45° (203), 47.28° (004), 48.64° (014), 52.17° (303), 57.13° (412), 60.04° (034), 62.97° (115), 64.06° (341). The lattice parameters of pure WO3 were; a = 7.3721 (Å), b = 7.5451(Å), c = 7.6142 (Å) and β = 90.892. XRD analysis revealed that the Zn–d–WO3 structure was triclinic, particle shape (spherical and rod shaped mixed) and the particle size was decreased as the Zn concentration increased from 0.1 to 0.3%. The crystalline size was less than 100 nm for Zn(0.1%)-WO3, which decreased for higher concentrations of Zn (0.2 and 0.3%). Moreover, no secondary phase (Zn or ZnO or WO3.H2O) was observed, this indicate the purity of prepared sample and Zn doped successfully with WO3. Moreover, the intensity of the peak decreased by decreasing the Zn concentration. The XRD of the prepared catalyst was also reported by other researchers [23] and they found an extra peak of WO3. In present study, Zn–d–WO3 did not show any extra peak, which revealed the purity of the sample. Therefore, the adopted synthesis route (precipitation) proved to be an excellent method for the synthesis of Zn–d–WO3. The prepared Zn–d–WO3 showed different morphology (the particle was spherical and rod shaped) and have very low grade of aggregation. In general, the catalyst formed is in well-ordered form and uniform. Other researchers also studied the surface morphology of Zn-WO3 prepared by different methods and it has been reported with high grades of aggregation and disorder morphology [36, 37, 59, 60] and similar morphology was reported by Samerjai et al [61] for platinum loaded tungsten films. The SEM images of the Zn–d–WO3 are shown in figure 3. It was observed that the concentration of the Zn affected the morphology and particle size of the Zn–d–WO3. The catalyst prepared at low concentration i.e., 0.1 M concentration showed less homogeneity, and at higher Zn concentration more homogeneity and less particle was observed, these findings are in line with reported observation by Liu et al [62]. At 0.3 M Zn concentration, the structure of Zn–d–WO3 was more regular with uniform morphology, which is also in line with Mohammidi et al [25]. These result showed the morphology of prepared material can be changed by changing the dopant concentration since smaller particle size and homogeneous morphology of Zn–d–WO3 was achieved at higher concentration of Zn. The activity and the selectivity of the synthesized particles are crucially depending on the microstructural modifications at different operational conditions [63]. The elemental composition of the Zn–d–WO3 was confirmed by EDX analysis. Three samples were prepared at 0.1 M, 0.2 M, and 0.3 M concentrations of Zn (figure 4). The elemental analysis revealed the presence of O, Zn, W, which is also an indication of sample purity. EDX analysis also revealed the change in concentration of elements in samples prepared at different concentration of Zn (0.1, 0.2 and 0.3%). Similar results was also reported in previous studies regarding synthesis of Mn-WO3 [26].
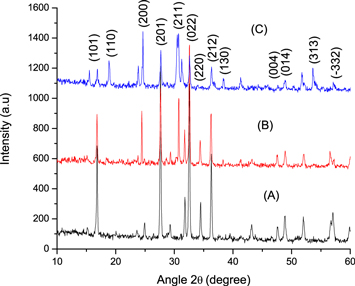
Figure 2. XRD analysis of the synthesized Zn–d–WO3 using different Zn concentrations.
Download figure:
Standard image High-resolution image
Figure 3. Scanning electron microscope (SEM) images of Zn–d–WO3 using different Zn concentrations.
Download figure:
Standard image High-resolution image
Figure 4. EDX analysis of the synthesized Zn-WO3 showing the elemental composition.
Download figure:
Standard image High-resolution image3.2. Antimicrobial activity
Antimicrobial activity of WO3 alone and with different combination of Zn (0.1%, 0.2% and 0.3%) was evaluated against Gram positive (Bacillus subtilis and Staphylococcus aureus and Gram negative (Escherichia coli and Pasturella multocida) bacterial strains. Similarly, antifungal activity was also evaluated against fungal species i.e., Aspergillus niger, Aspergillus flavus and Penicillium notatum by disc diffusion. The MIC was also estimated of WO3 and Zn–d–WO3 (Zn 0.1%, 0.2% and 0.3%). Zn–d–WO3 showed promising antibacterial activity again panel of Gram-positive and Gram-negative strains. The antibacterial activity trend was in following order; Escherichia coli > Pasturella multocida > Staphylococcus aureus > Bacillus subtilis (figure 5). The values of zones of inhibition were recorded to be 26 ± 4.69 > 24 ± 6.18 > 21 ± 1.35 > 18 ± 1.34 for Escherichia coli > Pasturella multocida > Staphylococcus aureus > Bacillus subtilis, respectively for Zn(0.3%)-WO3, which is 25 to 30% more potent in inhibiting the bacterial growth versus WO3 alone. Similar result of antibacterial activity of WO3 nanodots were also reported by [64] and [25]. The antifungal analysis revealed that WO3 alone and Zn–d–WO3 did not show significant antifungal activity against selected fungal strains in comparison to standard (Fluconazole). The MIC of tested samples (WO3 and Zn-WO3 with Zn 0.1, 0.2 and 0.3%) were also estimated and it was observed that the Zn(0.3%)-WO3 showed 20 to 25% lower concentration to inhibit bacterial growth as compared to WO3 alone (figure 6). Results revealed that the antimicrobial activity of WO3 can be enhanced by combining it with Zn metal since synergistic effect was observed to reduce the bacterial load. However, in case of antifungal activity, Zn-WO3 did not show promising efficiency. Similar to present investigation, previous studies also documented similar findings i.e., Zn-doped SiO2 NPs also showed excellent antibacterial activity, whereas the antifungal activity was low versus standard [36], which revealed the possible application of NPs as an bioactive agents [9, 65, 66].

Figure 5. Zone of inhibition (mm) of Zn–d–WO3 with different concentration of Zn against a panel of bacterial strains and fungal strains.
Download figure:
Standard image High-resolution image
Figure 6. Minimum inhibitory concentration (MIC, μg/ml) of Zn–d–WO3 with different concentration of Zn against a panel of bacterial and fungal strains.
Download figure:
Standard image High-resolution image3.3. Photocatalytic activity (PCA)
To evaluate the PCA of Zn-WO3, methylene blue (MB) dye was degraded under UV and visible light and responses are shown in figures 7–8. The MB dye degradation under both UV and visible light was promising. Also, the PCA was changed as a function of Zn contents i.e., 0.1%–0.3% combination with WO3. The maximum dye degradation of 78% and 92% was achieved for visible and UV irradiation in 120 min of reaction time. Results revealed that PCA of Zn-WO3 was promising under both UV and visible light, however, the effect of UV was greater than the visible light. The Zn–d–WO3 at different concentration of Zn showed different PCA for MB dye degradation. These findings are in line with previous studies that doping can enhanced the PCA of metal oxides i.e. Madhan [23] synthesized pure and Zn composite with tungsten NPs under microwave irradiation. MB and rhodamine B in aqueous solution was used to check the PCA of the pure and Zn composite with WO3. The results show that the PCA of pure WO3 was much less versus Zn (10 wt %) composites with WO3. Similarly, Upadhyay [24] also prepared Sn-doped WO3 materials using sodium tungstate dehydrate sodium (Na2WO4·2H2O) as precursor and stannic tetrachloride was used for doping. The WO3 and the crystal size were in the range of 22–44 nm having monoclinic structure, which also showed efficient PCA. Mohammadi et al [25] prepared pure transition metal co-doped WO3 NPs. Precipitation methods were used to prepare these fine materials. The fabricated sample, (Zn, Cu, co-doped WO3) NPs showed 3.2, 3.12, 3.08, and 2.97 eV of band-gap and average sizes with 18.1, 23.2, 25.7 and 30.2 nm. Gentamycin antibiotic was used to check the PCA of these NPs under UV and visible light. The PCA of Zn, Cu co-doped was much higher. So, it was found that the PCA of the WO3 NPs can be enhanced by doping [13, 67] with metal ions like Zn and Cu.

Figure 7. Percentage degradation of MB under visible light (top) and under UV irradiation (bottom).
Download figure:
Standard image High-resolution image
Figure 8. Spectra of degraded and un-degraded MB dye under (A) Visible and (B) UV light irradiation.
Download figure:
Standard image High-resolution imageThe mechanism for PCA of ZnO NPs, and interaction in degradation of MB has been shown in figure 9. Initially, in the process of photodegradation, the MB dye was adsorbed by the ZnO NPs followed by light induced excitation to become MB*. The basic mechanism of the photocatalytic reaction is the generation of the electron-hole pair (e−/h+) which occurs within a material on illumination. The energy greater than the band gap, promotes electron from the valence band to the conduction band, thus creating an electronic vacancy or hole in the valence band. That is, electron-hole pairs, which generates hydroxyl radicals (·OH) and superoxide ions and these species act as powerful oxidizing agents to mineralize the dye in to CO2 and H2O [68–73].

Figure 9. Mechanism showing the photocatalytic degradation of dye.
Download figure:
Standard image High-resolution image
4. Conclusions
Zn–d–WO3 was prepared successfully by precipitation method at different concentration of Zn precursor, which was confirmed by advanced characterization techniques such as SEM, XRD, EDX. The prepared Zn–d–WO3 showed triclinic structure and particle size was decreased as the Zn concentration increased. The Zn–d–WO3 showed promising antimicrobial activity against E. coli, P. ltocida, B. subtilis and S. aureus versus standard (Rifampicin). The MIC against set of bacterial strains was in the range of 211–387 μg ml−1. The antifungal activity was also checked, but in comparison to standard (Fluconazole), the Zn–d–WO3 did not show considerable activity against A. niger, A. flavus and P. notatum. The PCA of Zn–d–WO3 was evaluated by degrading MB dye under UV and visible irradiation and Zn–d–WO3 showed promising PCA, which was slightly less under visible light irradiation. In view of promising PCA, Zn–d–WO3 could possibly be used as a photocatalyst for the degradation of dyes in wastewater.