

Abstract
The wear behaviour of the TiNi alloy tested at different conditions (2 and 4 N as applied loads and 40, 50 an 60 wt % as nickel contents) was investigated. For this purpose, two main experimental techniques consisting of wear and indentation tests were used. Scanning electron microscopy (SEM) and laser source profilometry were employed to reveal the wear mechanisms and the affected worn surfaces. Furthermore, design of experiments planning introducing factorial design as well as response surface was adopted to attempt predicting the coefficient friction according to the planned test parameters. Nanoindentation results showed that all the TiNi alloys are harder than a TA6V4 alloy which is commonly used in dental implant. Particularly, the TiNi60 alloy exhibited superior superelasticity, characterized by a lower E/H ratio and a higher depth recovery ratio than the TA6V4 alloy. Besides, the wear rates underwent a substantial increase with the increase of the applied load but a decrease with increasing the Ni content. The worn surfaces analyses revealed an enhanced resistance to adhesive and abrasive wear with increasing nickel content.
Export citation and abstract BibTeX RIS

Original content from this work may be used under the terms of the Creative Commons Attribution 3.0 licence. Any further distribution of this work must maintain attribution to the author(s) and the title of the work, journal citation and DOI.
1. Introduction
Titanium alloys are attractive for critical application such as aerospace industries, automotive, energy industries and biomedical [1–3]. The field of biomaterials is an important research area that has rapidly developed in recent decades, particularly when conducting studies on the TiNi alloy, which is considered as a promising material for clinical applications.
Indeed, titanium alloys are of considerable interest in biomedical applications, such as dental implants and orthopedic surgery because of their attractive properties such as good superplasticity and mechanical strength, a modulus of elasticity similar to that of bone, adequate biocompatibility, and high corrosion resistance in body fluids compared with other metallic biomaterials [4–6].
Especially, TiNi alloys exhibited a higher wear resistance than conventional materials such as steels, and Co-based tribo-alloys and thus became a potential candidate for tribological applications [1, 7–11].
The wear characteristics of dental implants are very important because a low wear resistance can cause the loosening of the implant. It is therefore important to understand the wear behaviours of this kind of alloys. In this respect, several works have been done. Neupane and Farhat [12] studied the effect of loading rate on the superelastic behavior of a TiNi alloy and a new 60NiTi shape memory alloy under indentation loading. They found that latter alloy exhibits superior wear and dent resistance, as well as higher hardness than the equiatomic TiNi. More recently, the same authors [8] in a study conducted on the superelastic TiNi reported improved wear and dent resistance attributable to low E/H and high elastic recovery ratio. In another work, Farhat and Zhang [13] compared the micromechanical and tribological characteristics of the superelastic TiNi alloy with those of pure TiNi alloy and AISI 304 stainless steel using a dry sliding wear and friction tests. They found that superelastic TiNi alloy has a higher wear resistance than AISI 304 stainless steel, although having a similar hardness.
On the other hand, Li and Liu [14] compared the sliding wear behaviour of the Ti-50.3 wt% Ni alloy with a 2Cr13 steel, claiming that the TiNi alloy had much higher wear resistance than steel, although having lower hardness. The higher wear resistance of the TiNi alloy is thought attributable to its so-called pseudo-elasticity that is caused by reversible martensitic transformation.
Moreover, Wang et al [11] investigate the sliding wear behaviors of TiNi alloy having three different phases (i.e., austenitic, martensitic and dual phase state). The authors found that the austenitic TiNi alloy has exhibited the highest wear resistance than the martensitic TiNi alloy. On the other hand, Rominiyi et al [15] investigated the effect of nickel addition on the microstructure and wear behaviour of spark plasma sintered CP-titanium, asserting an improved resistance to adhesive and abrasive wear with increasing nickel content. Li [9] evaluate the sliding wear performance of TiNi specimens with comparison to a 304 stainless-steel, revealing a lower volume losses of TiNi alloy than that the 304 steel by one order of magnitude.
The aim of the current study is to investigate the superelastic behaviour of the TiNi alloy with different Ni content (i.e., 40, 50 and 60 wt% Ni) subjected to sliding wear and indentation tests. Besides, the methodology of the experimental plans was adopted to predict the coefficient of friction (COF). In addition, for For comparative purposes, similar investigations have been made on the TA6V4 alloy.
2. Materials and methods
2.1. Specimen preparation
TiNi samples were obtained by melting in an inductive furnace from the mass mixtures of titanium metal powder and nickel whose compositions are 40, 50 and 60 wt% Ni. After melting the samples were heat treated (annealed) at 800 °C for 2 h and cooled in the furnace under vacuum to prevent oxidation. The TA6V4 which is customarily utilized as material for dental implant was used for comparison purpose. Afterwards, the samples were polished using 400, 600, 800, 1000, 1200, 2400 and 4000 grit SiC abrasive paper and then finished with 1 μm diamond suspension.
2.2. Characterizations
2.2.1. Indentation test
To gain a deep understanding of the effects of the Ni content on the mechanical properties of the processed alloys, indentation tests were conducted using a Nanoindenter XP with a Berkovich diamond pyramid indenter at ambient temperature. The Olivier and Pharr analysis method [16] is used to assess both the hardness and Young's modulus of the alloys. The load used is 50 mN. The determination of these two performed under a load of 50 mN required an average of 20 tests for each material.
2.2.2. Tribological test and experimental methodology
The wear tests were conducted without lubrication at the ambient temperature in accordance to the ASTM G99-95a. A pin-on-disc tribometer (CSM Instruments) with a counter bodies as a alumina ball with 6 mm-diameter for a total sliding distance of 20 m. The friction coefficient was recorded automatically during the test thanks to the Tribox 4.49 data acquisition software. To predict the coefficient of friction (COF), the friction tests were conducted according to the factorial planning model 22 according to the combinations shown in table 1.
Table 1. Coded factors for the tribological tests.
| Levels | |||
|---|---|---|---|
| Coded factors | Imput paraeters | −1 | +1 |

|
Load Py (N) | 2 | 4 |

|
Nickel content (%) | 40 | 60 |
The mathematical model used is a polynomial model of the first degree [17] with the interactions expressed as below equation (1)

Where:
 constant coefficient of model;
 coefficient of factor 1;
 coefficient of factor 2;
 coefficient of term
 Response.
The wear volume was estimated using 3D profilometry image (laser source profilometer, Cyber Technology CT100), by measuring the surface profile of the wear track. The morphology of the worn surfaces, were analyzed by means of a scanning electron microscopy (Quanta250-FEI).
In addition, the indentation and the tribological behaviours of the TiNi alloys were compared with other conventional materials, TA6V4 alloy tested at room temperature and at identical processing conditions.
3. Results and discussion
3.1. Indentation behavior
Figure 1 shows typical indentation curves expressed as load versus displacment performed on all TiNi and TA6V4 alloys. As can be seen, all the alloys underwent elastic and plastic deformation, along with some residual deformation remaining after unloading [18]. From these curves, it clearly appears that the three TiNi alloys are more resistant to plastic depth of penetration than the TA6V4 alloy.
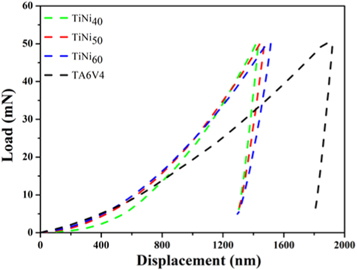
Figure 1. Load–depth curves obtained by nanoindentation tests under maximum load of 50 mN for both TiNi and TA6V4 alloys.
Download figure:
Standard image High-resolution imageThe average values of E, H, and E/H ratio as well as the depth recovery ratio are listed in table 2. The indentation induced superelasticity effect can be characterized by the depth recovery ratio by using equation (2) [2]:

Where:
-
 indicates the total penetration depth at the maximum load
 -
is the residual depth when the load returns to zero during indentation withdrawal.


Table 2. Mechanical properties of TiNi and TA6V4 alloys.
| Alloys | Young's modulus (GPa) | Hardness (GPa) | E/H | Depth recovery ratio |
|---|---|---|---|---|
| TiNi40 | 156 | 8.09 | 19.28 | 0.087 |
| TiNi50 | 135 | 8.96 | 15.06 | 0.098 |
| TiNi60 | 111 | 9.43 | 11.77 | 0.117 |
| TA6V4 | 147 | 5.08 | 28.9 | 0.035 |
According to table 2 it can be noticed that the increase in Ni content ranging from 40% to 60% induces a decrease of the elasticity modulus respectively from 156 to 111 GPa. However, the average value of the hardness increases with increase of nickel content, achieving a maximum value of 9.43 GPa for a content of 60% of Ni. This indicates the significant effect of Ni content on the elasticity modulus and hardness, thus the TiNi alloys are harder than the TA6V4 alloy (5 GPa).
Nanoindentation generates high stresses near to indenter point and large temperature gradients, resulting in the appearance of a transformation phase (Austenite-Martensite) [19]. It is observed from the mechanical properties (table 2) that, the TiNi60 alloy has a low E/H ratio and a higher depth recovery ratio, which suggests that its superelastic behavior is greater than those of the other two titanium alloys. This is confirmed by Neupane and Farhat [12] who reported similar observations on a Ni60Ti alloy.
3.2. Tribological behavior
3.2.1. Evolution of the coefficient of friction
Figure 2 displays the variation of the friction of coefficient (COF) ('f') for the TiNi and TA6V4 alloys as a function of the sliding distance under different applied loads of 2 and 4 N.

Figure 2. Evolution of the coefficient of friction versus sliding distance of TiNi and TA6V4 alloys under different loading: (a) 2 N, (b) 4 N.
Download figure:
Standard image High-resolution imageThese curves indicate two successive friction period. The first is the running in period during which the coefficient increases rapidly to reach a maximum value. This period is characterized by an important wear and plastic deformation of surface asperities. The second period corresponds to the stabilization of the friction coefficient whose value is maintained constant regardless of sliding distance. This step corresponds to the formation of solid wear debris (third body) during the sliding process [8, 20, 21]. The TA6V4 alloy generated a low value of the friction coefficient ('f') (table 3) compared to the TiNi alloys for both loads. This can be attributed to the formation of two TiO2 and Al2O3 oxides that tend to form on the worn surface of the alloy and will thereby effectively reduce the coefficient of friction [5]. The average friction coefficient values are shown in table 3.
Table 3. Mean COF Values for TiNi and TA6V4 Alloys.
| Alloy | COF (2 N) | COF (4 N) |
|---|---|---|
| TiNi40 | 0.68 | 0.65 |
| TiNi50 | 0.65 | 0.64 |
| TiNi60 | 0.64 | 0.63 |
| TA6V4 | 0.43 | 0.21 |
3.2.2. Effect of friction conditions (load and Ni %) on the coefficient friction 'f' in study field
The experimental results of wear tests have resulted in a relation between the studied response 'f' (Y) and the input parameters which are the applied load 'Py' (X1) and the Nickel percentage 'PNi'( X2), thus enabling, to predict the friction coefficient 'f' (Y) in study field. The prediction model of friction coefficient 'f' can be written in function coded factors (X1 and X2) (equation (3)) or in legal values (equation (4)).


The effect of the friction parameters (load 'Py' and Nickel % 'PNi') on the friction coefficient 'f' can be evaluated using the iso-responses curves (figure 3(a)). It appears that when the percentage of Nickel is at its maximum level and whatever the normal load applied, the friction coefficient decreases to a value of 0.63 for Py = 4 N. This can be explained by the fact that the increase in the load causes the formation of a large amount of wear debris, which accumulates in the contact zone and minimizes friction of two rubbing bodies. On the other hand, for the low levels of Py (X1) and PNi (X2) (figures 3(b) and (c)), the friction coefficient increases to reach the value of 0.68. This may be due to the low volume fraction of the intermetallic formed.
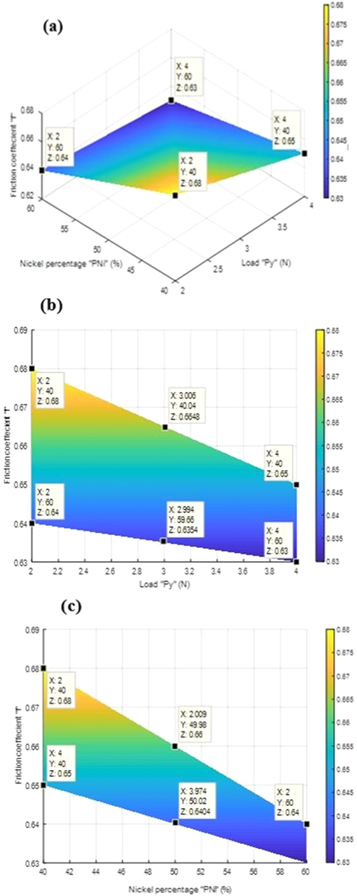
Figure 3. Isoreponses curves of TiNi alloys in the field of study, (a) variation of 'f' in function of Py and PNi, (b) variation of 'f' in function of Py, (c) variation of 'f' in function of PNi.
Download figure:
Standard image High-resolution image3.2.3. Wear rate
The wear rate was obtained by means of Archard formula [22]

Where:
 is the wear rate (mm3/N/m),
 is the wear volume (mm3),
 is the applied load (N),
 is the sliding distance (m)).
The values of wear rates obtained from the wear tests carried out for different alloys are reported in table 4. The experimental results seem to be confirmed by Archard's law according to which it is assumed that the volume of material lost is inversely proportional to the hardness value of the material [23]. Therefore, TiNi alloys do not show a significant weight loss compared to the TA6V4 alloy, which has a visibly higher wear rate value.
Table 4. Wear rates of different alloys for 2 N and 4 N Load.
| Alloy | Wear rate (2N × 10−4 mm3/N m−1) | Wear rate (4N × 10−4 mm3/N m−1) |
|---|---|---|
| TiNi40 | 2.92 | 3.51 |
| TiNi50 | 2.09 | 2.76 |
| TiNi60 | 1.33 | 2.29 |
| TA6V4 | 9.51 | 11.02 |
The effect of the independent parameters on the specific wear rate is illustrated by the three-dimensional simulation (3D) (figure 4). The results show that the wear rate increases with the increase in applied load. This results first in the increase of load, which causes an increase of pressure on the contact surface. Secondly, the high load applied may cause the breakdown of the protective oxide film formed on the surface of the sample due to the temperature rise induced by friction, while the increase in Ni content results in a decrease of the wear rate. This suggests that the amount of nickel in the alloys tested played an important role in their friction behavior.
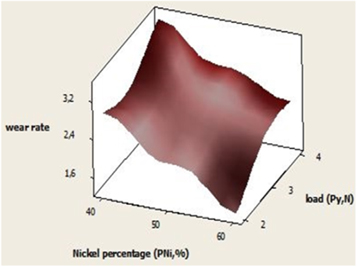
Figure 4. 3D response plot for wear rate (mm3/N m−1) versus The applied load and Ni percentage.
Download figure:
Standard image High-resolution imageThe TiNi60 alloy exhibited a low wear rate, due to its better superelasticity. The reason for improving the wear resistance of TiNi alloys over TA6V4 can be attributed to its lower E/H and higher recovery ratio (table 2). Recent studies have shown that wear depends strongly on the value of E/H, contrary to the traditional idea that considers hardness as the principal parameter controlling the wear mechanism [21]. The difference between the wear rate and the surface wear characteristics of the different alloys can be partly attributed to the difference in hardness and deformation process associated with the microstructural characteristics.
The wear tracks for the TiNi and TA6V4 alloys under load of 2 N and 4 N are shown in figures 5 and 6, respectively. Their wear morphology of the tested specimen at 2 N load depicts several grooves with different depths and widths. In addition, for the loading condition of 4 N, it is found an increase in the depth of wear grooves which can be a sign of the increase in the wear rate.
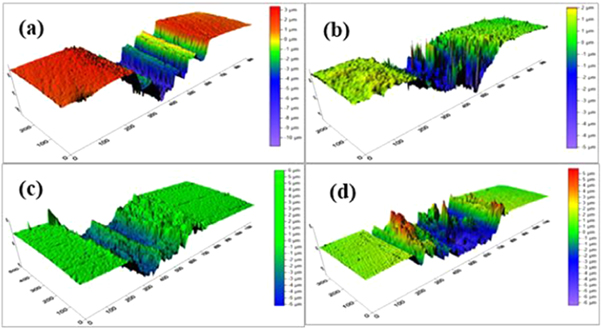
Figure 5. 3D images of the wear groove of the studied alloys tested under loading of 2 N, (a) TiNi40, (b) TiNi50, (c) TiNi60, (d) TA6V4.
Download figure:
Standard image High-resolution image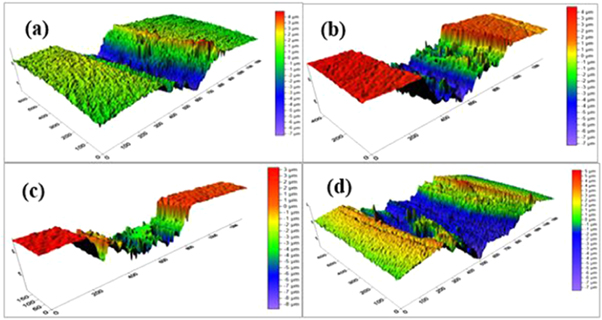
Figure 6. 3D images of the wear groove of the studied alloys tested under loading of 4 N, (a) TiNi40, (b) TiNi50, (c) TiNi60, (d) TA6V4.
Download figure:
Standard image High-resolution image3.2.4. Morphology of wear tracks
The SEM micrographs of the worn surface for the different TiNi and TA6V4, respectively, under charges of 2 N and 4 N (figures 7 and 8), reveal wear debris resulting primarily from the destruction of the surface asperities, as well as the degradation of hardened oxidized layers. These phenomena inevitably produce a third body involved in the process of surface degradation [20]. We note the presence of grooves parallel to the sliding direction, confirming abrasive wear mechanism. The latter is induced by hard phases (intermetallic and oxides) and by wear debris of deformed and plastically hardened parts of the alloy [5]. There is also a sign of delamination at the contact surface suggesting the presence of adhesive wear.
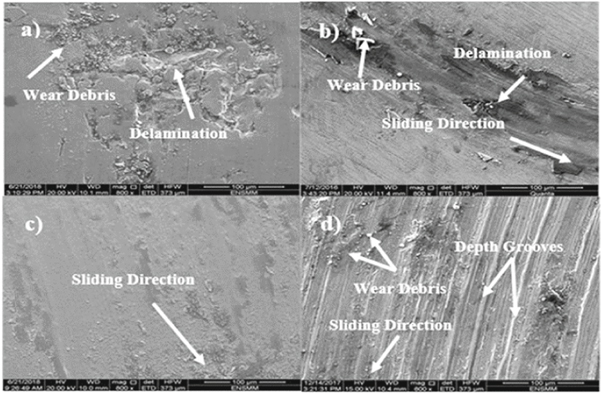
Figure 7. SEM micrographs showing the wear morphologies of the alloys after friction test under loading of 2 N, (a) TiNi40, (b) TiNi50, (c) TiNi60, (d) TA6V4.
Download figure:
Standard image High-resolution image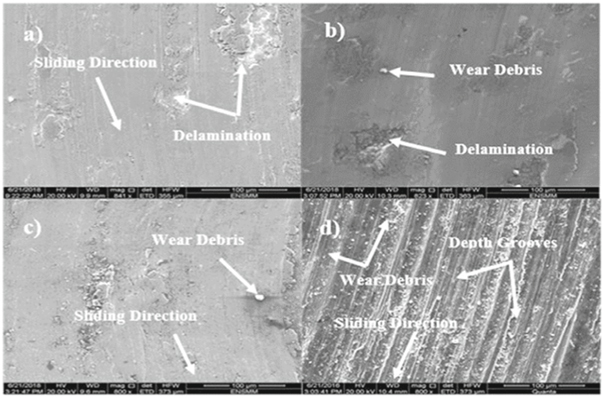
Figure 8. SEM micrographs showing the wear morphologies of the alloys after friction test under loading of 4 N, (a) TiNi40, (b) TiNi50, (c) TiNi60, (d) TA6V4.
Download figure:
Standard image High-resolution image
4. Conclusion
In this study, the superelastic behaviour of a TiNi alloy with different Ni contents (40, 50 and 60 wt%) and a TA6V4 alloy under dry sliding wear and indentation tests have been investigated. The experimental results obtained from friction tests using the methodology of factorial plans 22 contributed to quantitatively evaluating the wear rate. The following conclusions can be drawn:
- The developed mathematical model has made it possible to predict the coefficient of friction 'f' according to the test parameters (Py and PNi) in the study field. The coefficient of friction and the wear rate were found closely depending on these parameters.
- The isoreponses curves showed that when the two factors (Py, PNi) are at the highest level, the coefficient of friction (f) decreases. However, the increase in loading caused an increase in the wear rate that decreases as the percentage of nickel increases.
- All TiNi alloys exhibited a hardness value of about 1.5 times greater than that of the TA6V4 alloy, resulting in improved wear resistance of about 30%.
- All the TiNi alloys have a low wear rate for the two loading values resulting in better tribological behaviour over the TA6V4 alloy.
- Two wear mechanisms (i.e., abrasion and adhesion wear) were identified for both the TiNi and TA6V4 alloys.
Acknowledgments
The authors gratefully acknowledge Pr Beliardouh Nacer Eddine, Pr Boudenane Said and Dr Ramoul Chems eddine for their contribution in this work and all the staff of the Mechanical, Surface, Materials and Processes laboratory of Arts et Métiers-ParisTech University of Lille and all the personnel of the laboratories of URASM/CRTI-Annaba.