

Abstract
In this study, TiO2 nanoparticles (<50 nm) with two different mesoporous structures, the well-ordered mesoporous cylindrical pores, and slit-shaped pores, were successfully synthesized using ilmenite as the initial source of titanium. Initially, the Fe was leached out from the ilmenite structure using HCl; then the titanium was subsequently dissolved in an alkaline medium using H2O2 as an oxidizing agent. Afterward, the hexadecyltrimethylammonium (HDTMA) was used as the structure directing agent and the titanium solution was added to it in order to create a well ordered mesoporous structure. The synthesized cylindrical mesoporous nanoparticles of the synthesized TiO2 had a high surface area with very narrow pore size distribution. The photocatalytic characteristics of the synthesized mesoporous nanoparticles of TiO2 were analyzed and compared with those of non-porous nanoparticles of TiO2 having the same particle sizes. The well-ordered mesoporous nanoparticles of TiO2 indicated higher photodegradation activity to denature the tetracycline (TC) compare to slit-shaped mesoporous nanoparticles of TiO2 as well as the non-porous nanoparticles of TiO2.
Export citation and abstract BibTeX RIS
1. Introduction
Titanium dioxide (TiO2) is a photocatalyst with specific characteristics in degradation of environmental contaminants [1–6]. The separation or degradation of biological pollutants, in particular antibiotics, has been the concern of many researchers due to the high impact of these pollutants on the environment upon the emergence of new generation of antibiotic-resistant bacteria [7–9]. Many researchers have used TiO2 for photo-degradation of antibiotics [10–14]. TC is one of the most important antibiotics whose heavy consumption by humans and animals led to its excessive release into the environment [15]. In the process of TC degradation with TiO2, the effects of a number of factors, including light sources [16], presence of gas [17], and particle size of TiO2 nanoparticles [18] have been proposed to be pivotal in determining the rate and degree of degradation.
Many efforts have been made to provide reliable methods to synthesize TiO2 nanoparticles with a larger effective surface area [19–24] in order to improve the photocatalytic characteristics of TiO2 over different biological pollutants. [25–27] Different strategies have been adopted concerning the synthesis of TiO2 mesoporous nanoparticles [28, 29]. In these methods, various initial sources were used for titanium, including TiCl4 [30, 31], Titanium isopropoxide [32–34], Tetrabutyl orthotitanate [35–38], and ilmenite [39].
In our previous study [39] we have synthesized the TiO2 mesoporous (slit-shaped porous structures) nanoparticles using sol-gel and hydrothermal methods in the presence of hexadecyltrimethyl-ammonium bromide (HDTMA) surfactant. The ilmenite was employed as an initial source for titanium. An irregular slit-shaped mesoporous structure was also achieved with small nanoparticle sizes. In the present study, for the first time, TiO2 nanoparticles having a well-ordered mesoporous structure was synthesized using ilmenite as the titanium source. The mesoporous nanoparticles of the synthesized TiO2 were analyzed using different methods, including TEM and XRD analyses. Then, the adsorption properties and the photocatalytic degradation characteristics of the synthesized mesoporous nanoparticles of TiO2, were analyzed for degradation of TC. To make a close comparison, the results of the photocatalytic analysis were compared with those obtained from the irregular slit-shaped mesoporous nanoparticles of TiO2 and those achieved by the non-porous nanoparticles of TiO2 , also synthesized by means of ilmenite as a source of titanium.
2. Materials and methods
2.1. Chemicals
The ilmenite concentrate was supplied from the Kahnooj mine (south of Kerman, Iran) and was used as Ti-source. Hydrochloric acid (HCl, 37%), hydrogen peroxide solution (H2O2, 30%), nitric acid (HNO3, 65%), ethanol (EtOH, 99.9%), HDTMA (>97%), and sodium hydroxide pellets (NaOH, ≥97%) were all provided from Merck. The tetracycline hydrochloride (TC, BioReagent, T7660) was purchased from Sigma-Aldrich. Deionized water was used in all experiments with the resistivity of 18.2 MΩ (pH = 6.8, ρ = 1 g cm−3).
2.2. Synthesis of TiO2 nanoparticle
To synthesis nanoparticles of TiO2 from ilmenite concentrate, initially, the ilmenite concentrate was grounded by a planetary mill for 3 h at 400 rpm rotation speed and grinding media of stainless steel balls (15 and 10 mm with equal numbers) to ilmenite weight ratio of 10:1. Then the Fe from the milled concentrate was leached out using HCl 6 M. Typically, 300 ml HCl acid was preheated up to 100 °C and then 30 g of milled ilmenite was added to the acid with vigorous stirring. After 2 h of mixing, the slurry was centrifuged at 4000 rpm for 5 min and the supernatant was discarded. The leached solid was washed several times by dilute HCl acid (1 M) and deionized water and then dried at 80 °C. The residual Fe of dried solid was leached out again using HCl under the same condition as the first step. Afterward, the residual solid was reacted in an alkaline condition (by using the NaOH 1 M to adjust the pH at 9) in presence of H2O2 in order to leach out the Ti to create a titanium solution (Ti-sol) for preparation of mesoporous nanoparticles. In a typical experiment for preparation of Ti-sol, 5 g of leached solid (rich in Ti), digested by 42 ml of H2O2 30% in 8 ml of 1 M NaOH solution at different temperature of 40 and 70 °C. After 30 min of agitation, the slurry was centrifuged at 4000 rpm for 5 min and the Ti-sol (liquid phase) was separated from the residual solid. In all leaching steps, in order to prevent the evaporation, the reactions were done under a condenser system with anti-frizzing circulator.
In synthesis of non-porous TiO2 nanoparticles the Ti-sol was boiled with high vigorous agitating in order to TiO2 nanoparticles forms, and after centrifuging (5000 rpm, 10 min), nanoparticles were washed by diluted HNO3 in deionized water (3 v/v%). Finally, the precipitated powder was dried at 80 °C overnight and labeled as UM-Ti. For synthesis of mesoporous nanoparticles of TiO2, initially, desire amounts of HDTMA was dissolved in 125 ml of EtOH and deionized water mixture with volume ratio of 1:4 and agitated by a mechanical stirrer at room temperature for 2 h to form micelles. Then, the Ti-sol was added to the mixture drop-wise (0.6 ml min−1) and vigorous mixing was continued for 3 h in a beaker with baffle at room temperature. Four conditions were conducted to synthesis TiO2 mesoporous nanoparticles (which dictate the mesoporous structure formation) and are detailed in table 1. To improve the porosity and particle size of nanoparticles, the mixture was heated for 16 h in a Teflon lined autoclave at 120 °C. Finally, the solution with white powder was centrifuged at 5000 rpm for 10 min and then dried at 100 °C. The synthesized powder was calcined in a tube furnace (TF5/40-1250) at 400 °C for 5 h (the temperature was gradually increased to the desired one with the rate of 10 °C/min) with air flow with the rate of 15 lit/min. Scheme
Table 1. Details of the different synthesis condition of TiO2 mesoporous nanoparticles.
| Sample | Ti-Sol (ml) | Ti-sol preparation Temperature (ºC) | HDTMA (g) | HDTMA sol pH |
|---|---|---|---|---|
| UM-Ti | — | 70 | — | — |
| MTi-1 | 9 | 70 | 10 | 8 |
| MTi-2 | 9 | 40 | 10 | 8 |
| MTi-3 | 25 | 40 | 10 | 8 |
| MTi-4 | 9 | 40 | 5 | 8 |

Scheme 1. Experimental diagram of the TiO2 nanoparticles synthesis from ilmenite concentrate.
Download figure:
Standard image High-resolution image2.3. Kinetics of adsorption of TC on TiO2 nanoparticle
The kinetics of adsorption of TC onto different synthesized TiO2 mesoporous nanoparticles was done by mixing 30 ml of TC solution (1 mg ml−1) with 100 mg of TiO2 at 25 °C in dark. In order to determine the kinetics of TC adsorption on nanoparticles, in different durations, the amount of TC adsorbed onto TiO2 nanoparticles was calculated based on the mass balance.
2.4. Photocatalytic degradation experiments
Three TiO2 samples were selected for degradation experiment, the non-porous TiO2 nanoparticles, the slit shaped irregular mesoporous TiO2, and the well-ordered mesoporous TiO2 sample. For TC degradation experiment in the first set, similar amount of TiO2 samples (100 mg) were added to separate quartz tube and 10 ml of TC in water with initial concentration of 1 mg ml−1 was added to each one. In another tube, similar TC solution was added with no TiO2 as the control test and all were shacked in an incubator at room temperature. After reaching the equilibrium for adsorption of TC on each sample for 24 h under dark, the tubes were centrifuged and the concentration of TC in each tube was calculated spectrophotometer and the lowest desorbed TC concentration was chosen as the baseline and other samples were diluted to that concentration using fresh water. Finally, for all these samples with the same final concentration of TC an antimicrobial activity test was done. In the second set of experiments, the same procedure was done just after finalizing of the adsorption of TC on the TiO2 samples (24 h of mixing in dark), the tubes were centrifuges and the supernatant was discarded and 5 ml of fresh water was added and all four tubes were placed under the UV irradiation (6 Philips UV light, TL 4 W BLB 1FM, with 10 cm distance from the top) for two hours during the desorption test. The desorbed TC solution was diluted based on the results achieved from the first set of experiments and similar antimicrobial test was done on these samples as well.
2.5. Characterization and analytical
X-ray diffraction (XRD) analysis was used (Asenware: AW-DX300, China) in 2θ range of 4–80 degree, with step time of 1 s and step degree was set at 0.05 degree in each step using Copper kα anode irradiance source. X-ray fluorescence (XRF) analysis (Bruker: S4 PIONEER, Germany) was done on ilmenite sample. The total Fe weight fraction of remained solid after HCl leaching was evaluated by potassium dichromate titration method. The specific surface area and pore size distribution of the synthesized samples was measured by nitrogen sorption method (Belsorp-mini II, Japan) at 77 ºK (the samples were initially degassed at 150 °C for 5 h). The TiO2 nanoparticles morphology was determined by transmission electron microscope (TEM, Philips: CM120, Netherlands). Prior to carrying out the TEM analysis, the nanoparticles were dispersed in 20 ml absolute ethanol using an ultrasonic mixer and a drop of mixture was placed on the carbon grid and let dried under a light before analysis. The concentration of TC in the solution was measured using a UV-VIS spectrophotometer (Rayleigh: UV-1601, China) at the wavelength of 271 nm using a pre-calculated standard curve. Antimicrobial activity of TC was evaluated using agar-disk diffusion method. Muller Hinton agar plates were inoculated with 1.5 × 10⁻⁸ cfu.ml−1 inoculum of two different bacteria Staphylococcus aureus and Escherichia coli. Then, filter paper disc, containing the 300 μl of TC solutions, were placed on the agar surface and the petri dishes were incubated at 37 °C for 24 h and the inhibition zone was analyzed.
3. Results and discussion
3.1. Characterization of TiO2 mesoporous nanoparticles
The XRD results of the ilmenite concentrate (figure 1(a)) showed two main phases, i.e. ilmenite phase and the anorthite, the order of which indicated the priority order among them. According to the Rietveld method [40], the weight portion of ilmenite phase was estimated to be over 94%. The XRD results of the milled ilmenite (figure 1(b)) were compared with the original ilmenite sample as well. The results indicated that the anorthite phase was destroyed after milling; the main phase of the milled concentrate, the ilmenite phase, also showed that the anorthite structure was gradually destroyed during the milling process.

Figure 1. The XRD analysis of ilmenite concentrate: (a) fresh ilmenite, and (b) milled ilmenite (IL: ilmenite, AN: anorthite).
Download figure:
Standard image High-resolution imageBased on the XRF results (table 2), the traces of Fe, Ca, Al, Mg, and Mn were detected in the ilmenite concentrate. Comparing the XRF results with those of XRD revealed that Fe and Ti corresponded to the structural elements of ilmenite. Other elements mentioned above indicated the presence of some impurities, though in small amounts, corresponding to the anorthite in the ilmenite concentrate, detected in the XRD results.
Table 2. The XRF analysis of the ilmenite concentrate.
| Chemical | Fe2O3 | TiO2 | SiO2 | CaO | Al2O3 | MgO | MnO | Na2O | P2O5 | Other |
|---|---|---|---|---|---|---|---|---|---|---|
| Concentration (Wt.%) | 43.49 | 39.38 | 8.56 | 2.93 | 1.99 | 1.85 | 0.97 | 0.31 | 0.11 | 0.31 |
The ilmenite sample reacted with HCl twice in order to leach Fe out of the ilmenite structure. After the final leaching step, the total weight fraction of Fe in the solid sample was measured by the potassium dichromate titration method and was equal to 1.7 Wt%. According to equations (1) and (2), Ti was initially dissolved in HCl, gradually hydrolyzed to TiO2, and eventually precipitated [41]. The XRD analysis indicated that, after the HCl reaction (figure 2), the remained solid sample mainly consisted of rutile, Verifying the previous results [42, 43].


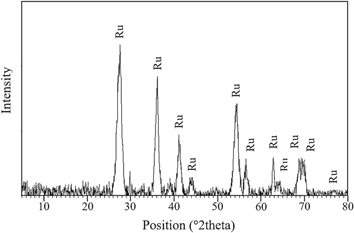
Figure 2. The XRD result of remained solid after HCl leaching (Ru: rutile).
Download figure:
Standard image High-resolution imageThe solid remained from the leaching process then reacted under alkaline conditions with the help of H2O2 as an oxidizing agent. According to the equation (3) [44], in these conditions, the O22− ligand from H2O2 created a coordination complex with Ti in the form of Nax(TiOy)(O2)z(OH)j, where x, y, z, and j were dependent on the alkaline leaching temperature, the reaction duration, and the Ti4+/Na+ ratio. The alkaline leaching reaction of Ti was exothermic, whose temperature reached 40 °C after 2 min of reaction. To control this raise of temperature, the container was wrapped in an ice bag. In another test, the temperature was increased to 70 °C in order to analyze the dissolution conditions of Ti, the results of which revealed that the amount of dissolution of Ti was greater at 40 °C compared to that at 70 °C, which could be due to the instability of H2O2 and hydrolysis of TiO2 [44].

After the alkaline leaching experiment, the leachate solution, which was rich in Ti, was named Ti-sol and used for the remaining experiments. The Ti-sol, achieved at 70 °C during the alkaline leaching experiment, was boiled to precipitate Ti in the form of oxidized titanium and then calcined at 400 °C. The XRD analysis on this sample (figure 3) revealed that the sample was predominantly in the anatase phase. Comparing the results with those obtained by Gharakhlou and Sarvi [39], indicated that the calcination temperature played an important role in determining the phase of the final product at pH of 9, Gharakhlou and Sarvi [35] found that calcination at 600 °C le to the formation of the rutile phase. The effects of calcination temperature on the final structure of TiO2 nanoparticles were also studied by other scholars, indicating that, during calcination at temperatures above 500 °C, the dominant phase was observed to be rutile [21, 45]. Hence, the findings of the present experiments were in line with the previously reported results [46].
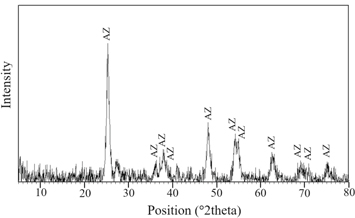
Figure 3. The XRD analysis of UM-Ti (AZ: anatase).
Download figure:
Standard image High-resolution imageAccording to equation (4) [44], upon thermal treatment (boiling at 96 °C under atmospheric pressure), the ligand-based Ti was hydrolyzed to (NaxH2-x)Ti2O5.2H2O. To prevent the agglomeration of the particles, the stirrer was used to create a turbulent condition. Due to the probable presence of Cl- ions from the previous acid leaching step and Na+ from NaOH, the chance of NaCl formation was high. To minimize the amount of NaCl, the precipitated solid was washed with dilute HNO3 and de-ionized water several times.

To synthesize the mesoporous nanoparticles, Ti-sol was added to the pre-mixed solution of HDTMA in the water-ethanol mixture, mixed, and put in an autoclave for thermal treatment. The XRD patterns of mesoporous samples achieved after calcination at 400 °C are shown in figure 4, indicating that a combination of rutile and anatase phases was formed in all samples except in the one where Ti-sol was achieved under alkaline leaching conditions at 70 °C, in which only the anatase phase was observed. The formation of the combined form of anatase and rutile could be attributed to the higher Ti-to-micelle ratio, which in turn led to the accumulation of the particles in the rutile phase [47]. In the XRD analysis depicted in figure 4, it can be observed that an increase in the value of Ti-sol (MTi-2 and MTi-3 samples) led to an increase in the intensity of the rutile phase.

Figure 4. The XRD curves of the TiO2 nanoparticles with mesoporous structure ((a): MTi-1, (b): MTi-2, (c): MTi-3, (d): MTi-4).
Download figure:
Standard image High-resolution imageTo analyze the mesoporous structure of the synthesized samples, the nitrogen sorption analysis was applied, the results of which were compared with one another (figure 5) [48]. It was revealed that the mere boiling of Ti-sol to synthesize the TiO2 nanoparticles did not result in the formation of mesoporous structures. However, the nitrogen sorption patterns of all samples synthesized in presence of HDTMA indicated a clear H1- or H3-type hysteresis, denoting the formation of a mesoporous structure. In the first three samples, i.e. MTi-2, MTi-3, and MTi-4 (table 3), where Ti-sol was prepared at 40 °C, regardless of the amount of Ti-sol and the presence of HDTMA in the synthesis process, a H3 hysteresis loop was detected (figure 5(a)), indicating the existence of slit-shaped mesopores [48] with the pore size around 2.3, 3.2, and 3.2 nm, respectively. This type of porosity was not a well-ordered porous structure [39] and the HDTMA could not well create an ordered micelle structure during the synthesis process. However, in the MTi-1 sample (where Ti-sol was prepared at 70 °C), when the same amounts of Ti-sol and HDTMA were used in the synthesis process, compared to the MTi-2 sample, the hysteresis patterns changed to a typical H1 hysteresis loop [48]. This was a well-ordered cylindrical mesoporous structure indicating the formation of well-ordered HDTMA micelles during the synthesis process. Thus, it could be concluded that the HDTMA micelles played a significant role in the formation of an ordered structure including TiO2 mesoporous nanoparticles.
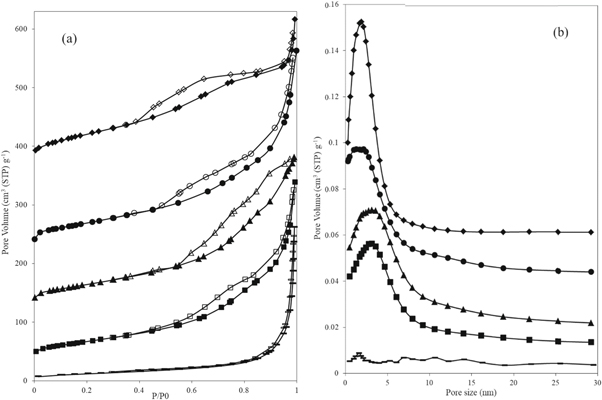
Figure 5. (a) The nitrogen gas sorption analysis patterns and (b) BJH diagram of the TiO2 nanoparticles (♦: MTi-1, •: MTi-2, ▲: MTi-3, ■: MTi-4, −: UM-Ti; solids: adsorption, empty: desorption).
Download figure:
Standard image High-resolution imageTable 3. The nitrogen gas sorption results for the TiO2 nanoparticles samples.
| Sample | Mesoporous structure | BJH pore size (nm) | BET surface area (m2 g−1) | Total pore volume (cm3 g−1) | Phase |
|---|---|---|---|---|---|
| UM-Ti | — | — | 42.88 | — | Anatase |
| MTi-1 | Cylindrical | 2 | 181.09 | 0.36 | Anatase |
| MTi-2 | Slit-shaped | 2.5 | 173.41 | 0.49 | Rutile, Anatase |
| MTi-3 | Slit-shaped | 3.2 | 156.71 | 0.40 | Rutile, Anatase |
| MTi-4 | Slit-shaped | 3.2 | 133.83 | 0.46 | Rutile, Anatase |
In addition, the preparation of Ti-sol at temperatures above 70 °C would result in the decomposition of H2O2 during the reaction compared with the condition where the reaction occurred at 40 °C. That is to say, in the synthesis process of the mesoporous nanoparticles of TiO2, higher amounts of H2O2 would lead to defects in the formation of micelles through changing the electrostatic forces in the HDTMA structure [49]. This could be another reason for the formation of the ordered cylindrical mesopores when Ti-sol was prepared at higher temperatures.
The two-capillary condensation steps were clearly detected in the MTi-1 sample (figure 5(a)), in the P/P0 range of 0.38–0.65 and in the range of over 0.95, respectively. The first step represented mesopores with a pore size of around 2 nm, and the second one corresponded to the intraparticle porosity [50, 51]. In the other three samples (MTi-2, MTi-3, and MTi-4) the shape of the hysteresis loops changed to the H3-type hysteresis, and the initial capillary condensation step started from the P/P0 of 0.6, continued to 0.8, and then constantly merged with the next step, i.e. above 0.8. This represented slit-shaped mesopores with intraparticle porosity, which were not well-ordered. In the sample MTi-4, where the capillary condensation started from the P/P0 of above 0.5, larger mesopores would be expected (figure 5(a)).
The surface area and the pore size distribution of each sample were calculated, the details of which are shown in figure 5(b) and table 3. In the sample in which no HDTMA was observed in the synthesis process (UM-Ti), the lowest surface area was detected around 42.88 m2 g−1 , having no clear pore size distribution. However, in all samples where HDTMA was involved in the synthesis process, considerably larger surface area was obtained, having clear mesopore size distribution. Remarkably, the mesopore size distribution of the sample with the H1 hysteresis loop was highly sharper than that obtained from other samples, indicating a well-ordered mesopore size around 2 nm (figure 5(b)). This highlighted the regularity of the Mesoporous cylindrical-shaped structure, corresponding to the formation of mesopores through hydrolysis of TiO2 to the well-ordered HDTMA micelles (table 3).
The nanoparticle structure and the morphology of the MTi-1 and UM-Ti samples were analyzed using TEM analysis (figure 6). According to TEM (figure 6) analysis, the particle size of the TiO2 sample, where HDTMA was used in the synthesis process (MTi-1), was reasonablly smaller than the sample in which HDTMA was not employed at all (UM-Ti), indicating that HDTMA stunted the growth of TiO2 nanoparticles. The rod-like shapes of the TiO2 nanoparticles with were evident in the TEM images of the non-porous sample (figures 6(c) and (d)), where no mesoporosity was found; however, the nanoparticles of the mesoporous sample had a rectangular shape (figures 6(a) and (b)).
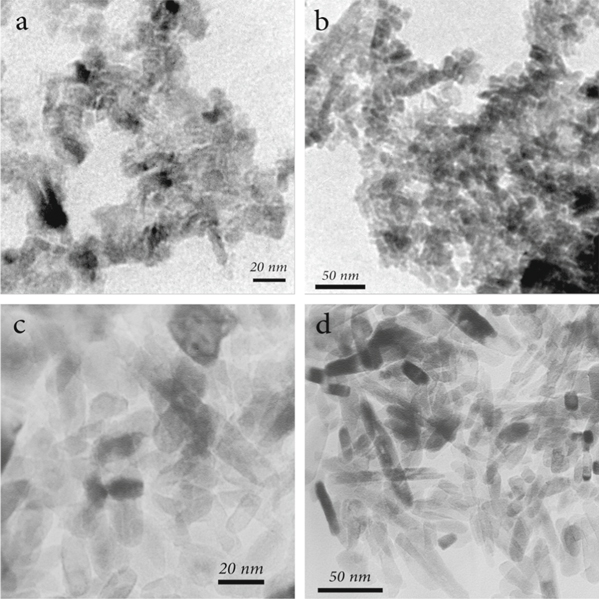
Figure 6. TEM results of the MTi-1 and UM-Ti samples ((a) and (b): MTi-1 and (c) and (d): UM-Ti).
Download figure:
Standard image High-resolution image3.2. TC adsorption and antibacterial properties
In order to investigate the effects of mesoporosity of TiO2 nanoparticlesonthe adsorption and photocatalytic degradation of TC, a kinetical experiment was initially conducted to analyze the adsorption properties of the samples (figure 7). The effects of porosity on the photo-degradation of TC were then evaluated. The highest amount of adsorption (figure 7) was detected in the well-ordered mesoporous TiO2sample (MTi-1), and the lowest amount was observed in the non-porous sample (UM-Ti). The amounts of adsorption of other slit-shaped mesoporous TiO2 samples were higher than those of the non-porous samples, though reasonably lower than the adsorption amounts of the samples with a well-ordered mesoporous structure. This was due to the higher surface area of the well-ordered mesoporous TiO2 sample compared with that of other samples (figure 5 and table 3). In addition, the pore sizes of the well-ordered mesoporous TiO2 nanoparticles were sufficiently big (around 2 nm) to allow small TC molecules to penetrate (around 1.5 nm), thereby providing greater effective surfaces for the adsorption of TC. On the other hand, the well-ordered mesoporous TiO2 sample had reasonably smaller nanoparticle sizes compared to the non-porous sample, making readily accessible surfaces onto the mesoporous structure for the adsorption of TC [13, 14, 52].

Figure 7. The adsorption and desorption kinetic diagrams (◊: MTi-1, ○ : MTi-2, ∆: MTi-3, □: MTi-4, and +: UM-Ti).
Download figure:
Standard image High-resolution imageThe pseudo-second-order and the intraparticle diffusion models were well fitted with the results concerning the kinetics of adsorption (figure 8 and table 4) [53, 54]. indicating high attraction forces between the TiO2 samples and TC (figure 8(a)) [55]. The intraparticle diffusion model indicated two different trends: one for the non-porous sample having two linear steps and another for all porous samples involving three clear linear steps (figure 8(b)) [56]. This indicated that the non-porous samples adsorbed TC only on the external surfaces; however, TC gradually diffused into the mesopores of other porous samples [57]. The greater K values of the second linear stage for the well-ordered mesoporous TiO2 sample compared to those of other porous samples clearly indicated the diffusion of higher amounts of TC into the intraparticle pores [58].

Figure 8. Analysis of absorption kinetic by the Pseudo-second-order model (left) and the intraparticle diffusion model (ri) (◊: MTi-1, ○: MTi-2, ∆: MTi-3, □: MTi-4, and +: UM-Ti).
Download figure:
Standard image High-resolution imageTable 4. Variation of the Pseudo-second-order model and Intraparticle diffusion model.
| Pseudo-second-order model | Intraparticle diffusion model | ||||||||
|---|---|---|---|---|---|---|---|---|---|
| Sample | qe (mg g−1) | K × 10–3 (min. g mg−1) | R2 | K1 (mg g−1 min0.5) | R12 | K2 (mg g−1 min0.5) | R22 | K3 (mg g−1 min0.5) | R32 |
| UM-Ti | 41.15 | 1.25 | 0.99 | 4.28 | 0.99 | 0.14 | 0.89 | — | — |
| MTi-1 | 83.33 | 0.35 | 0.99 | 11.31 | 0.98 | 1.39 | 0.99 | 0.60 | 1 |
| MTi-2 | 65.79 | 0.70 | 0.99 | 8.46 | 0.98 | 0.60 | 0.98 | 0.31 | 0.98 |
| MTi-3 | 48.54 | 0.69 | 0.99 | 4.02 | 0.98 | 1.31 | 0.99 | 0.05 | 0.83 |
| MTi-4 | 45.25 | 1.19 | 0.99 | 5.10 | 0.99 | 0.86 | 0.88 | 0.07 | 0.82 |
After reaching equilibrium in the adsorption tests (24 h) under dark conditions, the supernatant was discarded and replaced with fresh water to analyze the amount of desorption after three hours. The TC concentration of the desorbed solution was analyzed, and the solution with the lowest TC concentration was chosen as the baseline; the concentrations of other samples were adjusted to the selected lowest TC concentration by addition of fresh water. Afterwards, the antimicrobial properties of these samples were tested using two bacteria, i.e. Staphylococcus aureus and Escherichia coli (figures 9(a) and (b)). The results indicated that, compared with TC in fresh water, TC in all TiO2 samples, including non-porous (UM-Ti), slit-shaped porous(MTi-4), and well-ordered mesoporous(MTi-1), shown in figures 9(a) and (b) as samples 2, 3, and 4 respectively, showed almost similar antimicrobial activities (figures 9(a) and (b), sample 1).In other words, the presence of TiO2 in any forms did not degrade TC in dark conditions, and the adsorption-desorption process did not alter its antimicrobial activity. In another set of experiment, after adsorption of TC by TiO2 samples, the supernatant was discarded, replaced with fresh water, and placed under UV light for three hours. The control sample was also diluted to the baseline concentration under dark conditions and placed under UV irradiation. The TC concentration of the desorbed solution was set to the baseline, and the antimicrobial tests were subsequently carried out (figures 9(c) and (d)). These TC solutions showed lower antimicrobial activities compared to those which were not placed under UV irradiation. In addition, in all TC solutions desorbed from the TiO2 samples, when UV irradiation was employed, the antimicrobial activity was lower than that in the TC solutions in fresh water after being placed under UV. More importantly, the TC solution desorbed from the well-ordered mesoporous TiO2 structure indicated lower antimicrobial activity, showing the higher degradation rate of TC compared with other samples.
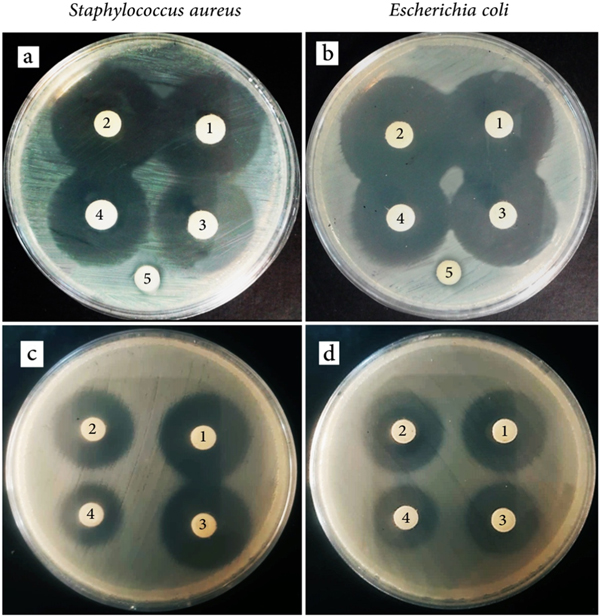
Figure 9. The antimicrobial test of the TC in fresh water or desorbed from TiO2 nanoparticles in presence of Staphylococcus aureus and Escherichia coli bacteria in dark (a) and (b) or after being irradiated under UV (c) and (d) (1: TC solution in fresh water, 2: TC desorption from UM-Ti sample, 3: TC desorption from MTi-4 sample, 4: TC desorption from MTi-4 sample, and 5: deionized water with no TC).
Download figure:
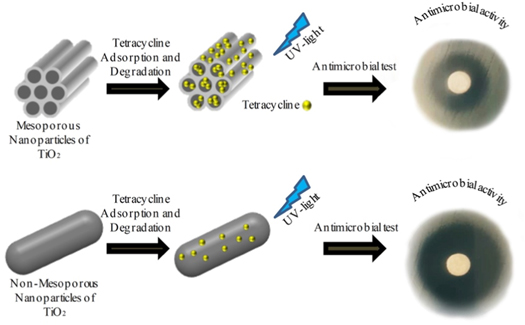
Standard image High-resolution imageAs discussed in the previous section, TC had the potential to adsorb on the external surface of the non-porous TiO2 samples; however, TC could adsorb on the mouth of mesopores of the TiO2 samples having well-ordered mesoporosity. In this condition, the chance of being exposed to the UV light increased when the sample comes into contact with TiO2, resulting in higher degradation rate. In addition, in the well-ordered mesoporous TiO2 sample, the higher active area was provided for TC to degrade when the sample was placed under UV irradiation as described in Scheme
Scheme 2. Schematic diagram of TC photodegradation on TiO2 with different porosity.
Download figure:
Standard image High-resolution image
The degradation mechanism of TC with the TiO2 has been investigated elsewhere [60] and it is based on the fragmentation of phenolic groups attached to aromatic when being under light irradiation. In addition, formation of acylamino and hydroxyl groups 4a,12a-anhydro-4-oxo-4-dedimethylaminote-tracycline occurs when the irradiation time increases.
4. Conclusion
In summary, the well-ordered cylindrical mesoporous nanoparticles of TiO2 were synthesized using ilmenite as a titanium source. In addition, two other nanoparticles of TiO2, i.e. the slit-shaped nanoporous structure and the non-porous structure, were synthesized, and their characteristics were examined in terms of adsorption and photodegradation of tetracycline. The results indicated that changing the amounts of HDTMA would lead to the variations in the mesoporous structure. Higher amounts of TC adsorption and degradation were detected in the well-ordered mesoporous TiO2 nanoparticles compared with other samples, which could be attributed to the enhancement of the available surfaces for photodegradation in this antibiotic. The results indicated that the mesoporous nanoparticles of TiO2 with well-ordered cylindrical pores provided larger active surface areas for TC to adsorb, increasing the accessibility of TC to more active sites on the surface of TiO2. The enhanced photocatalytic characteristics of TiO2 investigated in this study have enormous potential for environmental applications.
Acknowledgments
The authors acknowledge access to infrastructure from the Mining Engineering Department of the Isfahan University of Technology.