

Abstract
The effects of Ti and hot/cold extrusion on the microstructure and properties of the 2219 heat-resistant aluminum alloy were studied in this paper. The results show that the grain size decreases significantly with the increase of Ti content of the three hot-extruded alloys, and the alloy with 0.49Ti has the best mechanical properties. The hardness and tensile strength at room temperature are further improved. Besides, the peak value of thermal compression stress reached up to 252.76 MPa at 250 °C and the maximum intergranular corrosion depth is 181.56 μm. Compared with the hot-extruded materials, the strength and heat resistance of the cold-extruded materials are both enhanced significantly. The tensile strength is increased by 32% to 416.67 MPa at room temperature and the peak value of thermal compression stress reached up to 230.82 MPa at 250 °C. Besides, the maximum intergranular corrosion depth was also decreased by 81.09 μm. The mechanical properties of alloys can be further improved by the addition of titanium and cold extrusion to meet the requirements of machines worked at high temperature in the industry.
Export citation and abstract BibTeX RIS
1. Introduction
The 2xxx series aluminum alloy has an excellent application value in the industry, because of its high strength, toughness, heat resistance, and has been widely used in aerospace, firearms and other key parts of the heat-resistant structure, such as aero-engine cylinder head and piston, aircraft surface skin [1–3]. With the development of large aircraft and manned spaceflight industry in China, 2xxx aluminum alloy has attracted the attention of domestic research institutions. Zhongnan University, China Aerospace Science and Technology Group have done lots of research on spray deposition, squeeze casting, electromagnetic casting, welding properties and so on, which laying a solid foundation for the development of 2xxx aluminum alloy with better properties [4, 5].
For the 2xxx series aluminum alloy, some studies have shown that the addition of Zn can improve the mechanical properties, such as fracture toughness and strength. Meanwhile, Zn will promote the formation of T phase and suppress β phase, thereby improving the corrosion resistance of alloys. By adding a small amount of Mn into aluminum alloys, the part exceeding the solid solubility will form Al6Mn, which has a positive effect on the mechanical properties of alloys. However, when the content of Mn is too high, the plasticity and fatigue strength of alloys will decrease significantly. So the content is usually controlled below 1% [6]. Some researchers [7, 8] also pointed out that trace amount of Zr and Sr will form Al3Zr and Al4Sr with Al, which can not only refine the grain and inhibit the crystallization, but also improve the corrosion resistance of alloys. In recent years, Ti alloying also becomes an important research direction. Wang [9] has studied the influence of Ti addition on 2618 aluminum alloy and found that the addition of Ti can significantly increase the instantaneous strength of 2618 aluminum alloy at 250 °C, but when the content of Ti is higher than 0.5%, the room temperature tensile strength will decrease. Xu [10] also studied the (Ti, Zr) composite particles produced by adding Ti to the heat-resistant conductive aluminum alloy, which can improve the heat resistance of alloys.
However, the research on 2219 aluminum alloy mostly concentrates on exploring the plastic deformation, hot working process, microalloying and so on. There are little studies focused on the effect of Ti element and hot/cold extrusion on the microstructure and properties of 2219 aluminum alloy [11, 12]. Therefore, the 2219-xTi aluminum alloy is designed to investigate whether the addition of Ti can improve the mechanical and temperature resistance of aluminum alloys. In addition, the influences of hot/cold extrusion on the microstructure and mechanical are compared to explore the potential properties of aluminum alloys in the article.
2. Experimental procedure
The experimental process was as follows: melting and casting - homogenization annealing - extrusion - solid solution - aging treatment. Before melting and casting, Al-Cu, Al-Zr, Al-Sr, Al-Ti-B, Al-Mn intermediate alloys and pure Al were first put into the furnace. The temperature was set to 900 °C (the temperature was 800 °C without titanium) and kept for 1 h. When the temperature was reduced to 750 °C, pure Zn was added. After 10 min, it was melted, stirred evenly and degassed by adding C2Cl6. After 15 min, it was cast into a mold to form an ingot. The homogenization annealing process was 525 °C × 24 h. Then the sample was cut into a cylindrical material with a radius of 15.8 mm and preheated at 380 °C × 2 h after homogenization annealing. The cold extrusion was completed on a hydraulic press with a rated pressure of 100 tons and the extrusion ratio was 7. The solution treatment was 535 °C × 3 h and the aging process was 191 °C × 12 h [13].
Then the alloy was analyzed for the microstructure and properties, and the sample size was 10 mm × 10 mm × 5 mm squares. The microstructure was analyzed by OM (model: 4XC-MS optical microscope), SEM (model: JSM-IT300 scanning electron microscope) and XRD (model: D8 ADVANCE x-ray diffractometer ). The hardness was tested on a HV-1000 microhardness tester with a load of 200 g and the average value was calculated as the final hardness value. The tensile strength was tested on a WDW-200G universal testing machine and the size of tensile sample was shown in figure 1. The peak value of thermal compression stress was tested on a Gleeble-3500 machine and the deformation temperature was 250 °C. In the intergranular corrosion test, the intergranular corrosion resistance was evaluated by the maximum corrosion depth.
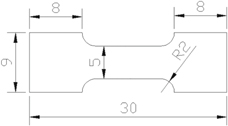
Figure 1. Orientation and dimension drawing of the stretched samples.
Download figure:
Standard image High-resolution imageIn the experiment, the 2219 alloy having composition of Al-6.8Cu-0.4Mn-0.2Zr-0.1Sr was taken as the base alloy and 0, 0.5, 1(wt%)Ti was designed to the four alloys, numbered H1, H2, H3 and C3, in which C3 was the alloy after cold extrusion of H3. The actual composition of the alloy is shown in table 1 by EDS.
Table 1. Actual composition of the four alloys (wt%).
| Extrusion | No. | Cu | Mn | Zn | Zr | Sr | Ti | Al |
|---|---|---|---|---|---|---|---|---|
| Hot | H1 | 6.71 | 0.38 | 0.11 | 0.21 | 0.09 | 0 | Bal. |
| H2 | 6.65 | 0.39 | 0.11 | 0.20 | 0.10 | 0.49 | Bal. | |
| H3 | 6.76 | 0.38 | 0.10 | 0.19 | 0.09 | 0.89 | Bal. | |
| Cold | C3 | 6.76 | 0.38 | 0.10 | 0.19 | 0.09 | 0.89 | Bal. |
3. Results and discussion
3.1. SEM analysis
Figure 2 shows the SEM images of the four alloys. It is found that there are white undissolved phases in the four images, in which the undissolved phases of H1 alloy penetrates the entire grain boundary and the intergranular broadening phenomenon is severe (figure 2(a)). When a certain amount of Ti was added to H2 alloy, the undissolved phases are discontinuous and most of them exist in the triangular region between the grains. Besides, H3 alloy has the highest intergranular undissolved ratio and some undissolved particles appear on the surface of the alloy (figure 2(c)). These undissolved particles will preferentially break and affect the mechanical properties during the plastic deformation process, which indicates that Ti has a certain solid solubility and will promote more uniform distribution of the excessive second phase before exceeding the maximum solid solubility [14]. Compared with figure 2(c), the proportion of undissolved phases in figure 2(d) reduced greatly, and there is no second phase aggregation. Only a small amount of scattered undissolved phases are distributed inside the alloy, which indicates that cold extrusion can promote the redundant second phase to dissolve in the matrix.

Figure 2. SEM image of the alloys: (a) H1; (b) H2; (c) H3; (d) C3.
Download figure:
Standard image High-resolution imageThe undissolved phases were analyzed by EDS and the actual composition is shown in table 2. The main component in region A is Al and Cu with a small amount of titanium. According to element ratio, the undissolved phase is mainly θ (Al2Cu) phase. The main elements in region B are Al and Ti, which were estimated to be Al3Ti phase and the white coarse Al3Ti phase is hardly soluble in the matrix because of excessive titanium.
Table 2. Actual composition of the undissolved phases.
| Region | Al | Cu | Ti | Mn | Zr |
|---|---|---|---|---|---|
| A | 61.37 | 31.69 | 6.94 | — | — |
| B | 92.01 | 2.20 | 4.16 | 0.75 | 0.89 |
3.2. Metallographic observation
Figure 3 is the metallographic images of the four alloys. Figure 4 shows the grain size distributions and average grain size of the four alloys. It is observed that H1, H2 and H3 alloys have a certain equiaxed crystal. The eutectic structures have not been fully dissolved in the matrix and some grains appear to grow, which indicate that the three alloys have recrystallized during the solution treatment. The grain size in figures 3(b) and (c) are obviously smaller than that in figure 3(a), indicating that Ti element can effectively promote the refinement of grains and enhance mechanical properties. However, there are many second phases remaining in the intergranular phases and the grain boundary widening phenomenon is serious. Besides, the triangular complex melting zone and the over-burning phenomenon happen between the grains with the increase of Ti content, which may be due to an unipolar solid solution system. The low-temperature soluble phases have no time to integrate into the matrix fully and solidify again after being in the molten state, leading to an over-burning phenomenon [15].
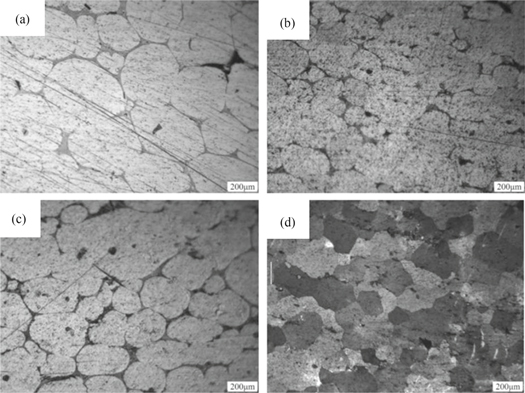
Figure 3. Metalographic picture: (a) H1; (b) H2; (c) H3; (d) C3.
Download figure:
Standard image High-resolution image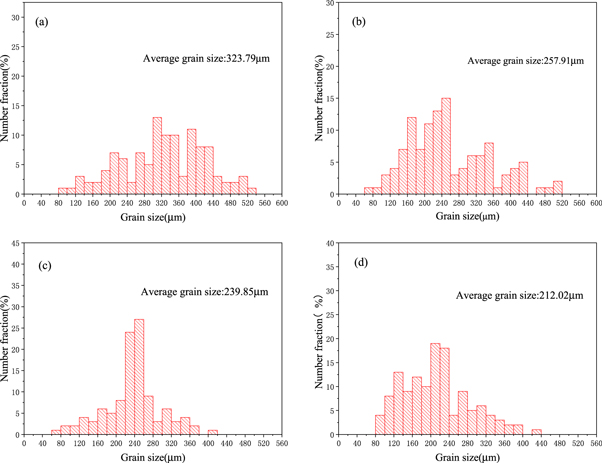
Figure 4. Grain size distributions and average grain size: (a) H1; (b) H2; (c) H3; (d) C3.
Download figure:
Standard image High-resolution imageCompared C3 alloy with H3 alloy, there are some undissolved black phases on their surfaces because of excessive titanium. The grain size in figure 3(d) is smaller than that in figure 3(c), indicating that cold extrusion will further refine grains. Besides, the equiaxivity of the grains in figure 3(d) is smaller than that in figure 3(c), the degree of recrystallization is light and most of the intergranular eutectic structures have been dissolved in the matrix, which shows that cold extrusion can inhibit the recrystallization and promote eutectic structures into the matrix. Thus, properties of alloys can be further improved.
3.3. XRD analysis and dislocation enhancement
Figure 5 shows the XRD pattern and half-peak width of the four alloys. Figure 6 is the XRD analysis spectrum of pure Al. Compared with pure Al, it is found that the pattern of H1 alloy is the closest, while H2 and H3 alloys have larger differences, which indicates that the addition of Ti will increase the internal texture ratio of the crystals of 2219 aluminum alloys. Besides, H3 alloy has the largest half-peak width, which indicates that Ti has little influence on the crystal orientation and the lattice strain. Compared with H3 alloy, C3 alloy has a larger crystal grain ratio (figure 5(g)) and the half-peak width reduced slightly.
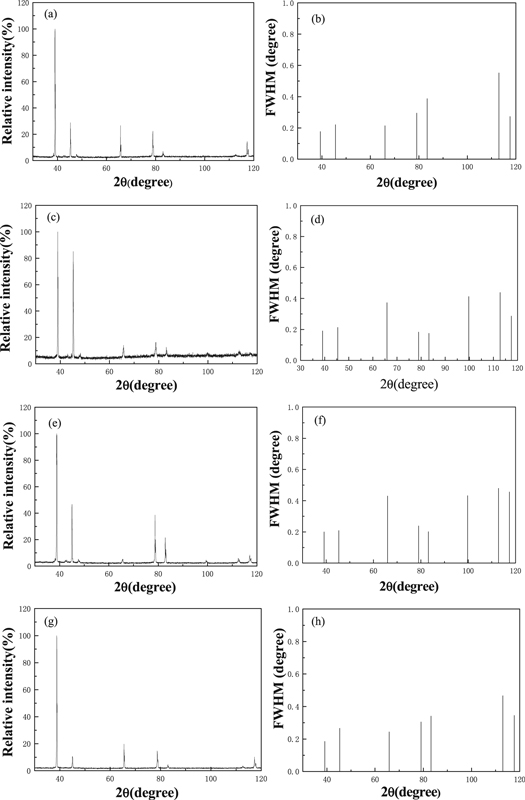
Figure 5. XRD spectrum: (a) H1; (c) H2; (e) H3; (g) C3; FWHM: (b) H1; (d) H2; (f) H3; (h) C3.
Download figure:
Standard image High-resolution image
Figure 6. XRD spectrum for pure Al.
Download figure:
Standard image High-resolution imageBased on the above data, the dislocation density of the four alloys and the corresponding dislocation strengthening contribution values can be calculated. The relationship can be expressed by the following equation [16].

According to figure 5,  and FWHM(
 ) can be derived. Further, according to figure 7, the coherent diffraction region size (d) and the average lattice strain (
 ) can be calculated by the following equation [17].

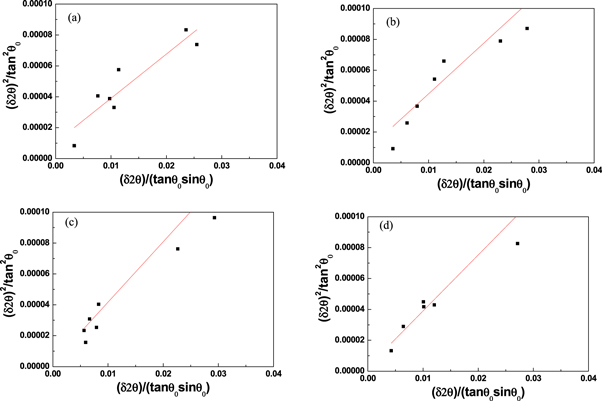
Figure 7.
 and
and  linear relationship: (a) H1; (b) H2; (c) H3; (d) C3
Download figure:
Standard image High-resolution imageThe dislocation enhancement ( ) can be calculated by the following equation [18].

In the formula, b is Baise vector and the value is 0.286 nm; M is Taylor orientation factor and the value is 3.06; α represents numerical factor and the value is 0.24; G represents shear modulus and the value is 26 GPa. The dislocation parameters associated with the calculation of the above three equations are shown in table 3.
Table 3. Related parameters of dislocation.
| Extrusion | Alloy no. | d (nm) | 〈e2〉1/2 (%) | ρ (1014 m−2) | σρ (MPa) |
|---|---|---|---|---|---|
| Hot | H1 | 53.87 | 6.44E-04 | 1.45 | 65.72 |
| H2 | 42.20 | 1.94E-04 | 0.56 | 40.80 | |
| H3 | 39.40 | 3.24E-04 | 0.99 | 54.46 | |
| Cold | C3 | 42.44 | 3.29E-04 | 0.94 | 52.90 |
According to table 3, it is found that the addition Ti will consume some dislocations, but the phenomenon will be inhibited with further increasing the content of Ti. Besides, some studies have shown that the larger the lattice strain, the lower the hardenability [19]. Table 3 shows that the lattice strain of H1 alloy is the largest and the hardenability is the worst. With the increase of Ti, the lattice strain decreased firstly and then increased, indicating that moderate Ti has a positive effect on the hardenability.
3.4. Hardness and conductivity
Figure 8 shows the aging-hardness in different time periods at 191 °C. Table 4 is the hardness value and conductivity of the four alloys. It is found that the hardness of H2 alloy and H3 alloy are 12 HV higher than that of H1 alloy before aging process (about 104 HV), while the hardness of the cold-extruded C3 alloy reached up to 112HV. After 6 h aging, the hardness of the four alloys increased significantly, increasing by 16% to 28%. The first peak appeared and the hardness is 118.47 HV, 130.10 HV, 121.50 HV and 140.42 HV, respectively. After 18 h aging, the second peak appeared and the hardness of each alloy was slightly lower than that at the first peak. After 24 h aging, the hardness of the four alloys decreased, which indicates that over-aging has occurred at this time. In general, the aging time of 6 h is the peak aging of the alloy, which is the best aging time. Compared the three hot-extruded alloys, when the content of Ti is within a certain range, it can promote the hardness of alloys. As Ti content continues to increase, the hardness will decline. Besides, cold extrusion can greatly improves the hardness of alloys.
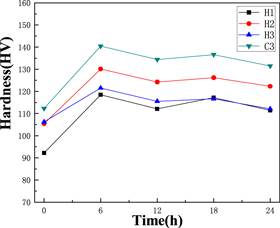
Figure 8. Aging-hardness curve of the alloys at 191 °C.
Download figure:
Standard image High-resolution imageTable 4. Hardness (HV)and conductivity (%IACS) of the alloys.
| Hardness at different aging time | |||||||
|---|---|---|---|---|---|---|---|
| Extrusion | Alloy no. | 0 h | 6 h | 12 h | 18 h | 24 h | Conductivity at peak aging |
| Hot | H1 | 92.20 | 118.47 | 112.10 | 117.20 | 111.45 | 26.30 |
| H2 | 103.45 | 130.10 | 124.20 | 126.21 | 122.30 | 22.71 | |
| H3 | 104.23 | 121.50 | 115.52 | 116.64 | 112.12 | 22.66 | |
| Cold | C3 | 112.30 | 140.42 | 134.40 | 136.60 | 131.52 | 22.49 |
In conclusion, the aging system adopts 191 °C × 6 h. It can be seen that for the three hot-extruded alloys, the addition of Ti can affect the electrical conductivity of alloys, ranging from 26.3% IACS alloy to 22.49% IACS, which indicates that the addition of Ti will reduce the stress corrosion resistance of alloys. Compared with H3 alloy, the electrical conductivity of C3 alloy decreases slightly [20].
3.5. Tensile properties and fractures analysis
Table 5 shows the mechanical properties of the four alloys. Compared with H1 alloy, the strength of H2 alloy increased by 87.01 MPa and the elongation decreases by 3.4%. When titanium reached up to 0.89 (wt%), the tensile strength of H3 dropped to 315.59 MPa. Compared with H2 alloy, there are a large number of eutectic phases not soluble in the matrix and the proportion of main strengthening phases decreased. Thus, the mechanical properties of alloys decline (figure 2). In addition, it is found that the yield strength of C3 alloy increased by 101.08 MPa and the elongation reduces to 8.6%, indicating that the cold extrusion greatly can improve the strength of alloys.
Table 5. Mechanical properties of the alloys.
| Extrusion process | Alloy no. | Tensile strength/MPa | Yield strength/MPa | Elongation/% |
|---|---|---|---|---|
| Hot | H1 | 302.1 | 225.26 | 13.5 |
| H2 | 364.42 | 312.27 | 10.1 | |
| H3 | 315.59 | 258.06 | 12.5 | |
| Cold | C3 | 416.67 | 354.65 | 8.6 |
Figure 9 shows the tensile fractures of the four alloys. It is found that the fractures of the four alloys are uneven and the fractures are intergranular fractures, which are typical brittle fractures. Because the grain boundaries still have many eutectic phases that are not soluble in the matrix and excessive phases tend to be a preferential fracture source, causing the alloy to break prematurely, Thus, it exhibits a brittle fracture (figure 2). Compared the three hot-extruded alloys, it is found that the dimples of H1 alloy were relatively small and large (figures 9(a) and (b)), indicating that H1 alloy has the best plasticity alloy, which is consistent with the results of elongation in table 5. The size and number of dimples of H3 alloy are the second. The size of H2 dimples is larger than that of H3 alloy (figures 9(c) and (d)). Compared with H3 alloy, it is found that the fracture of C3 alloy is not flat and the tear hole size becomes larger. Besides, the number of dimples is less than that of H3 (figures 9(g) and (h)), which indicates that the degree of recrystallizing is lower than that of H3 alloy. Thus, the cold extrusion can increase the strength of alloys while decrease the plasticity.
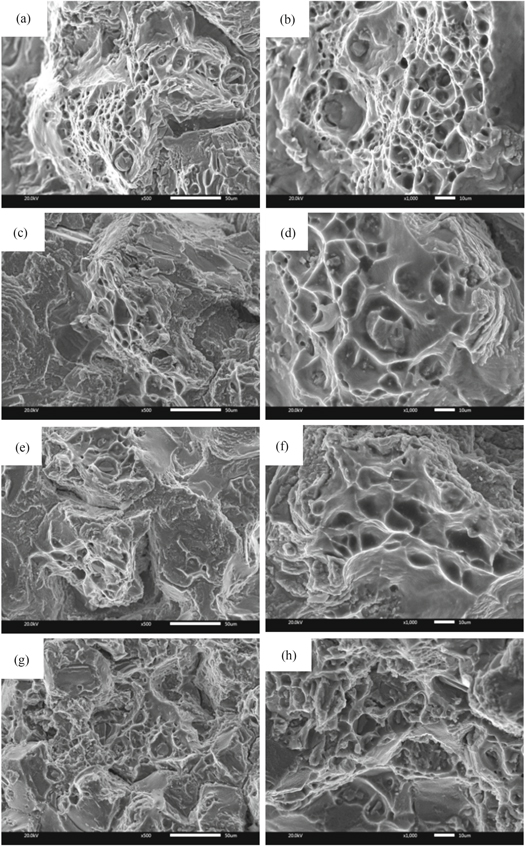
Figure 9. Tensile fracture of the alloys: (a) H1(×500); (b) H1(×1000); (c) H2(×500); (d) H2(×1000); (e) H3(×500); (f) H3(×1000); (g) C3(×500); (h) C3(×1000).
Download figure:
Standard image High-resolution image3.6. Thermal compression thermodynamic simulation test
Figure 10 is the true stress-strain diagram of the four alloys. Table 6 shows the stress peaks of the four alloys. It can be seen that the true stress of material rises rapidly with the increase of strain at the beginning. When the strain reached 0.1, the peak of stress appears and the upward trend stops. The stresses of the three hot-extruded alloys show a slow downward trend, while the trend of C3 alloy is relatively flat and remains basically unchanged. This is due to the fact that work hardening and dynamic softening occur simultaneously in the process of plastic deformation. These two phenomena have the opposite effect on the performance of alloys. When alloys begin to strain, the work hardening phenomenon is leading and the rise of true stress is obvious. When the stress reaches the peak value, the dynamic softening phenomenon is aggravated and the stress does not rise, keeping a dynamic equilibrium state [21, 22]. From table 6, it is found that the strengthening effect of Ti on heat resistance of the three hot-extruded alloys increased firstly and then decreased. H2 alloy has the highest stress peak, reaching 252.76 MPa, indicating that its heat resistance is the best. Besides, the stress peak C3 alloy is slightly higher than that of H3, which indicates that the cold extrusion will promote the heat resistance enhancement effect of alloys.
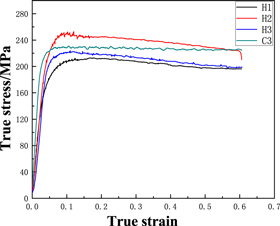
Figure 10. True stress-strain diagram of the alloys.
Download figure:
Standard image High-resolution imageTable 6. True stress peaks of the four alloys.
| Extrusion process | Alloy no. | True stress peaks/MPa |
|---|---|---|
| Hot extrusion | H1 | 212.89 |
| H2 | 252.76 | |
| H3 | 222.65 | |
| Cold extrusion | C3 | 230.82 |
3.7. Resistance to intergranular corrosion
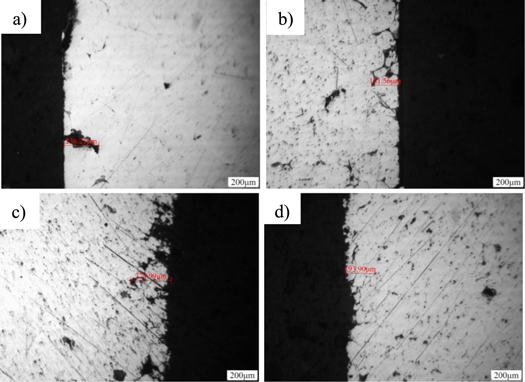
The intergranular corrosion pictures of the four alloys are shown in figure 11. Table 7 is the evaluation table of intergranular corrosion grade. It is found that the maximum corrosion depth of the four alloys is from 100 to 300 μm and the grades are all grade 4.
Figure 11. Intergranular corrosion of alloys: (a) H1; (b) H2; (c) H3; (d) C3.
Download figure:
Standard image High-resolution image
Table 7. Intergranular corrosion rating.
| Extrusion | Alloy no. | Maximum corrosion depth(μm) | Rank |
|---|---|---|---|
| Hot | H1 | 236.21 | 4 |
| H2 | 181.56 | 4 | |
| H3 | 274.99 | 4 | |
| Cold | C3 | 193.90 | 4 |
Compared the three hot-extruded alloys, the corrosion depth of H1 alloy is 236.21 μm and the corrosion morphology of the outer layer is relatively flat. There is almost no phenomenon that outer crystal grains fell off. With the increase of Ti content, the corrosion depth of H2 alloy decreased by 54.65 μm. But the intergranular corrosion solution has been corroded along the outer crystal grains, showing an intergranular network corrosion morphology (figure 11(b)). Meanwhile, the intergranular corrosion resistance of H3 alloy is the worst. The outer crystal grains have been corroded and peeled off. Besides, the pores are continuous and irregular. It shows that when the content of Ti is within a certain range, it can promote the corrosion resistance of alloys. However, it is easy to form corrosion channels as Ti content continues to increase, resulting in the decrease of corrosion resistance.
Compared with H3 alloy, the corrosion resistance of C3 alloy improved greatly and the depth reduced by 81.09 μm. Besides, the corrosion of C3 alloy is smooth and some surface grains have dropped (figure 11(d)). Most of the intercrystalline second phases have been dissolved in the matrix and crystal grains are further refined. There is no large corrosion hole and only a slight intergranular network corrosion. indicating that cold extrusion can improve the mechanical properties and corrosion resistance.
4. Conclusions
Ti element and hot/cold extrusion on the Al-6.8Cu-0.4Mn-0.2Zr-0.1Sr-xTi alloy have been discussed in this article and the improved mechanical properties will better meet the requirements of the key parts in heat-resistant structures. The significant conclusions are as follows:
- (1)For the three hot-extruded alloys, with the increase of Ti content, the undissolved phase increases, the grain size further refines and the dislocation strengthening effect decreases firstly and then rises. After cold extrusion, the recrystallization can be inhibited and the amount of undissolved phases significantly reduced. Besides, the crystal grains are further refined and the dislocation strengthening effect reduced.
- (2)The four alloys were aged at 191 °C for 0 h, 6 h, 12 h, 18 h, 24 h, and all of them reached the peak aging after 6 h aging, The hardness of the four alloys is 118.47 HV, 130.10 HV, 121.50 HV and 140.42 HV, respectively. The conductivity of the three hot-extruded alloys decreased from 26.3% IACS to 22.66% IACS with the increase of Ti content. Thus, the cold extrusion process can reduce the electrical conductivity of alloys.
- (3)With the increase of Ti content, the room temperature strength and strengthening effect of temperature resistance of the three hot-extruded alloys increase firstly and then decrease. Among them, the addition of 0.49Ti alloy has the best mechanical properties and temperature resistance. Compared with the alloy without Ti, the tensile strength increased by 62.32 MPa and the elongation is 10.1%. Meanwhile, the maximum intergranular corrosion depth decreased by 54.64μm and the peak value of thermal compression reached up to 252.76 MPa at 250 °C. After cold extrusion, the tensile strength increased by 32% to 416.67 MPa and the maximum corrosion depth is 193.9 μm. Besides, the temperature resistance increases slightly and the peak value of the hot compression increased by 8.17 MPa to 230.82 MPa at 250 °C.
Acknowledgments
The authors would like to acknowledge the financial support of Industrial Science and technology support program of Jiangsu province (Grant No. BE2008118), and the Key Projects of the 13th Five-Year Plan Equipment Pre-research Foundation of the Ministry of Equipment Development of the Central Military Commission of China (No: 6140922010201).