

Abstract
In the current work, the influence of a single and hybrid addition of the nano-particles (Al2O3) and (SiO2) on the corrosion resistance and polarization of the aluminum alloy (Al-4.5 wt%Cu-1.5 wt%Mg) as base alloy was investigated. Many composites reinforced with an individual addition of (5 wt%) SiO2 or (5 wt%) (Al2O3) nano-particles and hybrid addition of (2.5 wt% SiO2 + 2.5% Al2O3) nanoparticles were fabricated using powder metallurgy route. The rate of corrosion was evaluated by the Tafel polarization extrapolation method. Results showed that the hardness of nano composites that reinforced with the nanoparticles was higher than unreinforced base material. It was found that rate of corrosion of the hybrid nano-composite was lower than nano-composites with single addition and base alloy sample in the (3.5%NaCl) solution. Also, the results revealed that the pitting corrosion resistance is improved with the Al2O3 and/or SiO2 nano-particles addition during the cyclic polarization by disappearing the loop of hysteresis from the anodic polarization region.
Export citation and abstract BibTeX RIS
1. Introduction
Al alloys are significant structural metals which are utilized in a wide array of uses. Aluminum Matrix Composites (AMCs) were broadly investigated since they have less density, adequate physical and mechanical characteristics with adequate resistance of corrosion, high electrical and thermal conductivity [1]. The reinforcement's addition to the matrix, which is metallic, enhances the stiffness, specific strength, fatigue, characteristics of creep and wear in comparison with the traditional engineering alloys [2]. Metal oxides (Al2O3 and SiO2) are currently of the highly beneficial oxide of ceramics, like Al2O3 utilized in several areas of engineering, like, coatings, materials that resist heat, cutting materials, abrasive particles, and progressive ceramics. That's due to the Alumina (AL2O3), which is hard and resisting greatly the bases and acids, permits the elevated temperature uses and possesses an excellent resistance to wear [3]. Nanotechnology is now a key field in the engineering and science evolution [4]. In basic, nanotechnology includes synthesis or using of materials that possess unit sizes of about (10–100 nm). When comparing alumina particles having nano-sized and micron-sized, the nano alumina possesses several benefits. The smaller size of particle would supply too bigger surface area for the collisions of molecular and thus increases the rate of reaction, and that makes it a better reactant and catalyst [5]. There exist several methods for nano composites, comprising pressure infiltration or vacuum infiltration, squeeze casting, stir casting, powder metallurgy, high pressure die casting or permanent mold casting processes. The optimum way for preparing the nano composite is the routes of Powder Metallurgy (PM), since the powder metallurgy components are mass manufactured 'Near-Net Shapes' or to 'Net Shapes', removing or decreasing the required consecutive finishing process, i.e. giving too little waste material; around (97%) of the starting powders are changed to the final product, can be done with a certain porosity level, to manufacture a porous metal component, adequate governing of compaction and structure and manufacture of impossible components [6].
Several corrosion investigations were archived on the Al matrix composites that reinforced using particles having a size in microns, like Al2O3, SiO2, SiC, etc. Ali et al in 2010 [7] and Nervana in 2011 [8] focused on the effect of weight percentages of the particles of (Al2O3) on the behavior of corrosion and sensitivity to the NaCl solution.
Alaneme and Bodunrim in 2011 [9] studied the influence of different volume percents of Al2O3 particles (9, 15, and 18% vol.) and the 'solution heat treatment' on the behavior of corrosion of the (Al 6063) matrix composites in H2SO4, NaOH and salt water media. They concluded that this treatment enhanced the resistance to corrosion for the base material and composites, which displayed an excellent resistance to corrosion in the (NaCl) medium than in the media of H2SO4 and NaOH. Rana et al in 2014 [10] investigated the influence of adding particles of (SiO2) on the behavior of corrosion of Al alloy (Al-Cu-Mg) in the (3.5%NaCl) solution. The cyclic polarization is the passive layer stability for the composites. Zakaria in 2014 [11] investigated the influence of the SiC particles size and volume fraction on the corrosion behavior of pure (AMCs) in the solution of (3.5%NaCl) and obtained that the corrosion rate rose with rising the period of exposure. Muna et al in 2015 [12] obtained that the addition of the particles of (SiC) in (10%) and (20%) to the matrix of Aluminum 6061 rose the rate of in the (3.5%NaCl) solution.
Iman et al in 2015 [13] presented a new concept for enhancing the properties of cast aluminum alloy (A356) by adding nanoparticles (40 nm) of zirconia (ZrO2) and dioxide of titanium (TiO2), and alumina (Al2O3) to Al alloy (A356) as a matrix of metallic base. TiO2, nano-powders of ZrO2 and alumina were stirred in the matrix of Al (A356) using various fraction proportions in a range of (0%–5%) by weight at changeable speeds of stirring (270, 800, 1500 and 2150 rpm) in semi-solid at 600 °C and liquid at 700 °C condition utilizing fixed stirring time (1 min). Results depicted that the mechanical characteristics (hardness, strength and elongation) for the nano composites reinforced castings using (ZrO2), (TiO2) and (Al2O3) improved for the castings produced in a semi-solid condition at 600 °C with 2 wt% of Al2O3 and 3 wt% of TiO2 or ZrO2 at a (1500 rpm) speed of stirring.
But, the influence of a single and hybrid addition of the (Al2O3) and (SiO2) nano-particles on the corrosion resistance and the polarization behavior of the Al alloy matrix composites haven't been investigated in details until present time, or have been considered by too restricted investigations. Therefore, the objective of the current work is to investigate the influence of the addition of nano-particles of (Al2O3) or/and (SiO2) on the corrosion resistance of the duralumin alloy (Al-4.5%Cu-1.5%Mg) synthesized via the route of powder metallurgy (PM).
2. Experimentation
2.1. Used materials
The route materials to prepare the compacted aluminum alloy (Al–4.5%Cu-1.5%Mg) are powder of aluminum (Al), powder of copper (Cu), powder of magnesium (Mg) and two kinds of nano-particles (SiO2 and Al2O3). The properties of these materials are given in table 1.
Table 1. The materials properties of the used as various powders.
| Powder | Purity (%) | Average size of particle (μm) |
|---|---|---|
| Aluminum | 99.98 | 34.56 |
| Copper | 98.50 | 21.28 |
| Magnesium | 99.98 | 44.04 |
| α-Alumina | 99.98 | 50 nm |
| β-Silica | 99.8 | 25 nm |
2.2. Sample preparation
Blending or mixing or blending is mostly known as a pre-compaction stage in the powder technology. Theoretically, every composition is prepared commencing from the powders in form of elements. In the experimental procedure, (9.4 gm) from powder of Al was blended with (0.45 gm) from Cu powder, (0.15 gm) Mg powder, Al2O3 nano particles having particle size of (50 nm), and SiO2 having particle size of (25 nm) in 2.5 wt%. For each one, (0.5%) zinc stearate was added as a lubricant and binder. Blending was conducted using a ball mill kind (using a motor to rotate the jar) that has balls made of alumina. The number of balls number 20 with a proportion (20) to (1) weight of powder to weight of balls for a (6 hr) time of blending at (650 rpm) speed for getting a consistence blend and prevent the agglomeration of nanoparticles. The uniform blending will enhance the ability of sintering, compact ejection, and compact strength compact. The process of a uniaxial cold compaction was conducted on the blended powders for obtaining an adequate compaction and for producing 'Green Billet' having less porosity. Then, powders were compressed at (450 MPa) for the whole specimens utilized in the present investigation. A single direction action cylindrical die having a hole diameter of (20 mm), and an electric hydraulic press with a capacity of 20 ton, for 15 min incubation time in every exerted pressure, were employed. The process of sintering was performed in a furnace having an electric tube, 'type MITI Corporation GSL', with a maximum temperature of (1600 °C) for sintering utilizing the argon (Ar) gas having (99.99%) purity. A process of sintering was done in a furnace using (2 L min−1) (Ar) flow and at temperature (560 °C) for 60 min . The analysis of the prepared sintered specimen was conducted using the x-ray fluorescent (XRF) device (type 'Spectro X-Lap) that operated at (45 KV), (0.5 mA) and (25 KV) range of energy. The chemical analysis of the sintered parent alloy is shown in table 2. Also XRD analysis was performed for the best sintered specimen using x-ray diffractometer type (Shimadzu- XRD-6000) Japan using Cu- tube with wavelength 1.540 A°, current 30 mA, voltage 40KV and scan rate was 5° min−1 to identify the main phases in the specimen.
Table 2. The chemical analysis of the sintered base alloy by XRF instrument.
| Element wt% | Cu | Mg | Si | Mn | Al |
|---|---|---|---|---|---|
| value | 4.5 | 1.5 | 0.2 | 0.1 | balance |
3. Tests and inspections
3.1. Density and porosity measurements
The final measurement actual density and porosity for the whole specimens was achieved in accordance with standard (ASTM D792) depending on the law of Archimedes. Equation (1) gives the material specific gravity, while equation (2) yields the porosity [14]. The process of measurement was done at the room temperature, and water with (1 gm cm−3) density was utilized as the auxiliary liquid.
Where,

Where, P is the porosity sample, W1 is the weight of sample (gm) in the air, W2 is the weight of suspended sample in the liquid (gm), and W3 is the weight of the wet (soaked in air) sample (gm).

3.2. Microstructure and micro-hardness tests
Specimens were first prepared, then ground and finally polished to remove the scratches from the surface and to obtain a mirror surface. After that the etching process was carried out on the specimens by utilizing etching solution Keller's reagent (composed of 95 ml H2O, 2.5 ml HNO3, 1.5 ml HCL, 1.0 ml HF). They were washed and dried. Microstructure examination was performed by using optical microscope (Type MBL3300) (model KRUSS OPTRONIC-Germany ) connected to computer. Scanning electron microscope (SEM) type (VEGA3LM TESCAN COMPANY) provided with EDS (type Oxford) was used to examine the microstructure and topography of specimen surface.
Specimens micro-hardness measurement was conducted via a tester of Vickers hardness 'type (LECO) Micro-hardness Tester (LM248AT)', using (1.96 N) applied load for (15 s) indentation time. The microhardness readings were taken at (5) equivalent positions for very specimen for evaluating the average value micro-hardness.
3.3. Test of electrochemical corrosion
In the present work, the parameters of the corrosion of base material (Al-4.5%Cu-1.5%Mg) and nano composites reinforced by Al2O3 or/and SiO2 nanoparticles specimens after immersion in the solution 3.5%NaCl at the room temperature were evaluated. A specimen having (1 cm2) surface area was placed in an electro-chemical cell of (1000 ml) consisting of three electrodes. The 'working electrode' is the corroding metal specimen having (1 cm2) that exposed to the solution, while the 'auxiliary or the counter electrode' is, in general, a platinum rod, which is an inert conductor having dimensions of (10 × 100) mm. The 'reference' electrode' or (standard H2 electrode) was utilized to measure the working electrode potential. The cyclic polarization test range was from (−250) to (+1000 mV + 1500) under and above the potential of the open circuit, respectively. Through the test of the cyclic polarization, the rate of scan was (3 mV s−1). The tests of the electrochemical corrosion via the method of 'Tafel extrapolation' and the cyclic polarization tests were conducted via employing 'Wenking MLab multi channels' as well as 'SCF-MLab'. The measuring system of corrosion is from 'Bank Electronics-Intelligent controls GmbH, Germany 2007'. The corrosion parameters were determined, like (Icorr) and (Ecorr) to compute the rate of corrosion (CR) using the following formula [15].

Where, (CR) is the rate of corrosion in mils/year (mpy), (Icorr) is the corrosion current density in (μA/cm2), (EW) is the equivalent weight in (gm/equivalent), and (ρ) is the density of the corroding specimen (gm.cm−3).
Pitting energy was measured by using the mostly common standard model of 'Koizuimi Placom' N-Series that induced the stimulatingly greatest reaching in the 'Placom Digital Planimeter KP-90N' history which ever done. The capacity of measuring is noticeably expanded. The measurement via a 6-digit pulse count helps to record (100) times bigger heaped area than the usual planimeters.
3.4. Contact angle measurement
The wetability or hdyrophobicity of the base alloy (Al-4.5%Cu-1.5%Mg) and nano composites reinforced by Al2O3 or/and SiO2 nanoparticles specimens before corrosion were evaluated and measured with static drop of water by using the liquid and solid contact angle meter type CAM 110-O4W made in China which provided with CCD camera.
4. Results and discussion
4.1. Images of AFM and XRD analysis
The outputs of measurement of the mean size of particles for the (SiO2) or (Al2O3) nanopowders were obtained beyond preparing a single drop that was placed on a glass slide for only nano alumina or silica. (50 nm) and (25 nm) from nanopowder (Al2O3) and (SiO2), respectively were utilized as depicted in figures 1 and 2 that indicate the topography, and the particles distribution. The obtained images via the (AFM) microscope resemble topographical maps. The image color indicates to the material height. The image of lighter parts is higher. Figure 3 shows the micrographs of sintered sample (Al-4.5 wt%Cu- 1.5%Mg) base alloy at the best sintering temperature of (560 °C) and time of 60 min. It is believed sufficient for appreciable densification through conventional mechanisms such as particles rearrangement and enable Cu and Mg to diffuse into Al matrix. There are different grain sizes and clear grain boundaries of α-Al phase. Figure 4 indicates the analysis chart of (XRD) for the sintered parent alloy. Such results match with analysis of (XRD) of the sintered (Al-4.5%Cu-1.5%Mg) specimen at the best sintering temperature of (560 °C) for 60 min from reference [16]. It was found, when comparing with the peaks of diffraction from the aluminum powder, that the peaks of the copper powder and magnesium powder phases (Al2CuMg), (Al2Cu) and (Mg2Cu6Al5) are formed and distributed uniformly in α-Al-matrix. These phases possess less intensity in the pattern of diffraction, and this is ascribed to the weight low percentages of such phases in the parent alloy. Such resullts corroborated the alloying elements diffusion of copper and magnesium in the matrix of aluminum through the process of sintering and the intermetallic compounds formation as phases of strengthening.

Figure 1. The results of AFM for the nanopowder Al2O3: (a) 2D picture and (b) 3D picture.
Download figure:
Standard image High-resolution image
Figure 2. AFM results for the nano powder SiO2: (a) 2D picture and (b) 3D picture.
Download figure:
Standard image High-resolution image
Figure 3. Optical and SEM micrographs for sintered specimen of (Al-4.5 wt%Cu- 1.5%Mg) base alloy at 560 °C.
Download figure:
Standard image High-resolution image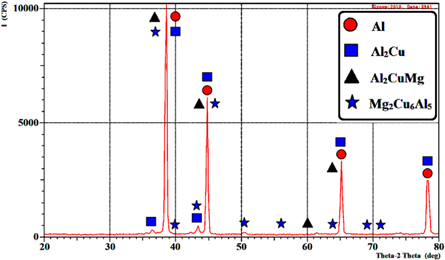
Figure 4. XRD analysis chart for sintered base alloy of the sintered (Al-4.5% Cu-1.5% Mg) sample at the best sintering temperature of (560 C°) for 60 min.
Download figure:
Standard image High-resolution image4.2. SEM-EDS elemental mapping analysis
Figures 5 and 6 show SEM-EDS elemental mapping analysis in the composites reinforced with 5 wt% nano alumina and silica respectively after sintering at 560 °C for 60 min. EDS analysis reveals the presence of oxygen and Al ,Si , Cu and Mg which confirms the presence of Al2O3 and SiO2 nanoparticles distributed homogenously in Al -matrix, in addition to intermetallic compounds of phases (Al2CuMg), (Al2Cu) and (Mg2Cu6Al5) as 2nd phase precipitates were observed as mentioned in above paragraph(4.1).
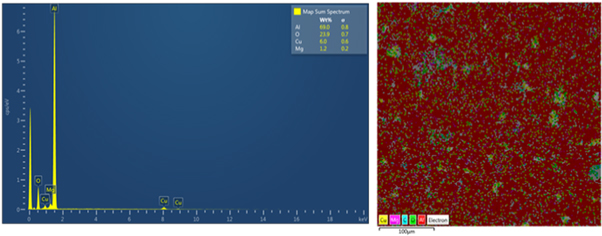
Figure 5. SEM-EDS elemental mapping analysis of the composites reinforced with 5 wt% nano Al2O3.
Download figure:
Standard image High-resolution image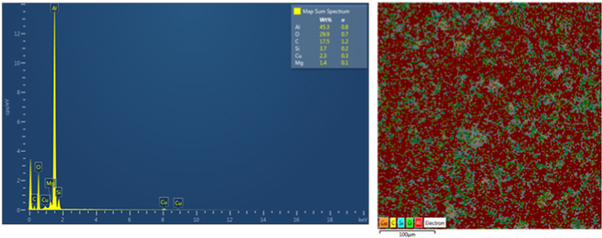
Figure 6. SEM-EDS elemental mapping analysis of the composites reinforced with 5 wt% nano SiO2.
Download figure:
Standard image High-resolution image4.3. Density and porosity results
The density and porosity measurement outputs beyond the process of sintering at 560 °C for 60 min for the parent alloy and composites that reinforced by Al2O3 and/or SiO2 nano particles are given in table 3. The base alloy density was noted to increase with the addition of 5% nano powder for each Al2O3 or SiO2, while the porosity percentage reduces in comparison with the parent alloy. This table also reveals the increased density from (2.63 g cm−3) to (2.68) g cm−3 and (2.66) g cm−3 with the addition of 5%Al2O3 and 5% SiO2 nanoparticles, respectively. These values are within the standard one (10%–20%) [17]. The density beside the less pores causes to increase the bonding of particles between the nanoparticles and the microparticles of the alloy (Al-4.5%Cu-1.5%Mg). The mismatch in the coefficient of thermal expansion between the alloy (Al-4.5%Cu-1.5%Mg) matrix and the nano Al2O3 or nano SiO2 could produce residual stresses about the scattered nano-particles which could cause microcracks and decrease in the mechanical characteristics. Furthermore, the nano Al2O3 or SiO2 present at the grain boundaries are assumed to act like barriers to avoid the grains close up. It has been found that the hybrid nano composities with 2.5%Al2O3 and 2.5% SiO2 (sample D) exhibited higher densities than the base sample (A) and samples (B and C). Such outputs agree with the researcher Cooke et al [18]. The density increment is associated with the porosity reduction for nano composities, and the pores are going to close with raising the nanoparticles addition. Such results are in conformity with the [19]. In the present study, the nanoparticles addition acts as micro filling and makes enhancement in the filling of pore such that the nano Al2O3 or SiO2 particles will fill the (Al-Cu-Mg) structure voids. This structure becomes compact and denser, resulting a densification influence that improves the sintered microstructure.
Table 3. The results of density, porosity and hardness of the nano composities samples beyond the sintering process at (560 °C) for (60 min).
| Symbol | Sample | Density g cm−3 | Porosity% | HV (kg mm−2) | Improvement% in Hardness |
|---|---|---|---|---|---|
| A | Base alloy (Al-4.5 wt%Cu-1.5 wt%Mg) | 2.63 | 16 | 89 | — |
| B | Base + 5 wt% Al2O3 | 2.68 | 12.1 | 145 | 62.9 |
| C | Base + 5 wt% SiO2 | 2.66 | 13.2 | 125 | 40.4 |
| D | Base + (2.5 wt%Al2O3 + 2.5 wt%SiO2) | 2.7 | 10.2 | 150 | 68.5 |
4.4. Micro-hardness measurements
Table 3 manifests the results of Vickers micro-hardness for the whole specimens at the sintered at 560 °C for (60 min). It was noticed that the specimens of (MMNCs) possess importantly higher micro-hardness than the base material. The micro-hardness increased with the addition of nanoAl2O3 or/and nano SiO2 powders in the aluminum matrix. That is owing to the higher micro-hardness of nano silica and alumina. Also, it was observed that the specimen of (MMNCs) reinforced by the hybrid addition of (2.5 wt% SiO2 + 2.5%wt Al2O3) has the highest value of micro-hardness in comparison with the parent alloy and composites specimens reinforced by a single addition. This is due to the good densification with a high density and decreasing porosity. Additionally, the particles of nano Al2O3 or SiO2 work as a filling medium that possesses has a high diffusivity and capability for entering the inter-spacing of Al phase crystal structure and closing the micro-porosity in the matrix of alloy. The hardness enhancement was (68.5%) for the hybrid addition of Al2O3 and SiO2. Several investigators confirmed such results in their research works, like Muna and Mohammed [19] and Ali Hubi et al [20]. Abdur Rahman et al [21] showed the improvement in hardness was 44.11% for Al 7150 alloy reinforced with 15 vol% of Al2O3 nanoparticles when compared to the unreinforced base alloy .
4.5. Corrosion results
In the current research, the existence of Mg and Cu, in the Al-α phase of base alloy (Al-4.5%-1.5%Mg) and also the intermetallic phases Al2CuMg and Mg2Cu6Al5 (as identified via the XRD) act like cathodic locations that promote the protective oxide film dissolution and improve the corrosion of pitting in the (3.5%NaCl) solution. These outputs are corroborated via the researcher of reference [22], which indicated that the intermetallic compounds reactively of copper and magnesium takes a role in the consistent dissolution of such compounds and re-deposition of Cu pursued via the localized dissolution of the encompassing aluminum matrix in accordance with the subsequent reactions:


The above clarified results corroborate that the (Al–Cu–Mg) inter-metallics are the desired locations for the pitting within the alloy (Al-4.5%Cu-1.5%Mg) or aluminum alloy (2024). Therefore, to realize the Al alloy corrosion behavior, it is necessary to study the passive films formed on the base alloy (Al–Cu–Mg) together with the alloys having the nanoparticles (SiO2 or Al2O3) for relating the electro-chemical behavior of corrosion of nano composites materials and base alloy to the passive films structure and chemical composition above their surface and for realizing the (Al–Cu–Mg) inter-metallics reactivity in the Al alloy.
Dimitrov et al [23] manifested that the potential of corrosion of the alloy (Al2CuMg) specimen was highly negative than the aluminum alloy (2024-T3) in a chloride solution. These results explained that one can assume that the discrepancies in the crystallographic structure can be noted between the obtained phases within the (Al–Cu–Mg) alloy matrix.
The anodic trend of Al2CuMg (S‐phase) specimens in (0.1 M) NaOH solution was studied. The distinctive critical potential trend of the de-alloying was noticed whilst sweeping the potential from the open circuit in the anodic direction.
Brown and Kobayashi [24] demonstrated that the electro-chemical behavior of the (Al–Cu–Mg) particles changed from the anodic to the cathodic towards the aluminum matrix owing to a change in their surface chemical composition. In this work, a similar phenomenon was noticed in studying the behavior of the electro-chemical corrosion of the sintered alloy (Al-4.5%Cu-1.5%Mg) in the solution of 3.5% NaCl.
In the present work, the added 5 wt% of (Al2O3) or 5% of (SiO2) to the base alloy (Al-4.5%Cu-1.5%Mg) led to shift the open circuit potential (Eocp) to (−551.2 mV) or (−620 mV), respectively to lower negative magnitudes than the parent alloy of −630 mV, as depicted in figure 7 and table 4.

Figure 7. Variation of the open circuit potential-time of the base alloy (Al-4.5%Cu-1.5%Mg) and nano composites reinforced by Al2O3 or/and SiO2 in (3.5%NaCl) solution.
Download figure:
Standard image High-resolution imageTable 4. Open circuit potential (EOCP) values and corrosion parameters results of the base alloy and nano composites samples.
| Condition | |||||
|---|---|---|---|---|---|
| Parameter | Base Alloy | 5%Al2O3 | 5%SiO2 | 2.5%Al2O3 + 2.5%SiO2 | |
| Eocp ( mV) | −630 | −551.2 | −620 | −259.2 | |
| Ecor (mV) | −700.2 | 546.2- | −625.6 | −230 | |
| Icor (μA.cm−2) | 177.18 | 33.50 | 56.10 | 9.84 | |
| Tafel slope | bc | −217 | −179 | −116.7 | −159.6 |
| ba | 80.5 | 73.6 | 56.7 | 145.2 | |
| C. R(mpy) | 89.7 | 16.9 | 28.4 | 4.9 | |
| Improvement in C.R% | — | 81 | 68.3 | 94.5 | |
| Pit energy cm2 | 1.4 | No pitting | No pitting | No pitting |
Table 4 lists the corrosion parameters results from the Tafel and cyclic polarizations in (3.5%NaCl) solution for composites reinforced by single and hybrid addition of (nano Al2O3) or/and (nano SiO2). Figures 8–11 evince the cyclic polarization curves for the parent material as well as the composites reinforced by 5 wt% Al2O3, 5 wt% SiO2 and hybrid addition of (2.5%Al2O3 + 2.5%SiO2), respectively in the (3.5%NaCl) solution. The curves of cyclic polarization for the base material and all nano composites are summarized in figure 12. It was found that the corrosion rate decreases with the addition of Al2O3 or/and SiO2 nanoparticles, whereas the resistance of corrosion of the composites reinforced by the addition of hybrid (Al2O3 and SiO2) nanoparticles samples showed a noticeable increase and became the greatest in comparison with the parent alloy and other composites. The corrosion potential (Ecorr.) of the hybrid composite reinforced was shown to be less negative (more noble) than that of the parent alloy and reinforced composites with the single addition of nanoparticles of Al2O3 or SiO2. Such results are in conformity with those of the researchers, Ramachandra et al [25] who found that the resistance of corrosion of nano composite of Al-alloy (AA6061) reinforced with 7.5% ZrO2 was higher than the parent alloy in the solution of 3.5% NaCl, and the rate of corrosion decreased significantly via increasing the percentage of ZrO2 nanoparticles in the nano composite.

Figure 8. Cyclic polarization curve of the base alloy (Al-4.5%Cu-1.5%Mg) at sintering temperature of 560 °C in the (3.5%NaCl) solution.
Download figure:
Standard image High-resolution image
Figure 9. Cyclic polarization curve of composite reinforced with 5% Al2O3 nanoparticles in the (3.5%NaCl) solution.
Download figure:
Standard image High-resolution image
Figure 10. Cyclic polarization curve of composite reinforced with 5% SiO2 nanoparticles in the (3.5%NaCl) solution.
Download figure:
Standard image High-resolution image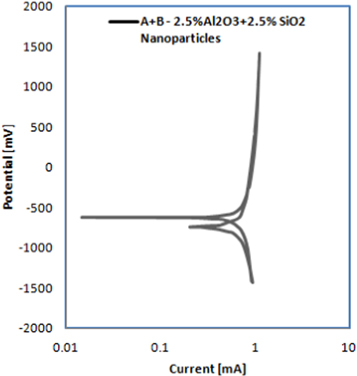
Figure 11. Cyclic polarization curve of hybrid nano composite reinforced with (2.5% Al2O3 + 2.5% SiO2) nanoparticles in the (3.5%NaCl) solution.
Download figure:
Standard image High-resolution image
Figure 12. Cyclic polarization curves of the base alloy and all nanocomposites in the (3.5%NaCl) solution.
Download figure:
Standard image High-resolution image4.6. Results after corrosion test
4.6.1. Micrographs characterization
Figures 13 and 14 illustrate the micrographic images of the sintered parent alloy and the hybrid reinforced composite by (2.5% Al2O3 + 2.5% SiO2) after the corrosion test, respectively. The Al2O3 or/and SiO2 nano particles addition increases the oxide film adherence to the metal surface, reduces the number of pits, and varies the shape and size of the pits. That is owing to the pits covering via the Al2O3 or/and SiO2 nano particles. Muna and Basma [26] confirmed these results in Al-4.5% Cu-1.5% Mg alloy reinforced with nano Al2O3 composites fabricated by powder metallurgy route.
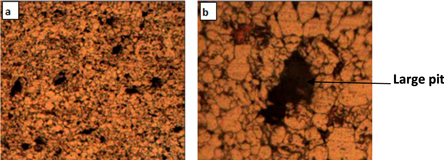
Figure 13. Micrographs images for the base alloy after corrosion test. (a) 100×, (b) 400×.
Download figure:
Standard image High-resolution image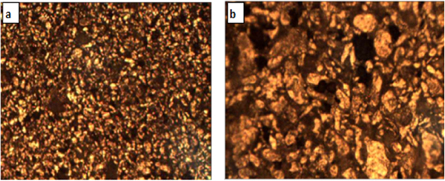
Figure 14. Micrographs images for the hybrid composite reinforced with (2.5% Al2O3 + 2.5% SiO2) nanoparticles after corrosion test. (a) 100x and (b) 400×.
Download figure:
Standard image High-resolution image4.6.2. Pitting energy measurement
From table 4, it was noticed that the pitting energy of the (Al-4.5%Cu 1.5%Mg) parent alloy and the reinforced nano composities with %Al2O3 and/or SiO2 nanoparticles after corrosion test in (3.5%NaCl) solution at the best sintering temperature (560 °C) gives the indication of the susceptibility to the pitting corrosion, as the pitting energy decreases, the corrosion rate reduces and the pitting corrosion resistance increases. And, the hysteresis loop represents the area under curve of the forward and reverse scan during the cyclic polarization. Nano composites samples reinforced with Al2O3 or/and SiO2 nanoparticles have no pits, i.e. no pitting energy.
4.7. Contact angle measurement
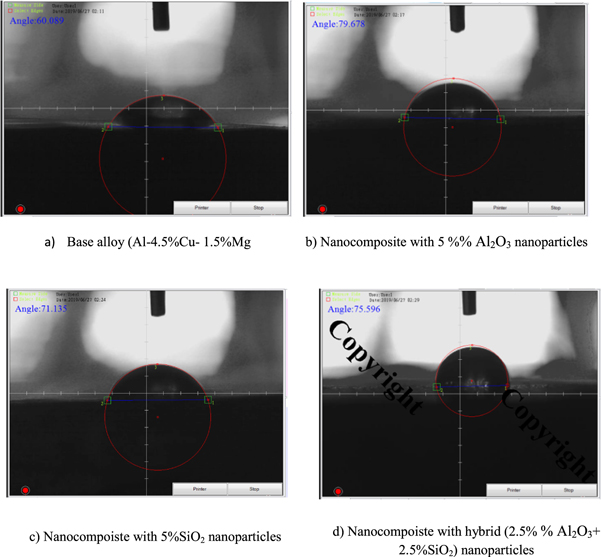
Table 5 shows the water contact angles of the base alloy (Al-4.5%Cu 1.5%Mg) and the reinforced nano composities with %Al2O3 or/and SiO2 nanoparticles at the best sintering temperature (560 °C) before corrosion test in (3.5%NaCl) gives an indication of the effect of nanoparticles in an enhancement of stability and continuous of protective oxide layer on the specimen surface and led to increase contact angles of composite specimens as compared to the base alloy. The contact angles obtained with specimens of the base alloy (A) and all nanocomposites (B,C&D) are 60.089°, 79.678°, 71.135°,and 75.596° respectively as shown in figures 15(a)–(d). It was observed that there are increasing in contact angles of all nanocomposites as ccompared to the base alloy. This is due to hydrophobic behavior of protective oxide film on the nanocomposite surface. Chien-TeHsieh et al [27] demonstrated the hydrophobic coating of silica nanoparticles onto microscaled carbon fabrics (CFs) and studied the superhydrophobic behavior of nanocomposite microstructures. The two composite surfaces are based on regularly ordered carbon fibers (8–10 μm in diameter) that are coated with SiO2 nanoparticles with an average size of 300–500 nm. The results showed that the increasing the density of silica on CFs showed significant effects on the enhancement of static contact angle, decrease of contact angle hysteresis, and superhydrophobic stability.
Table 5. Shows the results of the contact angle measurement of all samples.
| Symbol | Sample | Contact angle (degree) |
|---|---|---|
| A | Base alloy(Al-4.5%Cu 1.5%Mg) | 60.089 |
| B | Nanocomposite with 5% Al2O3 | 79.678 |
| C | Nanocomposite with 5% SiO2 | 71.135 |
| D | Nanocomposite with (2.5% Al2O3 + 2.5% SiO2) | 75.596 |
Figure 15. Contact angle measurement for the base alloy and all nanocomposites samples.
Download figure:
Standard image High-resolution image
5. Conclusions
- 1.The density of nano composities increased with the single and hybrid addition of nanopowder to the sintered base alloy (Al-4.5 wt%Cu-1.5 wt%Mg). The largest density value was with the hybrid nano composite reinforced via (2.5%Al2O3 + 2.5%SiO2) nano particales.
- 2.The hybrid nano composities reinforced via (2.5 wt% Al2O3 + 2.5% SiO2) nano particales showed the highest microhardness in comparison with the other composites and base alloy.
- 3.The Al2O3 or/and SiO2 nanoparticles addition to the parent material raised the resistance corrosion resistance of pitting in (3.5%NaCl) solution.
- 4.The hybrid nano composite reinforced via (2.5 wt% Al2O3 + 2.5% SiO2) nano particales revealed the lowest rate of corrosion compared to the parent alloy and the other composites. The enhancement in the resistance of corrosion was 94.5%.
- 5.The corrosion resistance of pitting was found improved with the addition of nano particles. The pits were noticed disappeared, also the loop of hysteresis disappeared from the anodic polarization curve for each nano composite.
- 6It was showed that the water contact angle of the base alloy was smaller than that of all nanocomposites reinforced with single and hybrid addition of (2.5%Al2O3 + 2.5%SiO2) nano particales.