

Abstract
This work was focused to relate the mechanical properties of weld beads with size and superficial density of the acicular ferrite (AF) needles changing by impregnating two different sizes of TiO2-nanoparticles at the bevel before the SAW process. Microstructure of weld metal with addition of TiO2-nanoparticles with 21 and 127 nm sizes, respectively, shows an increase of the density (61.3 and 75.4%) and length of AF needles formed (156.4 and 68.8%), in comparison to the weld metal without TiO2-nanoparticles, namely the WB-0. Moreover, chemical analyses at weld metal and inclusions of weld beads with TiO2-nanoparticles reveal and increase on their Ti contents respect to those in the WB-0. Tensile and yield strength of the weld bead fabricated with the smallest TiO2-nanoparticles diminished in comparison to other weld beads. Besides, it was found that the average Vickers microhardness of weld metal decreased by adding TiO2-nanoparticles. On the other hand, their Charpy V-notch toughness values were found to be 30.1 and 102.6% bigger respect to those of the WB-0, by adding TiO2-nanoparticles with 21 and 127 nm sizes, respectively. In general, it was found that by adding TiO2-nanoparticles before the SAW process, the density and dimensions of the AF needles increase, which could be associated with the improvement of toughness and ductility of weld beads.
Export citation and abstract BibTeX RIS
1. Introduction
Many research studies [1–3] agree that the acicular ferrite phase has a good combination of mechanical strength and toughness in the heat-affected zone and weld metal of weld beads. Furthermore, when it forms intergranularly contributes to prevent the initiation and propagation of cracks in these regions for low-carbon steels. The nucleation of this phase can be enhanced mainly by maintaining low oxygen levels in the weld metal and controlling the characteristics of inclusions such as type, size, chemical composition, optimal oxygen level, and an adequate crystallographic coherence with the surrounded weld metal [4–7]. To modify the chemical composition of the weld metal, it has previously been suggested [8–10] that chemical elements be incorporated into the molten weld pool. In this way, the added elements influence the chemical reactions of the welding group, which enhances the behavior of the inclusions as potential sites of heterogeneous nucleation for the growth of microstructures with fine grain size like acicular ferrite.
Several works reported that it is possible to improve the quality and mechanical properties of welds by applying certain nanoparticles in a wide variety of different methodologies or techniques during the welding process. For instance, Grigorenko et al [11] analyzed the structure of the welds made with low alloy steel and high strength, to which in the molten state, nanoparticles of various refractory compounds were added, including oxides, carbides and nitrides. They pointed out that the effective use of TiO2-nanoparticles allows obtaining better mechanical properties of the weld metal because it promotes the formation of the acicular ferrite phase, between 30%–90%. Furthermore, Fattahi et al [12] analyzed the effect of the TiO2-nanoparticles used in electrode coatings on the impact resistance of three weld metals prepared by the arc welding process. They reported that the addition of TiO2-nanoparticles is very effective in refining the ferrite grain size of the superheated microstructures of welding metals, which is attributed to the increase in the number of nucleation sites in the nanoparticles of oxide.
However, the use of nanoparticles in these and other welding processes has drawbacks related to the high costs and problems in the techniques used to obtain an efficient incorporation in the weld bead [13, 14]. Alternatively, this problem is intended to be solved by a technique consisting of applying homogeneously a solution of TiO2-nanoparticles with ethanol along to beveled surface of steel plates to be joined by Submerged Arc Welding (SAW) process [15]. In this way it is ensured that the TiO2-nanoparticles solution is completely covered by the flux during the formation of the weld bead, decreasing its losses towards the slag or atmosphere. Besides, this technique is novel because it maintains the beneficial effects on the mechanical properties of the weld beads. In addition, compared to other nanoparticle addition techniques currently employed, this technique is less expensive.
Thus, the main objective of this research work is to relate the mechanical properties with the morphological characteristics and surface density of acicular ferrite phase in weld beads with added TiO2-nanoparticles before SAW process. Besides, it is necessary to take into account the chemical composition of base metal, flux, electrode, slags and inclusions, over the surrounded weld metal, in order to evaluate their influence in the formation of acicular ferrite phase.
2. Materials and methods
The welding materials to form each weld bead consisted of a pair of AISI 1025 steel plates, a M12K electrode and a commercial fused flux (CFF), which chemical compositions are given in table 1. The individual steel plates were machined with 400 × 125 × 12.7 mm3 dimensions and one of its longest edges were beveled at 45° angle in order to form a simple V-groove by joining two of them. The dust and grease residues were removed from beveled surfaces of each individual steel plates using isopropyl alcohol before the SAW process.
Table 1. Chemical composition of welding materials (wt%).
| Material/Element | C | Na | Mg | Al | Si | P | S | Ca | Ti | Mn | Cu | Zr |
|---|---|---|---|---|---|---|---|---|---|---|---|---|
| Base metal | 0.22–0.28 | — | — | — | ≤0.04 | ≤0.04 | ≤0.05 | — | — | 0.3–0.6 | — | — |
| Electrode | 0.05–0.15 | — | — | — | 0.10–0.35 | ≤0.03 | ≤0.03 | — | — | 0.85–1.25 | 0.350 | — |
| CFF | — | 4.00 | 3.52 | 3.04 | 31.70 | — | — | 20.15 | 2.0 | 35.33 | — | 0.26 |
Prior to the formation of the weld bead, TiO2-nanoparticles with sizes of 21 and 127 nm were spread along the surface of the V-groove, in a solution with ethanol. The solution added to each weld bead was composed of 7 g of TiO2-nanoparticles in 12 ml of ethyl alcohol. It is important to emphasize that the necessary amount of solution was used on the bevel surface to impregnate it completely and in a uniform manner. In spite of having two particle sizes, the used TiO2-nanoparticles have the same density, so that it was decided to choose the same amount of material regardless of its particle size. The weld beads were fabricated with a NA-3S automatic welding machine operated at 600 A, 30 V, Direct Current Straight Polarity (DCSP) and a welding speed of 16 in min−1. The electrode had a diameter of 4 mm and the tip was centered on an extreme of the bevel and at 10 mm separated from its bottom. The V-groove, as well as the electrode tip and TiO2-nanoparticles suspension applied were completely covered with fused flux during the SAW process, which was carried out according to the AWS A5.17 welding standard. Furthermore, in order to analyze the influence of adding TiO2-nanoparticles in weld bead during the SAW process, it was necessary to compare the microstructure and mechanical properties for a weld bead obtained using only the typical welding materials, named as without the addition of TiO2-nanoparticles. The weld bead obtained without the addition of TiO2-nanoparticles was designated as WB-0, while those obtained with added TiO2-nanoparticles with sizes of 21 and 127 nm were named as WB-1 and WB-2, respectively.
Once the formation of each weld bead was completed, the formed slags were collected to analyze their chemical composition by SEM-EDS microanalysis, in order to know the loss of the TiO2-nanoparticles deposited on the weld bead towards the slag during the solidification stage. SEM-EDS microanalysis of slags were obtained by a JEOL JSM-6300 SEM with a Thermo Fisher Scientific x-ray Energy Scattering Spectrometer. The SEM was operated at 20 kV and the data acquisition was made with a NORAN System SIX. Besides, the chemical compositions of weld beads during the SAW process were determined through the quantitative chemical analysis technique by Ultraviolet-Visible Spectroscopy, using a Spectrophotometer Shimadzu UV 160, and following the standard test methods ASTM E352-93/E1019-03.
The microstructure of the heat-affected and weld metal of weld beads cross sections were analyzed by Optical and Scanning Electron microscopies. This study was done with the purpose of determining the surface density of microconstituents and their morphological characteristics. The weld beads cross sections were cut using a Buehler Abrasimet 9' cutting machine and metallographically prepared with emery papers up to 2500 grade paper, followed by polishing with alumina up to 0.3 μm in micro cloth and finally etched with 2% Nital during 8 s, in order to reveal the microstructure of heat-affected zone and weld metal.
The Optical microscopy was conducted with an Olympus PMG3 inverted metallographic microscope, with an adapted Moticam 2300 camera. The images were obtained at 200× and 500× magnification and they were processed with ImageJ software v.1.51j8. On the other hand, the SEM micrographs were obtained with a FEG-SEM FEI-XL30-Sirion, operated at 25 kV and spot size 5. Besides, the size and chemical composition of the inclusions present were determined in regions with predominant acicular ferrite phase using a Thermo Fisher Scientific x-ray Energy Dispersion Spectrometer was used at a 30° tilt angle, meanwhile the SEM was operated at 20 kV and spot size 5. Both the obtained images and the microanalysis data were processed by the Noran System 6 software.
A Shimadzu autograph universal machine was used for tensile test of plate-type specimens from WB-0, WB-1 and WB-2 weld beads at room temperature, following the ASTM E8/E8M 16a standard. The overall length of the plate-type specimens was 100 mm, meanwhile the length of the reduced parallel and grip sections were 32 and 30 mm, respectively. In addition, the width of the grip section and gauge length was 10 mm and 25 mm, respectively. Additionally, the Vickers Hardness was determined along the central line in the weld metal, heat-affected zone and the base metal. The microhardness tester was a Future Tech FM, following the ASTM E92 standard. Finally, a Tinius Olsen MP1/1 impact machine was used to evaluate the toughness of WB-0, WB-1 and WB-2 weld beads by quadruplicate in specimens with 55 × 10 × 10 mm3 dimensions at room temperature, through the Charpy V-notch impact test, following the ASTM E23-07a standard. The fracture surfaces of the impact toughness test specimens were analyzed using a FEG-SEM FEI-XL30-Sirion, operated at 20 kV and spot size 3.
3. Results and discussion
3.1. Chemical composition of slags and welds
Since the TiO2-nanoparticles are extremely fine, it is very important to determine where they are deposited during the formation of the weld bead. This is mainly due to the fact that during each of the paths of the welding machine on the bevel a considerable amount of dust and smoke is generated, where the TiO2-nanoparticles together with all the ions from the plasma and are trapped in the weld pool. Once the solidification process of the molten metal has been carried out, the TiO2-nanoparticles can be deposited in the weld bead or be lost towards the formed slag or stocked in burned flux through generated smoke and dust.
Figure 1 shows each elemental spectrum of the obtained weld beads. As shown in table 2, it was detected a 1.6% increase of Ti weight percentage content in the slag of weld bead with the addition of the smallest TiO2-nanoparticles in comparison to the other weld beads. However, since the TiO2-nanoparticles were completely covered by the flux during the formation of the weld bead, it can be expected that a high percentage of added Ti will be deposited and it will have a considerable influence on the final microstructure of the weld bead, but it is not reflected in the weight percentage content of welds, because the titanium is not soluble in the steel. The influence on the final microstructure due to the addition of TiO2-nanoparticles is expected to be lower in the WB-1 weld bead compared to the WB-2 weld bead, since the latter do not register a high increase in the weight percentage content of Ti with respect to the slag of the WB-0 weld bead.
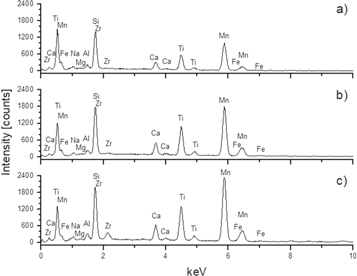
Figure 1. EDS elemental spectrum of slags formed at (a) WB-0, (b) WB-1 and (c) WB-2 weld beads.
Download figure:
Standard image High-resolution imageTable 2. Chemical compositions of formed slags by SEM-EDS (wt%).
| Slag in/Element line | Na K | Mg K | Al K | Si K | Ca K | Ti K | Mn K | Fe K | Zr L |
|---|---|---|---|---|---|---|---|---|---|
| WB-0 | 5.0 | 0.5 | 2.0 | 21.9 | 5.9 | 16.5 | 47.7 | 0 | 0.6 |
| WB-1 | 2.9 | 0.2 | 1.5 | 16.8 | 5.2 | 18.1 | 50.0 | 5.2 | 0.1 |
| WB-2 | 2.8 | 0.3 | 1.8 | 14.9 | 5.2 | 16.5 | 51.4 | 4.0 | 3.1 |
On the other hand, it can easily be seen in table 2 that Mn and Si are the elements with the greatest presence in the formed slag, because this is formed by silicates principally and absorb manganese silicates, compared with the weld pool. Besides, the high weight percentage content of Mn, Si and Ti in the formed slags indicates that a large ions amount of these elements was absorbed during the SAW process.
Table 3 shows the chemical composition for the obtained weld beads. Comparing with the weight percentage content of C in base metal, showed in table 1, is evident that this element decreases respect to the weld beads obtained with and without TiO2-nanoparticles due to the carbon reacts easily with the present oxygen forming CO and CO2, which are eliminated to the atmosphere. In addition, it was detected the increases in the Mn and Si contents of all weld beads, in comparison with that of the base metal, due to the high content in weight of MnO and SiO2 detected in the flux. This increases the possibility to obtain several complex oxides from the different reactions between metal ions and oxygen in the plasma, which form non-metallic inclusions that facilitate the growth of the acicular ferrite phase in weld beads. The increase in Mn and Si will directly affect the impact resistance of the weld beads.
Table 3. Chemical compositions of weld beads by Ultraviolet-Visible Spectroscopy (wt%).
| Weld bead / Element | C | Mn | Si | P | S | Ti | Cu |
|---|---|---|---|---|---|---|---|
| WB-0 | 0.13 | 1.48 | 0.57 | 0 | 0.012 | 0 | 0 |
| WB-1 | 0.08 | 1.73 | 0.21 | 0.013 | 0.0053 | 0 | 0.068 |
| WB-2 | 0.12 | 1.70 | 0.20 | 0.021 | 0.009 | 0.07 | 0.28 |
In addition, all the weld beads showed an increase in Si content, which will act as a steel deoxidizer, appreciably favoring mechanical strength and resistance to corrosion [16]. Moreover, the higher increase of Ti contents should improve the toughness of WB-2 weld bead in comparison to those of WB-0 and WB-1 weld beads.
3.2. Microstructure and chemical composition of inclusions
Figure 2 shows the microstructure formed around the interface between the weld metal (WM) and the heat-affected zone (HAZ) for WB-0 (a), WB-1 (b) and WB-2 (c) weld beads. Meanwhile, the WM microstructure was composed of allotriomorphic ferrite (ALF) and acicular ferrite (AF) microconstituents, the HAZ microstructure was formed by pearlite (P) and bainite (B) microconstituents, extra to ALF.

Figure 2. Images by OM (left) and SEM (right) showing the microstructure of the interfaces WM-HAZ at (a) WB-0, (b) WB-1 and (c) WB-2 weld beads.
Download figure:
Standard image High-resolution imageIn figure 3 it can be noted that the acicular ferrite grows with morphology like needles, mainly in the regions of dendritic solidification of weld metal. In order to compare its growth at different weld beads, length and surface density were determined. The lengths of the acicular ferrite needles were measured directly on the micrographs obtained by optical and scanning electron microscopies, using the ImageJ software. It is noted that the value reported corresponds to an average value, obtained by processing more than 20 regions with around 30 acicular ferrite needles.

Figure 3. Images by OM (left) and SEM (right) at the WM showing abundant acicular ferrite phase colonies and some inclusions, tagged with II, internal, and with EI, external, depending on their locations with respect to the AF-regions of (a) WB-0, (b) WB-1 and (c) WB-2 weld beads.
Download figure:
Standard image High-resolution imageOn the other hand, the surface densities of acicular ferrite were determined directly on the metallographic images obtained by optical microscopy at 200×. The procedure consisted in placing a milimetric grid on each metallographic image, observing and counting the number of squares occupied by the acicular ferrite phase. So that, the surface density was calculated from the ratio of the number of squares of the acicular ferrite phase to the total number of squares of the grid.
In table 4, it is clear the increase in length and surface density of acicular ferrite in WB-1 and WB-2, in respect to WB-0 weld bead. An increase of 156.4 and 68.8% in length of acicular ferrite needles was registered for WB-1 and WB-2 weld beads, respectively, compared to that of WB-0 weld bead. Furthermore, the surface densities of this samples increase also from 25.6%, for WB-0 weld bead, to 41.3 and 44.9% for WB-1 and WB-2, respectively. From these results, it can be established the influence of the addition of TiO2-nanoparticles on the acicular ferrite growth. Moreover, the morphological characteristics of acicular ferrite needles suggest a higher ductility for the weld beads with TiO2-nanoparticles added, in comparison to that of WB-0.

Figure 4. Diameter sizes of inclusions present at the weld metal of (a) WB-0, (b) WB-1 and (c) WB-2 weld beads.
Download figure:
Standard image High-resolution imageTable 4. Morphological characteristics and surface density of acicular ferrite phase.
| Weld bead/Parameter | Length (μm) | Surface density (%) |
|---|---|---|
| WB-0 | 10.45 | 25.6 |
| WB-1 | 26.79 | 41.3 |
| WB-2 | 17.64 | 44.9 |
Figure 3 (on right) shows SEM micrographs of inclusions in the regions having predominant acicular ferrite phase. In the SEM micrograph of figure 3, the inclusions present at the weld metal can be classified into two different types. The internal inclusions, indicated with II, are located inside of acicular ferrite needles, and they had a mean diameter between 2-4 μm, which promotes the growth of acicular ferrite phase. This size is consistent with the range of diameter reported by other authors [17]. This fact is due to the energy barrier for the heterogeneous nucleation of the ferrite phase on the inclusions that decreases with the increase in the area of the substrate surface. On the other hand, the external inclusions, indicated by EI, are located external to the acicular ferrite regions. These inclusions are larger and nucleate nearby regions with allotriomorphic ferrite phase.
Particularly, it was determined from the diameter sizes, which are shown in figure 4, that most of the inclusions in WB-0 and WB-2 weld beads had a smaller diameter size (2–3 μm) in comparison to WB-1 weld bead (3–4 μm), which means that the density of inclusions is lower in the WB-1 weld bead. Zhang and Farrar [18] observed that the number of inclusions, which act as ferrite nucleants in steel, results very important to obtain a microstructure with a high surface density of acicular ferrite. Moreover, both the size and the density of the inclusions are important factors to nuclear this phase. However, the dominant factor for nucleating the acicular ferrite phase is the chemical composition of the inclusions in the weld metal.
Figure 5 shows the elemental spectrum of inclusions at regions with acicular ferrite predominant in WB-0, WB-1 and WB-2 weld beads. This figure 5 also shows the average chemical composition of the weld metal surrounding, it which was taken as reference, to be sure that the chemical compositions of inclusions were not affected significantly due the inherent beam electrons spread into the sample by SEM-EDS analyze. According to the values in table 5, it could be verified that other than C and Fe, all the compositions values of the inclusions, were higher than those of the surrounding weld metal, for main elements like Mn, Ti, Si, Al and O, significantly higher respect to the inclusion of the surrounding weld metal components because the beam electrons broadening. Moreover, the electron penetration depths were estimated by the Kanaya-Okayama equation [19], obtaining around to 1.2 and 0.4 μm for the inclusions and weld metal, respectively. Such calculated penetration depth was always smaller than the minimal inclusion diameters, which turn in ensuring that the beam electrons do not interact with the weld metal under the inclusions.

Figure 5. EDS elemental spectrum of inclusions at regions with acicular ferrite phase of (a) WB-0, (b) WB-1 and (c) WB-2 weld beads, compared with (d) weld metal elemental spectrum.
Download figure:
Standard image High-resolution imageTable 5. Chemical compositions of inclusions and the weld metal by SEM-EDS (wt%).
| Inclusions in/Element line | C K | O K | Mg K | Al K | Si K | S K | Ca K | Ti K | V K | Mn K | Fe K |
|---|---|---|---|---|---|---|---|---|---|---|---|
| WB-0 | 2.9 | 14.0 | 0.1 | 7.3 | 5.7 | 0.4 | 0.2 | 1.4 | 0.1 | 8.7 | 59.2 |
| WB-1 | 1.8 | 25.3 | 0.1 | 2.1 | 12.4 | 0.6 | 0.2 | 2.5 | 0.1 | 25.1 | 29.9 |
| WB-2 | 2.2 | 10.0 | 0.1 | 2.2 | 7.8 | 0.3 | 0.4 | 2.8 | 0.1 | 9.4 | 49.9 |
| Weld metal | 3.5 | 1.9 | 0.0 | 0.2 | 0.7 | 0.1 | 0.1 | 0.1 | 0.1 | 1.5 | 92.0 |
The weld metal presents lower weight percentage values of the alloying elements in comparison to the values in the obtained weld beads. In particular, the Ti content is very similar to that obtained by quantitative chemical analysis, as shown in table 3, because in general, titanium has very low solubility in steel in comparison to elements like C and Mn [20]. Conversely, inclusions of the weld beads with added TiO2-nanoparticles showed a higher increase in the Ti and Mn weight percentage content with respect to those of the WB-0 weld bead.
In general, due to the inclusions in acicular ferrite regions at weld beads with added TiO2-nanoparticles show an increase of Mn and Ti contents respect to those without the TiO2-nanoparticles, the possibility of complex oxide formation in the inclusions increases, which favors the growth of the acicular ferrite phase. Besides, the increase in the Mn and Ti contents has a direct relationship to the increase in surface density of the acicular ferrite phase in the weld beads with TiO2-nanoparticles. Since the inclusions in the WB-0 weld bead have a high Al weight percentage content, so that the inclusions will be formed mainly by Al2O3, which, according to other authors [21, 22], it has been reported that this oxide inhibits the growth of acicular ferrite phase. Besides, inclusions at the WB-1 weld bead present the highest Mn contents in comparison to those at the WB-2 and WB-0 weld beads, decreasing the Mn depletion zone, which also inhibits the growth of acicular ferrite [23].
3.3. Mechanical properties of weld beads
The curves of strain-stress for WB-2 and WB-0 weld beads, as shown in the figure 6, present similar values of tensile and yield strength. By analyzing in detail each parameter presented in table 6, it can be noted that the yield strength (YS) value of the WB-2 is the highest in comparison to the value obtained in WB-1 and the WB-0 weld beads. On the other hand, the WB-1 weld bead presents a decrease of previous values, but at the same time, the reduction of the values of area and elongation presents an increase, which in turn could be related to a higher ductility.

Figure 6. Stress-Strain curves of obtained weld beads.
Download figure:
Standard image High-resolution imageTable 6. Parameters calculated in tensile test of weld beads with and without TiO2-nanoparticles.
| Weld bead | TS (MPa) | YS (MPa) | Reduction of area (%) | Elongation (%) |
|---|---|---|---|---|
| WB-0 | 600 | 456 | 48 | 26 |
| WB-1 | 505 | 344 | 73 | 33 |
| WB-2 | 604 | 491 | 50 | 40 |
Correlating the chemical composition, it can be concluded that the increase in the tensile and yield strength of the weld beads with TiO2-nanoparticles is directly related to the increase of Ti weight percentage content in the inclusions. Besides, the increase in acicular ferrite surface density in the WB-2 weld bead, improves the tensile and yield strength values compared to WB-1 and WB-0 weld beads. Additionally, the ductility increase of WB-1 and WB-2 weld beads can be attributable to the formation of broader and larger acicular ferrite needles compared to the WB-0 weld bead, as shown in table 4.
Due to the need to explain the mechanical properties, it was necessary to know the equivalent carbon (CE), because this value expresses the tendency of the material to form brittle structures, and therefore to promote the appearance of fissures. This value is given by the International Institute of Welding (IIW) by the following equation [24]

where the elements are expressed in weight percentage. The effects on mechanical properties of weld beads in order to obtain higher and lower CE values are related to produce higher and lower tensile strength and hardness, respectively. By the equivalent carbon values shown in table 7, it can be expected that the weld beads with TiO2-nanoparticles added had lower tensile strength and hardness values than those corresponding to the WB-0 weld bead. However, since a higher increase in the weight percentage content of Mn and Cu is observed in weld beads with TiO2-nanoparticles, it is likely that the tensile and yield strength will be favored in comparison to the WB-0 weld bead, but this is not happening by acicular ferrite size.
Table 7. Changes in the chemical composition and equivalent carbon (CE) values of the weld beads obtained (descending order).
| Weld bead/Element | Increase | Decrease | CE |
|---|---|---|---|
| WB-0 | Mn, Si | C, S, P | 0.52 |
| WB-1 | Mn, Si, Cu | 0.43 | |
| WB-2 | Mn, Si, Cu, Ti | 0.48 |
The Vickers hardness (VH) was determined in three different regions of the obtained weld beads, as shown in figure 7. WB-0 weld bead has higher average VH values in the heat-affected zone and weld metal compared to the corresponding values in WB-1 and WB-2 weld beads. Table 8 shows a decrease of average VH values in the heat-affected zone by 23.3 and 13.3% in the WB-1 and WB-0 weld beads, respectively, compared with the WB-0 weld bead; meanwhile the weld metal showed a decrease in average VH values by 12.4 and 11.4%, respectively. These results indicate a decrease in the fragility of the weld beads by the addition of TiO2-nanoparticles during the SAW process. In particular, the decrease of average VH values in the weld metal of the WB-1 weld bead can be correlated with the morphological characteristics of the acicular ferrite needles, which are shown in table 4. On the other hand, the decrease in the average VH values in the weld metal is consistent with the diminution of the equivalent carbon (CE).

Figure 7. Vickers hardness values in base metal (BM), heat-affected zone (HAZ) and weld metal (WM) of (a) WB-0, (b) WB-1 and (c) WB-2 weld beads.
Download figure:
Standard image High-resolution imageTable 8. Average HV values in weld beads with and without added TiO2-nanoparticles.
| Weld Bead | MB | HAZ | WZ |
|---|---|---|---|
| WB-0 | 155.5 | 217.2 | 201.7 |
| WB-1 | 155.9 | 166.5 | 176.7 |
| WB-2 | 156.7 | 188.2 | 178.8 |
Finally, the results of Charpy V-Notch impact test energy for weld beads without and with TiO2-nanoparticles additions are shown in table 9. It can be noted that the energy increased to 30.1 and 102.6% by the addition of TiO2-nanoparticles with sizes of 21 and 127 nm, respectively. This increase is interpreted as an increase of toughness in comparison to the WB-0 weld bead.
Table 9. Results of Charpy Impact test in weld beads.
| Energy absorbed during impact (J) | |||||
|---|---|---|---|---|---|
| Weld bead | 1 | 2 | 3 | 4 | aAvg. |
| WB-0 | 78.6 | 73.2 | 89.5 | 81.3 | 80.7 |
| WB-1 | 94 | 101 | 136 | 108 | 105 |
| WB-2 | 172.4 | 158.1 | 158.1 | 165.3 | 163.5 |
aAccording to the NMX-H-077-CANACERO-2017 Mexican standard, it is specified that for the evaluation of results, the highest and lowest value of the test should be discarded for all designations that require an impact test. The remaining values must be the same, or their energy level must be at least 27 J.
Following the Annex A6 of the ASTM E23-07a standard, it was estimated macroscopically that the percentage of the shear fracture on the surface of the specimens after the Charpy-V impact test was 66, 49 and 72% for the WB-0, WB-1 and WB-2 weld beads, respectively. On the flat fracture zone it has been observed a mixture of ductile and brittle fractures.
Figure 8 shows the dimples characteristic to the ductile fracture, having an average diameter of 3.3, 2.8 and 2.4 for WB-0, WB-1 and WB-2 weld beads, respectively. According to Zhou and Chew [25], concluded that the smaller size of the dimple in the ductile fracture, the higher increase in the absorbed impact energy. This agrees with the results reported in table 6.
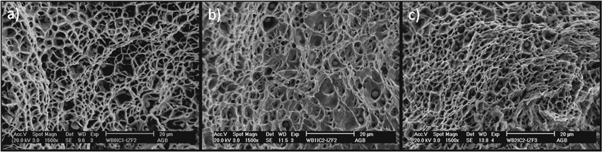
Figure 8. SEM fractographies showing the ductile zone at flat surface of tested impact specimens of (a) WB-0, (b) WB-1 and (c) WB-2 weld beads.
Download figure:
Standard image High-resolution imageOn the other hand, figure 9 shows the brittle fracture aspects, like parallel sheets in which fracture takes place by cleavage. These cleavage sheets had a smaller size in the WB-2 weld bead in comparison to those of the WB-0 and WB-1 weld beads. As has been reported in other works [12, 21, 26], the decrease in the size of cleavage sheets is associated with the formation of acicular ferrite and grain refinement.

Figure 9. SEM fractographies showing the brittle zone at flat surface of tested impact specimens of (a) WB-0, (b) WB-1 and (c) WB-2 weld beads.
Download figure:
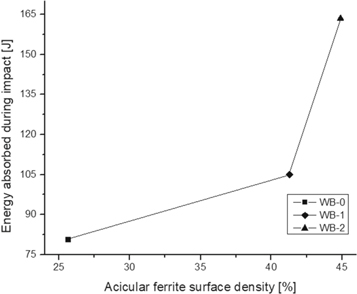
Standard image High-resolution imageMoreover, the toughness improvement of weld beads with TiO2-nanoparticles could be associated to the increase of Ti and Mn contents, but principally by the amount increase of acicular ferrite surface density in the weld metal, as shown in figure 10.
Figure 10. Relationship between the energy absorbed during the impact and the acicular ferrite surface density.
Download figure:
Standard image High-resolution image
According the obtained results, it could be affirmed that the best improvement of the toughness and increase of the ductility occurred by using TiO2-nanoparticles with a size of 127 nm. However, the last conditions choice will depend on the mechanical properties required to be improved according to the intended weld bead application.
4. Conclusions
The chemical analysis of the weld beads with TiO2-nanoparticles addition indicated an increase in Ti weight percentage content, which means that the TiO2-nanoparticles were deposited effectively in the weld bead.
The addition of TiO2-nanoparticles in weld bead has a direct influence on the tensile and yield strength, and the ductility. Besides, the most notable effect was related to the increase in toughness, in comparison to the weld bead without TiO2-nanoparticles.
The mechanical properties of the weld beads with TiO2-nanoparticles were principally correlated to the increase in Ti content in inclusions, which improves the size and surface density of the acicular ferrite needles respect to weld bead without TiO2-nanoparticles.
Acknowledgments
The authors are grateful for the collaboration of E Díaz-Valdés, J A Guillén-Cervantes and J Arias-Paniagua. Also, has appreciated the support provided by laboratories of the ESFM-Instituto Politécnico Nacional, ESIQIE-Instituto Politécnico Nacional, Universidad Autónoma Metropolitana-Azcapotzalco and Physics Department of CINVESTAV-Zacatenco.