

Abstract
The present work is focused on studying the wear behavior of marble filled hybrid NPNJE composites in slurry condition. A set of composites consisting of marble powder in different weight percentage (0 to 30 wt% in step of 10) are prepared using VARTM technique. Maximum erosion occurs at 45° and 75° for unfilled and marble filled composites respectively. The addition of marble powder has changed the nature of composite from ductile to semi-brittle as witnessed from the surface studies. The Taguchi analysis (L16 orthogonal array) is also employed to achieve a set of control factors that determines the minimum erosion rate, also corroborated through validation experiment. The best possible combination for minimum erosion rate is A1B2C1D2 as observed from the main effect plot. Factor A is observed to have more contribution in the analysis of slurry erosion behavior of NPNJE composites followed by factor B and C. The unfilled and marble filled NPNJE composite are characterized using FTIR to identify the functional groups and its constituents. Oka erosion model is employed to validate the dependency of the impingement angle for the obtained erosion result. Micro-cracking, fiber exposure and breakage, fiber-matrix debonding are dominant erosion mechanism as observed from surface studies.
Export citation and abstract BibTeX RIS
1. Introduction
The natural fiber (Jute, banana, coir, flax, hemp, sisal, kenaf, ramie etc.) is being used as reinforcement in Fiber Reinforced Polymer (FRP) composite which has been uplifted in the present era, due to its biodegradable nature with low cost, nontoxicity, high specific strength and ease of processing [1–3]. Fiber reinforced polymer (FRP) composites are generally used from automotive to aerospace, and pipeline to structural application. The application of natural fiber reinforced polymer (NFRP) composite has grown monotonically and are used nowadays in automotive, infrastructure and construction, furniture, packaging, sports [4, 5]. In many applications the mechanical and industrial parts have to baretribological loading like adhesion, erosion, two and three body abrasion and many more in the service [6]. The composites are exposed to the impact of solid particles, water droplets or under mixed environment leads to surface degradation and reduce service of the components [7].
The erosion effect can be easily identified on the basis of surface damage. In slurry erosion, liquid containing solid particles flowing on the surface causes progressive loss of the host material [8]. Therefore, it is necessary to study the tribological characteristics of the material while designing the mechanical parts. Past reports on [9–11] erosive wear performance of natural or synthetic fiber reinforced polymer composites were focused on the effect of solid particle impact on the material's life. It is also reported that polymer composites have poor erosion performace as compared to the metallic and ceramic materials. However, the performance of these composites can be increased by introducing the effective filler materials [6, 12, 13]. More often fillers are used in composites to bring the changes in its characteristic properties (physical, mechanical, thermal and Tribological properties) and to reduce the cost of material [14]. In fiber reinforced polymer composite various organic and inorganic filler materials such as Al2O3 [15], TiO2 [16], SiC [17] are in practice. In addition, some industrial and stone wastes such as fly ash [11], cenosphere [6], red mud [18, 19], blast furnace slag [20], cement bypass dust (CBPD) [13], granite [10, 21], and steel industry slag [22] etc. are also used as a filler material. The extensive literature review reveals that inclusion of hard particles in fiber reinforced polymer composite reduces the erosion rate significantly. Utilization of waste filler in composites not only reduces the cost but also offers to increase some of the mechanical and tribological properties of the composite by resolving the environmental issues.
It is learned that erosion performance of FRP composites is greatly affected by velocity, impingement angle, slurry concentration, fiber content, fiber orientation, fiber length, filler content, erodent size, erodent shape. The composite (short fiber aramid) with 30 wt% of fiber loading has shown maximum erosion resistance at 54 m s−1. velocity as revealed by Kumar et al [23]. In another study by Sharma et al [24], maximum erosion rate of marble dust filled hybrid composite was noticed at 60° impingement angle. Also it has shown that addition of filler more than 20 wt% has significantly increased the erosion resistance. In slurry erosion study on Al2O3 filled composites by changing various operating factors has shown maximum erosion rate at 60°. The slurry concentration and speed of slurry were witnessed to be the most influencing parameters as suggested by Joshi et al [25]. While Singh et al [26] in their study revealed that fiber and velocity are the most contributing parameters to minimize the erosion rate for sugarcane bagasse fiber reinforced epoxy based composites.
As far as tribological characteristic of the particulate filled FRP composite, a significant amount of work on air jet erosion has been reported. However, very few reports are available on the slurry erosion behavior of NFRP composites. Therfore, the present work is aimed to explore the influence of marble powder as a filler in needle punched nonwoven jute fiber reinforced epoxy (NPNJE) composites to evaluate its slurry wear performance characterstices.
2. Experimental material and method
2.1. Materials
Needle punched nonwoven Jute fiber (Arial Density = 200GSM, Thickness = 3 mm) is used as a reinforced material (supplier: A one jut felt,; Kolkata, India). The epoxy resin CY 230 and corresponsing hardner (Vendor: Excellence resin, Meerut, India) is used as matrix. Marble powder (size: 75–106 μm, density: 1.96 g cm−3) collected from Taj Marble Industry, Jaipur, India is used as a filler material.
2.2. Composite fabrication
The unfilled and marble powder filled composites are fabricated using vacuum-assisted-resin transfer-molding (VARTM) process is as shown in figure 1 and have been previously reported elsewhere [27]. In the fabrication of the composite, five layers of jute fiber are cut to dimension of 300 × 300 mm. After that the marble particles are sprayed on to each of the jute fiber layer using mist gun, followed by placing the layers over a glass mold on which silicon spray (mold release) is sprayed. A peel ply (permeable material which allows the flow of resin and easy removal of composites after fabrication from the flexible vacuum bag) is place on the top of arranged fiber layers. Subsequently, the infusion mesh is place over the peel ply. The role of infusion mesh is to evenly distribute matrix longitudinally and radially. The spiral tube is laid on the infusion mesh at two corners. One end of the inlet pipe is connected to the spiral tube while the other end is closed. Whereas one end of the vacuum line is connected with another spiral tube and vacuum pump through catch port is connected with another end of the spiral tube. The mold area is then covered with the vacuum bag and isolated using a sealant tape. It is then tested for any leak by producing vacuum. Once the leak proof system is assured then the closed end of inlet pipe is opened and put in the resin tank to allow the resin to flow in the mold. As the entire components in the flexible vacuum bag are impregnated, the resin flow is stopped and vacuum pump is switched on until all air bubbles are ejected. The mold is now kept at room temperature for 24 h to get cured. After that the composite panel is removed from the mold and samples are prepared as per ASTM standard for the slurry erosion test.
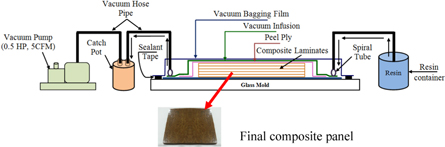
Figure 1. Schematic of composite fabrication process.
Download figure:
Standard image High-resolution image2.3. Slurry jet erosion
The slurry jet erosion test rig (figure 2) is used to assess the erosion resistance behavior of the developed unfilled and marble powder filled hybrid composite as per ASTM G-134 with respect to different operating parameters. The test rig consists of tank where erodent and water is stored, a mixing chamber in which erodent and water will be mixed and fed to the target material through a nozzle having internal diameter 5 mm and a sample holder that can orient from 15 to 90° angle in step of 15°. The prepared samples are weighed using ±0.01 mg weighing machine. After performing erosion test the samples are again cleaned to remove the erodent particles as well as wetness and again weighted to measure the mass loss.

Figure 2. Schematic of Slurry erosion test rig.
Download figure:
Standard image High-resolution imageThe erosion rate is calculated using equation (1)

2.4. Parametric optimization
2.4.1. Experimental design
In order to attain proper process optimization by making use of table of array, Taguchi methodology is considered as one of the most efficient and systematic techniques. This study was carried out with L16 orthogonal array to measure the effect of control parameters on the erosion performance of unfilled and marble filled composites. All the factors that can affect the erosive wear behavior, impact velocity, impingement angle, filler content and slurry feed rate are presented in table 1. This is followed by the ANOVA statistical analysis to measure the response of each parameters and its optimum condition using Minitab 16 software. After the parameters are assigned with its appropriate levels, the obtained results are transmuted into signal-to-noise ratio (denoted as ξ) for the evaluation of the characteristics. In the erosion performance of composites, smaller erosion rate is desirable. The erosion rate is assigned with the smaller is better characteristics and it is given by [28].

Where, a denote number of runs and b being slurry erosion rate of each run.
Table 1. Control factors and its level.
| Level | ||||||
|---|---|---|---|---|---|---|
| Control factor | I | II | III | IV | Unit | Designation |
| Impact velocity | 10 | 20 | 30 | 40 | m s−1 | A |
| Filler content | 0 | 10 | 20 | 30 | wt% | B |
| Impingement angle | 30 | 45 | 60 | 75 | Deg | C |
| Slurry feed rate | 160 | 195 | 230 | 265 | g min−1 | D |
2.4.2. Contribution ratio determination
The procedure to find the effect and contribution of each control factor on slurry erosive wear performance of NPNJE composite is as follows [29, 30]:
| Calculation of ξmean | |

|
(3) |
| Where, a denote number of runs. | |
| ↓ | |
| Determination of sum of squares (∀) | |

|
(4) |
| For the ith control factor, ∀due to variation about the mean (∀i) is | |

|
(5) |
| Where j represents the number of control parameters. | |
| ↓ | |
| Determination of percentage contribution | |

|
(6) |
2.5. Fourier transform infra –red (FTIR)
The Fourier Transform Infra-Red (FTIR) is used to identify the functional group and corresponding constituents present in the unfilled and marble dust filled NPNJE composites. The FTIR spectrum is recorded using FT-IR Spectrum 2 (Make: Perkin Elmer, USA). The spectra are captured for the fabricated composites from 4000 to 400 cm−1 in Attenuated Total Reflection (ATR) mode with a resolution 2 cm−1 at the rate of 8 scans per minute.
3. Results and discussion
3.1. Influence of impingement angle
Influence of impingement angle on slurry erosion resistance of marble filled and unfilled jute epoxy composites are presented in figure 3. Peak erosion appears to occur at 45 to 60° for unfilled and 75° for marble filled composites as observed from figure 3. A slight increase in erosion rate at normal incidence is also evident for unfilled composites whereas, no sign of such increment in erosion rate is observed for the marble filled composites. As discovered from the past literature, the maximum erosion rate appears to occur approximately in between 10–30° for ductile materials and, it diminishes as the orientation angle is increased. On the other hand, materials tend to erode less at lower impingement angle and increases steadily by reaching a peak at normal incidence (90°) showing the brittle nature. Performance of the material near to or at normal incidence angle may vary. Thus, influence of impingement angle becomes significant in order to study the nature of slurry impinging across the sample surface in actual case. From figure 3(b), increased erosion resistance can be witnessed by the addition of marble powder. The addition of marble powder may be attributed to change the nature of composite from ductile to brittle as evident from figure 3. This may be due to the inclusion of marble powder from 10 to 30 wt% may result in increasing the hardness of the composite which in turn attributes to change the nature of composite. The reduced erosion rate (figures 3(a) versus (b)) for marble powder filled composite is explained on the basis of the hardness of the marble powder inclusion. It is worth mentioning that the relative hardness of the composite play a significant role in combating erodent at different velocities as the erosion will be similar to abrasive wear in operating at acute angles. Noting to the above point, hardness of the target material becomes significant in lower impingement than at the normal incidence. It is because at lower impingement angle, scratch resistance of the target material determines its ability to avoid the damage which is dependent on its hardness. Remarkable decrement in the erosion rate can be achieved if the ratio of the hardness of the erodent to that of the target (He/Ht) < 1.2. For 30% marble powder filled composite, the ratio of He/Ht is less than 1 and for unfilled composite it is close to 2.5, which might be contributed as the leading reason for the removal of more material in unfilled composite than in marble filled composites. When the hardness ratio becomes less than 1, the slurry fails to penetrate deep into the target material and thus results in lesser erosion rate. At normal incidence angle, the proportional amount of kinetic energy transferred to the target material is high (increased normal component with reduced tangential component of force), therefore the extent of damage can be controlled by the mechanical properties including toughness, yield and ultimate strength, also the fatigue strength of the composites. The improved mechanical properties of the composites signify the inclusion of hard particles which absorbs the stresses as well as kinetic energy emitted by the slurry [31].
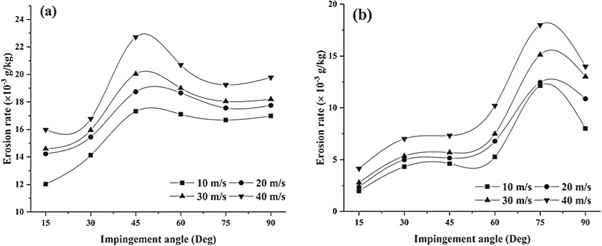
Figure 3. Influence of impingement angle on slurry erosion rate, (a) unfilled NPNJE composite, (b) 30 wt% marble filled NPNJE composite.
Download figure:
Standard image High-resolution image3.2. Influence of impact velocity
The slurry wear behavior of fabricated NPNJE composite against impact velocity is illustrated in figure 4. The material removal rate demonstrates a proportional relation with the velocity for both unfilled and the marble powder filled composites as illustrated from figure 4. The obtained results are obvious, because increase in operating velocity from 10 to 40 m s−1 causing the kinetic energy of the erodent to increase by fourfold. Also, the travel time for the erodent to reach the target surface will be halved by increasing the velocity by 4 times. Therefore, the level of severity in removal of material will also be multiplied by the increase in velocity by 4 times as can be observed from figure 4.

Figure 4. Influence of impact velocity on erosion rate measured at 45° impingement angle for 160 g min−1 slurry feed rate.
Download figure:
Standard image High-resolution imageThe results obtained are in convergence with the similar reports [10, 32]. At lower impact velocities (between 10 to 20 m s−1), very low erosion rate has been witnessed and correspondingly no significant variation is noticed in terms of erosion rate irrespective for different wt% of the filler content. In slurry erosion, the fluid carrying the erodent does not allow erodent to pierce the surface of target material owing to damping effect which resulted in lower erosion rate. As the velocity is increased to higher magnitude of 40 m s−1, a monotonic increase in erosion rate is noticed as the material tend to deform plastically by the way of removing the matrix material as the erodent penetrate deeper into the target material. However, a little variation in actual velocity to target impact velocity arises due to the particle rebound which signifies the fluid dynamic behavior [33–35].
3.3. Parametric analysis of slurry wear behaviour
The influence of each control parameter on the performance of the composites is determined with the help of SNR values and is listed in table 2. The result posted in table 2 demonstrates the addition of filler in the composites has significant contribution in increasing the slurry wear behavior of the composites. The wear rate obtained for 0 wt% composites are in the range of 9.63 to 18.64 and 7.45 to 15.06 for 10 wt%, 8.12 to 13.22 for 20 wt% and 7.12 to 14.05 for 30 wt%. the lowest wear response for the composites is noticed for experiment no.8 for 30 wt% measured at 20 m s−1 impact velocity, 60° impingement angle at a slurry feed rate of 196 g min−1. Also, as witnessed from the experiment no. 9, 0 wt% composite shows a highest wear rate measured at 30 m s−1 impact velocity, 60° impingement angle at 265 g min−1 of slurry feed rate. Impact velocity seems to be highly influential factor which is followed by impingement angle. The control parameters can be ordered accordingly from table 2 as impact velocity > impingement angle > filler content > slurry feed rate.
Table 2. L16 Experimental Design.
| Exp. No. | Impact velocity: A | Filler content: B | Impingement angle: C | Slurry feed rate: D | Erosion rate (g kg−1) | S/N Ration (dB) |
|---|---|---|---|---|---|---|
| 1 | 10 | 0 | 30 | 160 | 9.63 | −19.6725 |
| 2 | 10 | 10 | 45 | 196 | 7.45 | −17.4431 |
| 3 | 10 | 20 | 60 | 230 | 8.12 | −18.1911 |
| 4 | 10 | 30 | 75 | 265 | 11.78 | −21.4229 |
| 5 | 20 | 0 | 45 | 230 | 10.64 | −20.5388 |
| 6 | 20 | 10 | 30 | 265 | 7.98 | −18.0401 |
| 7 | 20 | 20 | 75 | 160 | 11.73 | −21.3860 |
| 8 | 20 | 30 | 60 | 196 | 7.12 | −17.0496 |
| 9 | 30 | 0 | 60 | 265 | 18.64 | −25.4089 |
| 10 | 30 | 10 | 75 | 230 | 15.06 | −23.5565 |
| 11 | 30 | 20 | 30 | 196 | 12.09 | −21.6485 |
| 12 | 30 | 30 | 45 | 160 | 14.05 | −22.9535 |
| 13 | 40 | 0 | 75 | 196 | 17.32 | −24.7710 |
| 14 | 40 | 10 | 60 | 160 | 11.68 | −21.3489 |
| 15 | 40 | 20 | 45 | 265 | 13.22 | −22.4246 |
| 16 | 40 | 30 | 30 | 230 | 10.79 | −20.6604 |
The main effect plot on the wear response of the composites against each control factor is presented in figure 5. The favorable combination to achieve the low erosion rate for the composite is at 10 m s−1 impact velocity, 10 wt% filler content, 30° impingement angle and 196 g min−1 of slurry feed rate. As seen from figure 5 decrease in SNR ratio can be noticed after the increase in velocity beyond 20 m s−1 implies increase in wear rate. This may attributes to the more pronounced impact of the erodent after achieving the high kinetic energy at high velocity [36]. Besides, highest wear rate is witnessed at 60° for unfilled and 75° for marble filled composite. This reflects the severity of the tangential and normal component of force respectively at 60° and 75°.
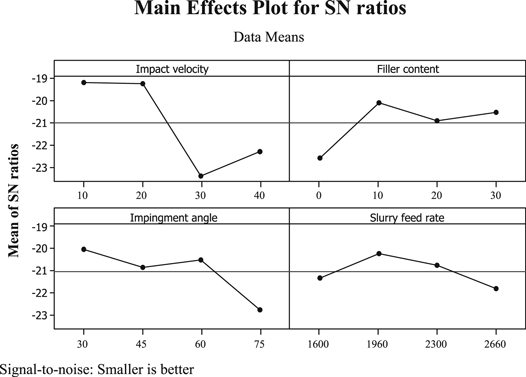
Figure 5. Main effect plot for ξ.
Download figure:
Standard image High-resolution imageThe statistical significance of the control parameters is identified using analysis of variance (ANOVA). ANOVA is performed for 5% level of confidence and the results are tabulated in table 3. From the last column of the table (P value) it is revealed that Factor A (P = 0.003) is highly significant factor, followed by Factor C (P = 0.021) and Factor B (P = 0.021).
Table 3. Analysis of Variance for Signal to noise ratio
| Source | DF | Seq SS | Adj SS | AdjMS | F | P |
|---|---|---|---|---|---|---|
| Impact velocity | 3 | 55.0540 | 55.0540 | 18.3513 | 65.86 | 0.003 |
| Filler content | 3 | 14.4020 | 14.4020 | 4.8007 | 17.23 | 0.021 |
| Impingement angle | 3 | 17.7760 | 17.7760 | 5.9253 | 21.26 | 0.016 |
| Slurry feed rate | 3 | 5.8239 | 5.8239 | 1.9413 | 6.97 | 0.073 |
| Error | 3 | 0.8360 | 0.8360 | 0.2787 | ||
| Total | 15 | 93.8919 |
S = 0.527 883 R-Sq = 99.11% R-Sq (adj) = 95.55%
3.3.1. Validation experiment
The validation experiments in Taguchi's approach are required to validate the outcomes drawn during the analysis stage. This test is performed by considering the new set of control factor setting A1B3C2D3 to predict the erosion wear rate of NPNWJFE composites. The predicted ξ for erosion performance can be calculated using following prediction equation (7) [11].

Where  is the predicted average value,
  represents the overall mean of signal to noise ratio, A1, B3, C2 and D3 is the mean response of the factors at designated level. The slurry erosion experiment is performed by considering new arbitrary combination of control factors and obtained result is compared with the predicted ξ for erosion rate calculated using prediction equation and tabulated in table 4. It can be observed from the table that the difference between predicted and experimental value is 0.6329 which represents that the experimental ξ is very close to predicted value of ξ. An error of 3.29% is occurred which shows the strong correlation between experimental and predicted results and the resulting model is capable to predict the erosion rate with reasonable accuracy.
Table 4. Results of the validation experiments.
| Optimal control factors | ||
|---|---|---|
| Prediction | Experimental | |
| New set of level | A1B3C2D3 | A1B3C2D3 |
| ξ for erosion rate achieved (dB) | −18.5749 | −19.2078 |
The contour plot shown in figure 6 is drawn for the significant factors as observed from table 2. As can be seen from contour plot drawn in combination of impact velocity with impingement angle and impact velocity with filler content clearly shows a distinct nature of the factors used in figure 6 (region of dark green and blue from both contour plot figures). It is apparent from figure 6 that highest erosion rate is obtained for 35 m s−1 at 60°, whereas lowest erosion rate is obtained for 15 m s−1 at 60° attack angle for lowest wear rate. Further, for unfilled composites highest erosion rate is obtained for 35 m s−1 at 0 wt%, whereas lowest erosion rate recognized is at 15 m s−1 at 10 wt% filler content. These results depict to increase the erosion rate monotonically with the increase in impact velocity. Besides, it is necessary to evaluate the effect of each factor (% contribution) on the erosion rate in order to depict the order of contribution of individual factors and is determined by using equation (7). From tables 5 and 6, the most contributing factor on erosive wear response of the composite is impact velocity with a contribution ratio of 58.97%, followed by impingement angle with 19.38%. The effect of filler content and slurry feed rate to be ranked 3rd and 4th in the order of contribution between 6%–15%. Therefore, it can be observed that monotonic wear rate can be witnessed by increasing the impact velocity as well as impingement angle. The results are in great convergence with the previous reports [28].
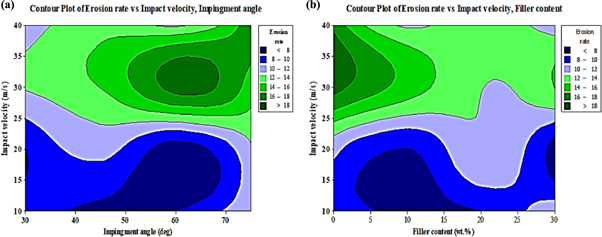
Figure 6. Contour plot (a) Erosion rate versus Impact velocity and impingement angle (b) Erosion rate versus Impact velocity and filler content.
Download figure:
Standard image High-resolution imageTable 5. Contribution of the control factor on erosive wear response of the filled and unfilled composite.
| Control factor | ξmean | ∀i | ∀ | (%contribution)i |
|---|---|---|---|---|
| A: Impact velocity | −21.0335 | 13.841 | 23.4679 | 58.97 |
| B: Filler content | 3.6 | 15.41 | ||
| C: Impingement angle | 4.55 | 19.38 | ||
| D: Slurry feed rate | 1.46 | 6.22 |
Table 6. Response table for SNR on erosive performance of the filled and unfilled composite.
| Control factors | |||||
|---|---|---|---|---|---|
| Levels | Impact velocity | Filler content | Impingement angle | Slurry feed rate | |
| ξaverage (dB) | 1 | −19.185 | −22.5975 | −20.005 | −21.34 |
| 2 | −19.255 | −20.0975 | −20.8375 | −20.2275 | |
| 3 | −23.3925 | −20.915 | −20.5025 | −20.74 | |
| 4 | −22.3 | −20.5225 | −22.7875 | −21.825 | |
| ξmax-ξmin | 4.20 | 2.5 | 2.78 | 1.59 | |
| Rank | 1 | 3 | 2 | 4 | |

Figure 7. Influence of impingement angle on slurry erosion rate, (a) unfilled NPNJE composite, (b) 30 wt% marble filled NPNJE composite with curve fit as per Oka model [37].
Download figure:
Standard image High-resolution image3.4. Validation of dependency of Impingement angle with erosion model
It will always be helpful if the experimental data is configured in the form of correlation that establishes ease in demonstrating the behaviour of the materials for the chosen conditions [38]. Many models can be witnessed from the literature which is expressed as a function of the operating parameters. Amongst them, Finnie's erosion model drawn on the metal cutting theory is beneficial for ductile materials. Following him, Bitter [39], Evans [40], Sundararajan [41], Hucthings [42] have devised models which are based on the combined effect of theory of metal cutting and plastic deformation. Capability of any erosion model to predict the behaviour of material lies in the complex nature of the erosion process. Therefore, a simple and the most preferable erosion model that seems to be the best fit for all the materials is given by Oka [37] as follows.

Where, g(α)is the ratio of maximum erosion measured at any oblique angle (α < 90°) to the normal angle (90°)caused by angular particles.

Here, the importance of any attack angle (0–90°) on erosion rate is represented by g(α), which is defined using trigonometric function based on hardness number (Hv).


Equation (5) is obtained after rearranging equations (1)–(4). The value of velocity exponent n1 and n2, α is dependent on the hardness of the target material, followed by particle shape.
A non linear least square method of curve fitting is used in the present work and it is correlated with the Oka model. MATLAB software (Version R2017b) is also utilised to determine the values of the constants C, n1 n2 and n. The constants n1 and n2 are assigned between 0 and 2 as upper and lower limits, while 2.5 is assigned for the third velocity component. Table 7 shows the obtained values of all the constants that demonstrate the good fit (>90%) with the correlation coefficient (R2). The curve fitting of erosion damage for unfilled NPNJE composite and 30 wt% marble filled composite using Oka model [37] is shown in figure 7.
Table 7. Values of constants of nonlinear curve fit.
| NPNJE Composite | C | n | n1 | n2 | R2 |
|---|---|---|---|---|---|
| 0 wt% | 0.058 | 1.57 | 1.015 × 10⁻⁸ | 1.158 | 90.05 |
| 10 wt% | 0.069 | 1.85 | 1.785 × 10⁻⁷ | 1.289 | 91.38 |
| 20 wt% | 0.073 | 1.91 | 1.897 × 10⁻⁷ | 1.369 | 93.54 |
| 30 wt% | 0.075 | 1.96 | 1.912 × 10⁻⁷ | 1.378 | 94.12 |
3.5. FTIR analysis of unfilled and marble filled NPNJE composites
The figure 8 shows the FTIR transmission spectrum of unfilled and 10, 20 and 30 wt% marble dust filled NPNJE composites. The small broad transmission band at 3372 cm−1 is related to the –OH stretching vibration of the hydroxyle group [43]. The intensity at 2925 cm−1, 2926 cm−1 and 2930 cm−1 for all four composites shows the presence of C–H stretching vibration and CH2 stretching [44]. Peak at 2858 cm−1 is indicating the presence of C–H stretching of carboxylic acid group. The peaks nearby 1724 cm−1, 1604 cm−1 and 1505 cm−1 may be attributed to C=C stretching mode vibration of carbonyl group of lignin and aromatic ring skeleton vibration. The transmittance band appears around 1458 cm−1 and 1367 cm−1 in all four spectrum attributed to the CH2 bending in lignin and CH3 bending group respectively [45]. The peaks at 1236 cm−1 illustrates the presence of C–O stretching vibration of acetyl. Consequently, the peak in the range of 1030–1150 cm−1 is attributed to the presence of C–O, C–O–C and –OH stretching vibration of secondary alcohol group of cellulose [5, 46]. The transmittance intensity at 825 cm−1 is observed for all samples shows the presence of stretching vibration of Si–C bond. It is observed that the absorption peak intensity increases with the addition of marble powder in the composites. The peak observed at 557 cm−1 shows the bending vibration of C–OH [47].

Figure 8. FTIR spectra for unfilled and marble dust filled NPNJE composite.
Download figure:
Standard image High-resolution image3.6. Surface morphology studies of eroded samples
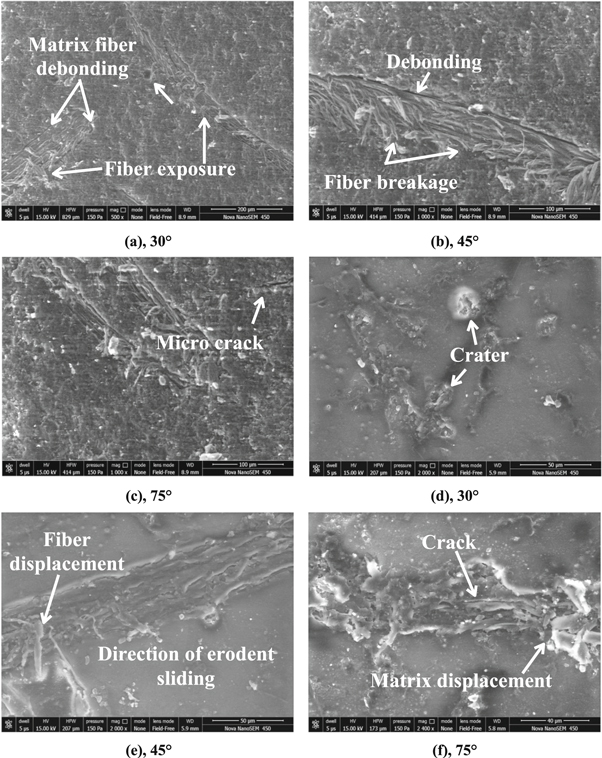
The morphologies of the eroded surface of unfilled and marble dust filled NPNJE composites are presented in figures 9(a) to (l). Ductile materials erode from angle 15–30° and for the brittle material the maximum erosion is observed to be between 75–90° [11]. It is learnt from the literature that degradation of the surface due to repeated impact of erodent in slurry medium attributes to removal of matrix to cause spalling and cracking leads to the formation of crater, debonding, micro-cracking, fiber exposure, and fiber fracture. As can be observed from figures 9(b), (f), (i) and (l) the maximum erosion occurs to be at 45° for unfilled and at 75° for marble dust filled NPNJE composite. The nature of material removal is dependent on the impact velocity, operating angle, size and shape of erodent under different concentration of slurry. Shallow crater and fiber exposure is observed from figure 9(a) at 30° impingement angle, while fiber exposure and debonding of matrix and fiber can be seen in figure 9(b) showing the tendency to maximum erosion as a result of repetitive impact of uneven erodent at a particular point [48, 49]. At oblique angles the impact force is divided into two components namely normal and tangential. From figure 9(b), the combined effect of these two forces allowed the erodent deep in to the target material (beyond elastic strain), thereby simultaneous act of debonding and fiber exposure is evident. The benefit of increase in normal and tangential force at 75° is more preferential in inducing micro cutting and fiber breakage as witnessed from figure 9(c). The significantly contributing erosion mechanisms in case of marble filled NPNJE composites noticed is fracture of fiber and matrix removal as shown in figures 9(d)–(l). Moreover, the matrix removal in terms of pits formation can also be observed from figures 9(d)–(l). Therefore, the above discussion leads to conclude that fracture toughness of the fibers plays a vital role. The formation of crater indicates the presence of erosion mechanism originated from the removal of matrix in terms of pits. The repetitive impact of the erodent at a place from where the matrix is already been removed (pits) induces crack due to the variation in stresses upon increasing the velocity to 40 m s−1 (figures 9(j)–(l)). Further increasing impingement angle to 75° the tangential component losses its magnitude to normal component. When this normal component of impact force exceeds the limiting value, the solid particles pierce deep into the target material as a result of increased ratio of He/Ht as explained in section 3.1, now the material degradation takes place in terms of small fragmentation. This penetration leads to gouging deep tracks in the surface and generates small cracks in the subsurface (figure 9(l)). Another mechanism that is encountered for 30 wt% marble dust filled composite (figures 9(k) and (l)) is cracking and spalling as well as river pattern of the matrix. This may be due to the crack that is originated at the surface adjacent to the marble particle and matrix as a result of increase in localized stresses from the place where craters have already been formed. Pits acts as stress riser upon increasing erodent loading which initiates cracks on the surface. When the individual crack coalescent with the adjacent crack leads to the formation of cluster of craters.
Download figure:
Standard image High-resolution image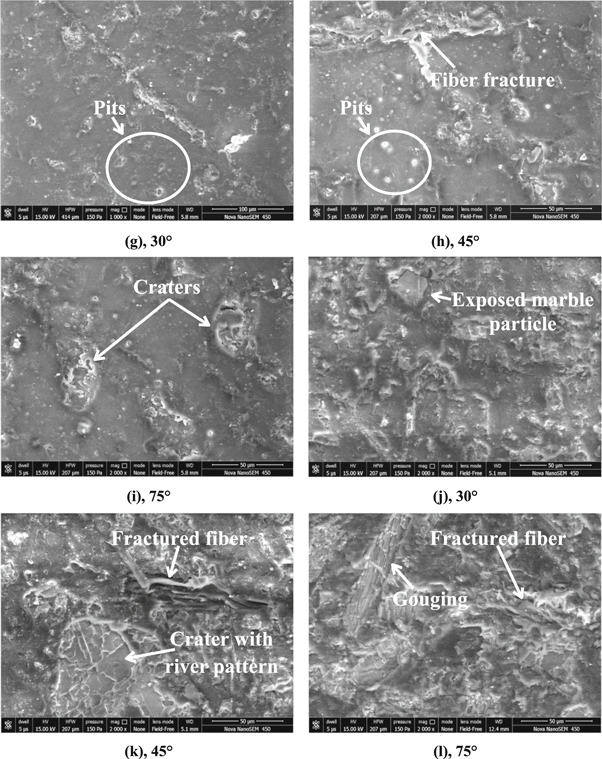
Figure 9. Surface morphology of, (a)–(c) 0 wt%, (d)–(f) 10 wt%, (g-i) 20 wt% and (j)–(l) 30 wt% measured at 40 m s−1.
Download figure:
Standard image High-resolution image
4. Conclusion
- 1.The erosion rate shows a proportional relation with the velocity for both unfilled and marble powder filled NPNJE composites, as a result of increase in kinetic energy of the erodent by fourfold.
- 2.Peak erosion appears at 45° for unfilled and 75° for marble filled composites. This attributes to the addition of marble powder that has changed the nature of composite from ductile to brittle.
- 3.Addition of filler in the composites has significant contribution in increasing the erosion resistance of the composites. The erosion rate obtained for 0 wt% composites are in the range of 9.63 to 18.64 and 7.45 to 15.06 for 10 wt%, 8.12 to 13.22 for 20 wt% and 7.12 to 14.05 for 30 wt%.
- 4.The control factors can be ordered accordingly, A (impact velocity) > C (impingement angle) > B (filler content) > D (slurry feed rate). From the main effect plot of ξ, the possible best arrangement to achieve the low erosion rate is in the order of A1 ( 10 m s−1), B2 (10 wt%), C1 (30°) and D2 (195 g min−1). The percentage contribution of each control parameter is 58.97, 15.41, 19.38 and 6.22% respectively.
- 5.Several erosion mechanisms have been observed microscopically. Micro crack, fiber fracture, fiber displacement, gouging, debonding between fiber and matrix, formation of crater and pits are the main characteristic features of the erosion and material removal from the surface.
- 6.The dependency of impingement angle measured using a nonlinear least square method on Oka model shows the obtained values of all the constants that demonstrate good fit (>90%) with the correlation coefficient (R2).
Acknowledgments
Authors are grateful to the support of Center for Development of stone (CDOS) Jaipur (India), Material Research Centre, MNIT Jaipur (India) for its characterization facility as well as Advance research lab for Tribology, MNIT Jaipur (India) for providing experimental facility.