

Abstract
Carbon incorporated TiO2 nanocomposite powders were synthesized by a facile thermal co-decomposition of a mixture of titanium tetrachloride (TiCl4) and sucrose (C12H22O11) as a source of carbon ions. The crystalline structures were studied by x-ray diffraction (XRD) method through the Rietveld refinement technique of analysis. It was found that the samples consist of anatase (A) and rutile (R) with a small amount of brookite (B). It was noticed that the incorporation of C ions in TiO2 lattice enhanced the A to R transformation through creation of oxygen (O)-vacancies. It was concluded that the incorporated small-size C ion-species might occupy interstitial positions in the lattice of host TiO2. Such incorporation should create O-vacancies due to the re-distribution of static charges of ions. The optical properties were investigated by the diffuse reflection spectroscopy (DRS) method. The C-ions incorporation red-shifted the optical band gap, while the hydrogenation of the samples blue-shifted the band gap according to Moss-Burstein effect. Annealing the samples in H2-atmosphere could create O-vacancies, increase carrier concentration, and toss the incorporated in the interstitial C ion-species to occupy the O-vacancies (CO). The possible creation of FM behavior due to CO ions mutual interaction depends on their average separation (RC–C) that was estimated to explain the obtained ferromagnetic (FM) results. The FM properties were observed only with hydrogenated samples that incorporated by ∼1% C. The effective magnetic moment was evaluated to be 1.24 μB/C, which was attributed to the magnetic moment of C2p in addition to some contributions to O-vacancies. This study showed the critical importance of hydrogenation processes to create FM properties in C-incorporated TiO2 nanocomposites.
Export citation and abstract BibTeX RIS
1. Introduction
Titanium oxide (TiO2) is widely used in many applications. The physical and chemical properties cause TiO2 to contribute in different fields such as photovoltaics, photocatalysis, gas sensing, pigments, protective coatings, dielectric materials, etc, [1–3]. It can have excellent photocatalytic properties depending on synthesis details including kinds of controlled chemical impurities [3, 4]. However, it has a large energy gap (∼3.2 eV) in the UV spectral region. Therefore, in order to let TiO2 functioning as photocatalytic in visible light, its optical band gap has to be decreased. The control of band gaps is usually performed by suitable doping. Moreover, the doping process could create in TiO2 oxide exotic properties that widen its applications. For instance, the doping by transition/rare-earth ions could create room-temperature ferromagnetic (RT-FM) properties. Occasionally the doping with nonmagnetic ions can also create RT-FM. Carbon ions were used at certain conditions as dopant ions to create RT-FM in many transparent conducting oxides (TCOs) like ZnO, In2O3, SnO2, etc [5–9]. Many Authors attributed the creation of FM in C-doped ZnO material to the substitution of structural O by C (CO) ions i.e. the magnetism emerged due to the Zn–C system in ZnO environment and the magnetic moment is contributed mainly by the carbon 2p orbitals (0.80 μB) [5]. In general, the reasons for the creation of RT-FM in C-incorporated TCOs are not clear. The present work deals with the effects of C incorporation on the structural, optical and magnetic properties of host TiO2 nanocomposite, focusing on the conditions necessary to create RT-FM.
2. Experimental materials and synthesis
Pure and C-incorporated TiO2 (TiO2–C) nanocomposite powders were synthesized by using pure titanium tetrachloride (TiCl4) liquid and refined sucrose (C12H22O11) (Sigma-Aldrich products) as starting complexes. The preparation was carried out by a simple thermo-chemical process including co-decomposition of the complexes. To synthesis pure TiO2, a precursor of 3 ml of TiCl4 liquid mixed with 30 ml of pure ethanol was prepared in a beaker. The solution was magnetically stirred for ∼30 min at RT before the addition of the ∼120 ml of deionized distilled water. Then, the temperature of the main solution was raised slowly to ∼60 °C with stirring for ∼20 h until a dry powder was formed in the beaker. The powder was collected and a flash sintering in the air at 500 °C/2 h followed by cool with the oven to the RT. The formed powder was found to be pure TiO2. To synthesis C incorporated TiO2, a controlled amount of sucrose as a source of carbon was added to the main solution. Three nominal (C/Ti) mass ratio powders were synthesized: 1%, 2% and 8.5%, which were referred as TiO2–Cn (n = 1, 2, 3), i.e. TiO2–C1, TiO2–C2, and TiO2–C3, respectively. Moreover, samples of each powder were annealed in a hydrogen atmosphere (hydrogenated) at 400 °C for 20 min and referred to TiO2–Cn–H, i.e. TiO2–C1–H, TiO2–C2–H, TiO2–C3–H, respectively. Pure TiO2 and hydrogenated TiO2–H were prepared as references. All the prepared samples were pelletized for characterization.
The structural analysis was performed by the x-ray diffraction (XRD) with a Rigaku Ultima-IV diffractometer. The optical properties over the range 200–1000 nm were studied by the diffuse reflectance spectroscopy (DRS) method with a Shimadzu UV-3600 spectrophotometer equipped with an integrating sphere. The magnetic properties were measured by the vibrating sample magnetometer (VSM) method with a PMC MicroMag-3900 over the range ±10 kOe at a step of 25 Oe/1 s at RT.
3. Structural characterisation
TiO2 crystallizes in three main structures; the stable phase (rutile-R) and two metastable phases (anatase and brookite). The brookite phase is usually difficult to synthesize [10]. Figure1(a) shows the XRD patterns of pure and C-incorporated TiO2 powder samples. Figure1(b) shows the XRD of the hydrogenated samples. The structural analyses revealed a formation of anatase (A) phase with amounts of rutile (R) and brookite (B). The Bragg reflections were indexed according to the early known crystallographic data [11, 12]:
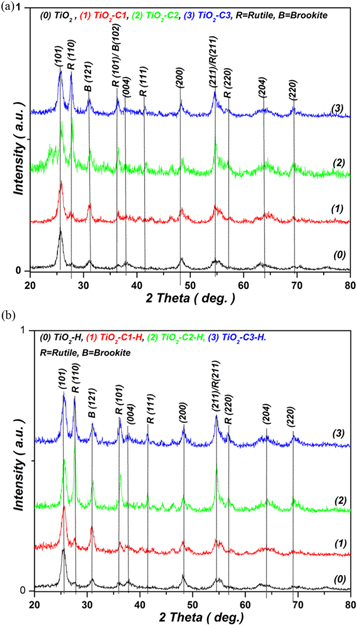
Figure 1. (a) XRD patterns of the as-prepared samples showing that C incorporation enhanced the crystallization of R phase of TiO2. (b) XRD patterns of the hydrogenated samples. The hydrogenation enhanced the A to R transformation.
Download figure:
Standard image High-resolution imageHowever, it is not easy to find the exact % content of each phase in the synthesized powder sample due to the strong XRD signal overlapping. For instance, the main anatase (101) diffraction peak at 2θ = 25.28° overlaps with the brookite (120) and (111) peaks at 25.34° and 25.69°, respectively [13]. The Rietveld refinement technique was used by the built-in PDXL software to analyze the crystalline structure and find the lattice parameters. The average crystallite size (CS) was calculated through Hadler-Wagner (H-W) equation [14]:  where θ is the Bragg's angle, k = 4/3, λΚα = 0.154 nm, D is the CS, βhkl (rad) is the reflection peak width and ε is the microstrain. A graph of
  versus
  should be a straight line and the results are presented in the table 1 including the found Rietveld refinement parameters; the weighted profile factor (Rwp) and the goodness-of-fit (S). The values of S were 1–2 indicating good fitting results.
Table 1. Crystallite size (CS), unit cell parameters (a) and (c), volume of unit cell, refining parameters and energy gap for pure and C-incorporated TiO2 nanocomposites. Data were obtained by considering anatase (A) + rutile (R) phases.
| Refinement factors | ||||||
|---|---|---|---|---|---|---|
| Sample | CS(nm) | a × c (Å) | Vcell (Å3) | Rwp(%) | S | Eg (eV) |
| TiO2 | A = 5.8 | A:3.774 × 9.481 | A = 135.0 | 26.24 | 1.23 | 3.1 |
| R = 11.5 | R:4.130 × 3.240 | R = 58.2 | ||||
| TiO2-C1 | A = 10.6 | A: 3.774 × 9.526 | A = 135.7 | 38.2 | 1.5 | 3.05 |
| R = 9.5 | R: 4.601 × 2.926 | R = 61.9 | ||||
| TiO2-C2 | A = 28.5 | A: 3.724 × 9.490 | A = 131.5 | 28.47 | 1.27 | 3.04 |
| R = 30.2 | R: 4.570 × 2.942 | R = 61.44 | ||||
| TiO2-C3 | A = 15.4 | A: 3.769 × 9.498 | A = 134.9 | 25.09 | 1.26 | 3.05 |
| R = 2.6 | R: 4.592 × 2.954 | R = 62.28 | ||||
| Hydrogenated samples | ||||||
| TiO2–H | A = 4.8 | A = 3.780 × 9.540 | A = 136.3 | 23.97 | 1.37 | 3.16 |
| R = 8.76 | R = 4.580 × 2.948 | R = 61.0 | ||||
| TiO2–C1–H | A = 7.0 | A = 3.771 × 9.468 | A = 134.6 | 22.36 | 1.4 | 3.10 |
| R = 2.13 | R = 4.117 × 3.139 | R = 53.23 | ||||
| TiO2–C2–H | A = 15.3 | A = 3.760 × 9.515 | A = 134.5 | 27.64 | 1.41 | 3.06 |
| R = 6.6 | R = 4.581 × 2.950 | R = 61.91 | ||||
| TiO2–C3–H | A = 8.2 | A = 3.767 × 9.500 | A = 134.8 | 25.67 | 1.37 | 3.07 |
| R = 12.8 | R = 4.595 × 2.960 | R = 62.48 | ||||
For pure TiO2, figure 1 shows very weak reflections of R and B phases, therefore, the XRD pattern revealed mainly the crystallization of A phase. However, the intensity of reflections of the R phase increased by increasing of C content in the sample, referring to increase the R phase in the samples. Moreover, figure 1 shows the almost constant relative intensity of (121) reflection of phase B, which refers to roughly constant relative % content of phase B in the samples. Meanwhile, the phase R content significantly increased with increasing of C inclusion. A similar result has been previously observed, that the incorporation of C into TiO2 lattice enhanced A to R transformation through the creation of O-vacancies [10]. Therefore, the data analyses presented in the table 1 were obtained by considering that the samples have consisted of a mixture of A and R phases. Moreover, no diffraction peaks of pure carbon or any related compounds were detected. Thus, the crystalline traces of secondary phases were not found. The quantitative ratios of R/A as calculated by PDXL program were ∼4%, 25%, 31%, and 49% for TiO2, TiO2–C1, TiO2–C2, TiO2–C3, respectively.
Figure 1(b) shows the XRD patterns of the hydrogenated TiO2–Cn–H samples. For all the samples, any structural modification by the hydrogenation was not detected. However, the % amount of R phase significantly increased by the hydrogenation so that the quantitative ratios of R/A were ∼11%, 163%, 117%, and 72% for TiO2–H, TiO2–C1–H, TiO2–C2–H, TiO2–C3–H, respectively. The hydrogenation can be considered by some of its actions, like low-oxygen partial pressure treatment, which could generate a high concentration of oxygen vacancies (VO) and enhance A to R transformation [10].
Data of table 1 show that the CS of A and R phases increased by C inclusion attaining the largest values with TiO2–C2 sample. The unit-cell volume (Vcell) slightly varied within the experimental accuracy due to the small size of the incorporated C ion-species. The hydrogenation did not introduce measurable systematic variations in Vcell and CS.
The type of C inclusion into the TiO2 lattice can be studied through geometrical principles. The ionic radius of C4+(0.016 nm) is smaller than that of Ti4+(0.0605 nm [15]) by ∼3.8 times, therefore, the substitution of C for Ti ions (TiC) is not favourable, since it would create a strong crystalline distortion, according to Hume-Rothery rules [16]. Thus, the inserted small Cv+ (where v ≤ 4) ion-species could mainly occupy crystalline interstitial positions. Such occupation must create O-vacancies due to the re-distribution of static point charges.
4. Optical characterization
DRS technique was used to characterize the prepared pure and C-incorporated TiO2 nanocomposite powders. The measured DR spectra (Ref (λ)) were studied through Kubelka-Munk (K-M) equation; where K is the K-M absorption coefficient; K = 2α, α is the linear absorption coefficient and F (λ) is the spectral K-M absorption function. The scattering coefficient (S) can be considered approximately constant, therefore, F (λ) ∼ α. The graphical dependence of the spectral K-M absorption function, F(λ) are demonstrated in figures 2(a), (b). The optical band gap (Eg) can be estimated through the absorption threshold wavelength (λg). Each optical band gap was estimated by Eg(eV) = 1242.3/ λg(nm) and the results are listed in table 1. For pure TiO2, the estimated optical band gap (3.1 eV) is in agreement with the known published values. Thus, the optical band gap was red-shifted by carbon incorporation, which refers to the insertion of carbon ions into the crystalline lattice of TiO2. Such optical band gap narrowing (BGN) of TiO2 was also observed in many investigations [17, 18]. This BGN was attributed to the creation of structural point defects like oxygen vacancies (VOs) of energy levels located close the bottom and overlapped with the conduction band of host TiO2 causing a slight BGN.

Figure 2. (a) Spectral K-M absorption function F(λ) of as-synthesized powder samples showing the threshold of absorption. (b) Spectral K-M absorption function F(λ) of hydrogenated powder samples showing the threshold of absorption.
Download figure:
Standard image High-resolution imageThe data presented onto the table 1 show that the hydrogenation of pure and C-incorporated TiO2 samples slightly widen the corresponding optical gap (BGW). Such BGW was also observed in [19]. Generally, the BGW in TCOs is attributed to the increase in the concentration of conduction electrons, according to Moss-Burstein effect [20]. Moreover, the blue-shift is also resulted by the improvement of the crystallinity since the hydrogenation reduces the density of structural defects by removing many types of structural defects, imperfections, and dangling atoms/ions, etc. Moreover, the hydrogenation would homogenize the incorporated C distribution throughout TiO2 lattice via tossing them. Therefore, the observed results refer to the resultant consequences of the hydrogenation process.
5. Magnetic properties
Pristine TiO2 has diamagnetic (DM) properties [21, 22], however, nanocrystalline TiO2 synthesized by different procedures might retain some weak magnetic properties due to the created structural defects [23]. The prepared pure TiO2 in the present work showed weak paramagnetic (PM) properties of susceptibility ∼10−7 cgs g−1. Such PM properties were attributed to the formatted structural and local electrostatic point defects [23]. By hydrogenation of the pure TiO2, weak FM properties superimposed on DM behaviors were observed, as shown in figure 3(a). The generation of FM properties by hydrogenation without participating of chemical impurities can be attributed to the creation of structural O-vacancies, which in turns change the oxidation state of structural Ti ions (i.e. formation of electrostatic defects). This conclusion agrees with that proposed in [23] about the formation of local [Ti3+–O6−x] complex defects i.e. the formation of one unpaired 3d-electron creates local magnetic moments.

Figure 3. (a) M–H relationship for pure and hydrogenated TiO2 sample. The Hydrogenation created partial FM behavior. (b) M–H relationship of TiO2, TiO2–C1, TiO2–C2 and TiO2–C3 samples, showing that the C incorporation defeated the PM properties. (c) M-H relationship of TiO2–C1 and TiO2–C1–H samples showing that the hydrogenation created partial FM properties. The inset shows the hysteresis loop of TiO2–C1–H sample.
Download figure:
Standard image High-resolution image
The occupation of C ion-species the interstitial positions of TiO2–C1 lattice slightly increased the O-vacancies concentration, which slightly enhanced the PM susceptibility of the host TiO2 (table 2). For further addition of C ions, as in case of TiO2–C2 and TiO2–C3 samples, the PM susceptibility was totally defeated resulting of net DM susceptibility (table 2), which was increased in magnitude by increasing of C inclusion (figure 3(b)). The effective magnetic moment per C ion dopant can be estimated from the net (corrected) experimental PM susceptibility (χg) of C1 ions, i.e. (6.7–3.4) × 10−7 cgs g−1 = 3.3 × 10⁻⁷ cgs g−1 by using Curie equation,  where ρ is the density of TiO2 (3.78 g cm−3), nion=1.14 × 1021 cm−3, μC is the magnetic moment per C ion, kB is the Boltzmann constant, and T is the working temperature. Hence, μC = 1.24 μB/C, which is close to the previously found magnetic moment, (1.5–3.0) μB/C [5]. If the localized magnetic moment of 2p of carbon (μ2p ∼ 0.85 μB/C) was considered, then the measured average magnetic moment (1.24 μB/C) must involve μ2p in addition to some contribution of O-vacancies [24].
Table 2. Magnetic parameters; coercivity (Hc), remanence (Mr), saturation magnetization (Ms), PM susceptibility and magnetic energy of the as-synthesised and hydrogenated samples.
| Sample | Behaviour | Hc (Oe) | Mr (memu/g) | Ms (memu/g) | χ (cgs/g) | Um (erg/g) |
|---|---|---|---|---|---|---|
| TiO2 | PM | — | — | — | 3.4 × 10⁻⁷ | |
| TiO2–C1 | PM | — | — | — | 6.7 × 10⁻⁷ | |
| TiO2–C2 | DM | — | — | — | — | |
| TiO2–C3 | DM | — | — | — | — | |
| Hydrogenated samples | ||||||
| TiO2–H | DM + FM | 216.4 | 0.559 | 0.426 | — | 0.12 |
| TiO2–C1–H | FM | 118.85 | 1.07 | 10.04 | — | 0.13 |
| TiO2–C2–H | DM | — | — | — | — | |
| TiO2–C3–H | DM | — | — | — | — | |
The hydrogenation of TiO2–Cn–H (where n = 1, 2 and 3) samples slightly increased the concentration of O-vacancies. Moreover, H2 molecules could toss some of the C ion-species and drop them into some of the O-vacancies. Similar conclusions have been mentioned in the literature [25]; the annealing under O-poor conditions enhanced the substitution of oxygen by carbon ions (CO) in addition to the creation of O-vacancies.
Type and strength of spin-spin (Sp. Sp) super-exchange interactions between C dopant ion-species via vacancies in TiO2–Cn–H samples should depend on the average C–C separation (RC–C). In the present work, RT-FM was found only with TiO2–C1–H sample (table 2 and figure 3(c)). The relationship between RC–C and the possibility of the creation of FM interaction can be concluded according to the following discussions. In general, the strength of the spin-spin (Sp.Sp) exchange interaction between C dopant ions depends on RC–C and on the properties of the electronic interaction medium, which conduct that exchange interaction. For a uniform distribution of solute C ions of concentration nC, the RC–C can be estimated by nCV = 1, where V = (4/3)πR3C–C. As the concentration nC was equal to 1.14 × 1021 cm−3, 2.28 × 1021 cm−3, 9.69 × 1021 cm−3 thus the corresponding RC–C was equal to 5.9 Å, 4.7 Å and 2.9 Å, for TiO2–C1–H, TiO2–C2–H, and TiO2–C3–H, respectively. The present results showed that only for RC–C = 5.9 Å (TiO2–C1–H), the interaction was FM while for lower values (4.7 Å and 2.9 Å) that interaction was converted to DM at RT. Similar observation on magnetic coupling in connection with RC–C parameter was theoretically concluded in [26], where the Authors proved that when the RC–C < 1.34 Å, the system is in nonmagnetic state and the dopants tend to form a cluster through a direct C–C bonding interaction, however when the RC–C is in-between 3.8 Å and 5.5 Å, then there exists a strong ferromagnetic (FM) or antiferromagnetic (AFM) coupling between C ions. The dependence of magnetic character on RC–C value was also studied earlier in [8], where the Authors concluded theoretically that when RC–C ∼ 3–4 Å the coupling between the dopant C ions was leading to either FM or AFM. The dependence of the type of magnetic interaction on the RC–C was also studied for other host crystalline medium like in ZnO [5], where the Authors theoretically deduced the realization of FM interaction when RC–C ∼ 7.76 Å.
In table 2 the magnetic parameters of the samples including the FM of pure TiO2–H and TiO2–C1–H sample were presented. The saturation magnetization (Ms) increased by ∼20 times due to C1 doping, while the magnetic energy (Um = Mr.Hc) remained without a considerable change. The Ms data onto table 2 can be used to estimate the effective concentration  of C ion-species participated in FM interaction by using the following equation,
  where
where  is the magnetic moment of C ion-species,
  found from PM behavior. Thus, only ∼0.3% of the total doped C into
TiO2–C1–H sample participated in the FM interaction. This revealed small participation fraction of dopant C ions that occupied O-vacancies and interacted ferromagnetically with each other. It is useful to compare the magnetization (Ms) of the present samples with that of TiO2 powder doped with other types of ions. The present work result (∼10 memu g−1) is comparable to the previously reported value for host TiO2 doped with magnetic ions; for TiO2−3%Co (7.42 memu g−1), TiO2−3%Mn (9.46 memu g−1) [22], TiO2−5%Ni (21.79 memu g−1) [27], and TiO2:5%Fe (20 memu g−1) [28]. Thus, it is obviously clear the significance of hydrogenation in supporting the embedded magnetic properties.
6. Conclusions
Titanium tetrachloride (TiCl4) and sucrose (C12H22O11) complex were used to synthesize pure and C-incorporated TiO2 nanocomposite powders by thermal co-decomposition method. Structural tests of pure TiO2 nanocomposite confirm the formation of major A phase, however, the incorporation of C ions and hydrogenation supported the A to R transformation. The optical study revealed that the C inclusion redshifted the optical band gap due to the creation of point defects like O-vacancies while the hydrogenation blueshifted the optical band gap according to the Moss-Burstein effect. The inserted C ion-species occupied interstitial positions of TiO2 lattice. During the hydrogenation, H2 molecules tossed the inserted C ions and dropped them into O-vacancies. Then, the super-exchange interaction between C2p–C2p electrons via oxygen vacancies could create FM depending on the average C–C separation (RC–C). This model explained the creation of FM just for ∼1% C- incorporated host TiO2 lattice. The local effective magnetic moment was found to be 1.24 μB/C, which was attributed to the magnetic moment of C2p in addition to some contribution of O-vacancies.