

Abstract
Hf1−xFexO2 (x = 0.0, 0.03, and 0.05) materials were synthesized using co-precipitation method. The phase purity and crystal structure of various Fe doped Hf1−xFexO2 nanoparticles were studied using x-ray diffraction and correlated with micro-Raman spectroscopy. The crystallite size of Hf1−xFexO2 particles were found to be in 8–11 nm range. The observed Raman peaks in the doped materials were slightly shifted towards lower frequencies and revealed that the Fe3+ ions indeed occupied the Hf sites of the HfO2 lattice. The Raman spectra also suggest that oxygen vacancies in Hf1−xFexO2 nanoparticles increases with Fe3+ concentration. The Hf1−xFexO2 nanoparticles were found to be ferromagnetic with a Curie temperature well above room temperature. The saturation magnetization (Ms) was significantly enhanced at room temperature (300 K) as Fe3+ ion concentration increased in HfO2. Furthermore, zero-field-cooled (ZFC) and field-cooled (FC) magnetization measurements of these samples confirm the ferromagnetic nature of Fe doped HfO2 nanomaterials.
Export citation and abstract BibTeX RIS
1. Introduction
Hafnium oxide (HfO2) materials have been found to be useful because of its ferromagnetic [1], ferroelectric [2], charge-storage [3], electronic [4, 5], and optical [6] properties. After the discovery of ferromagnetism in thin films of HfO2 by Venkatesan and coworkers [7], many reports have been published on the magnetic behavior of doped/un-doped HfO2 [1, 8–11]. Hong observed room temperature ferromagnetism in un-doped HfO2 films grown on Yttrium stabilized zirconia substrates and reported that magnetism in HfO2 thin films originates from defects and/or oxygen vacancies [8].
It was reported that the cobalt (Co) doped hafnia exhibits paramagnetic properties at low temperatures with very weak antiferromagnetic interactions between Co ion moments [9]. Sharma and coworkers have reported room temperature ferromagnetism in Ni doped HfO2 nanoparticles. They found the magnetization (M) of Hf0.98Ni0.02O2 and Hf0.95Ni0.05O2 to be 2 emu g−1 and 6 emu g−1, respectively [10]. Density functional theory calculations suggest that complex defects of oxygen vacancies (CDOV) may be responsible for the ferromagnetism in pure HfO2 films at room temperature [11]. Ferromagnetic properties of Yttrium (Y) doped HfO2 were reported due to the phase change of HfO2 from monoclinic to tetragonal/cubic upon doping of yttrium in HfO2 [1]. Sales and coworkers [12] reported magnetic properties in stable tetragonal phase of 20% doped Fe in HfO2. The origin of ferromagnetism in these doped HfO2 materials and underlying physics remain unclear.
In order to investigate the effect of Fe doping on the magnetic properties of HfO2, we have synthesized Hf1−xFexO2 nanomaterials via low cost co-precipitation method without any toxic materials, as reported earlier by Ramadoss and coworkers [13]. For ferromagnetism to be observed in Hf1−xFexO2, the Fe ions should be incorporated into the host lattice of HfO2. A major issue in synthesizing Hf1−xFexO2 nanomaterials is the presence of extra phase of Fe3+ ions [12] and change in the local lattice dynamics. Raman spectroscopy is a technique that can be used to find the change in local lattice distortions which arises from Fe3+ doping in HfO2. In this paper, we discuss the structural, and magnetic properties of Hf1−xFexO2 nanoparticles, synthesized by co-precipitation method.
2. Experimental
2.1. Synthesis of materials
The precursor materials, hafnium (IV) chloride (HfCl4, 99.9%), iron (II) chloride tetrahydrate (FeCl2.4H2O, 98%), sodium hydroxide pellets (NaOH, 98%), were procured from Alfa Aesar (USA) and used as received without any further purification. For the synthesis of Hf1−xFexO2 (0 ≤ x ≤ 0.05) nanoparticles, appropriate amounts of hafnium tetrachloride and iron (II) chloride tetrahydrate were dissolved separately in distilled water in 0.1M and 0.2 M ratio. The two solutions were mixed together, and 0.1 M solution of sodium hydroxide were added slowly to this solution, followed by continuous stirring for 30 min. This resulted in the precipitate of Hf1−xFex(OH)4, which were recovered using a centrifuge. The resulting precipitate were washed several times with water and dried overnight. The obtained dried powder of Hf1−xFex(OH)4 were ground and calcined at 600 °C for 3 h. to obtain Hf1−xFexO2 nanoparticles.
2.2. Characterizations
X-ray diffraction studies of the synthesized materials were performed using Rigaku Mini flex-II diffractometer (CuKα radiation with wavelength of 1.5406 angstrom.), at a scan rate of 1°/min. The data was collected at every 0.02°, at room temperature. Raman measurements of the sample were carried out using a Horiba-Yobin T64000 micro-Raman system, and a 514.5 nm line of an argon ion laser was used as excitation source. The morphological characterizations were carried out using a field emission scanning electron microscope (FESEM, JEOL JSM-7500F SEM) at an applied field of 15 KV and elemental analysis were carried out using energy dispersive x-ray spectrophotometer (EDX). The magnetic properties of Hf1−xFexO2 materials were studied using Quantum Design PPMS DynaCool system.
3. Results and discussions
3.1. Structural analysis
Figure 1 shows the x-ray diffraction pattern of Hf1−xFexO2 (x = 0.0, 0.03, 0.05) nanoparticles. The diffraction pattern of pure HfO2 corresponds to a monoclinic structure. Peak broadening upon increasing concentration of Fe3+ indicates that crystallinity of Fe3+ doped nanoparticles powders reduces compared to pure HfO2 nanoparticles. The major characteristic diffraction peaks were observed at 2θ values of 24.5°, 28.4°, 31.76°, 34.68°, 35.61°, 49.68°, 50.48° and 55.96°, which corresponds to (011), (−111), (111), (200), (002), (220), (022), and (310) lattice plane, respectively. These results are in good agreement with earlier literature reports [14, 15]. In addition, the x-ray diffraction pattern of Hf0.93Fe0.03O2 and Hf0.95Fe0.05O2 show an additional peak at 30.48°, which corresponds to (111) plane of tetragonal phase of HfO2. This is in good agreement with standard PDF card (JCPDF-53-0550) of HfO2 and reveals the presence of tetragonal and monoclinic phases in Fe doped HfO2. The coexistence of the monoclinic and tetragonal phase was also reported earlier for Y doped [1], and 20% Fe doped [12] HfO2. The XRD data of Y doped HfO2 nanoparticles also show a peak around 30.48o corresponding to tetragonal phase. These results reveal that the structure of HfO2 is sensitive with dopant species and their concentrations. More recently, Wan and Zhou [16] obtained the stable tetragonal phase of HfO2 nanoparticle, synthesized by hydrothermal root. The peak positions from x-ray pattern of Hf1−xFexO2 were obtained using Fityk 0.9.8 curve fitting program [17]. The average crystallite sizes were found using Scherrer equation
where, k is a constant (0.94), λ is the wavelength of Cu-Kα radiations (1.541 Å), β is the full width at half maximum for diffraction peak and θ is the Bragg's diffraction angle. The average crystallite size for HfO2, Hf0.93Fe0.03O2, and Hf0.95Fe0.05O2 nanoparticles were found to be 11 nm, 10 nm, and 8 nm, respectively. The crystallite sizes of the synthesized Fe3+ doped hafnium oxide materials are comparable to those reported earlier in literature [18]. The various peak positions, crystallite size, and lattice strain are presented in table 1. It can be seen that the crystallite size of Hf1−xFexO2 decrease upon increasing of Fe3+ concentration, and peaks shift towards higher θ values. This may be due to the fact that atomic radius of Fe (156 pm) is much smaller than the atomic radius of Hf (208 pm). Further the lattice strain of Hf1−xFexO2 nanomaterials were found to increase upon increasing Fe3+ concentration. For HfO2, Hf0.93Fe0.03O2, and Hf0.95Fe0.05O2 the lattice strains were found to be as 0.013, 0.014, and 0.016, respectively. This increment in lattice strain may be due to the reduction of crystallite size [19].
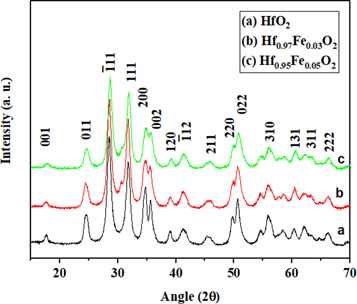
Figure 1. Room temperature x-ray diffraction patterns of Hf1−xFexO2 (x = 0.0, 0.03, and 0.05) nanoparticles, calcined at 600 °C.
Download figure:
Standard image High-resolution imageTable 1. Structural parameter of Hf1−xFexO2 (x = 0.0, 0.03, 0.05) nanoparticles: crystalline size, lattice strain analysis and peak position from XRD data.
| Peak position (2θo) | |||||||
|---|---|---|---|---|---|---|---|
| Name of material | Crystallite size (nm) | Lattice strain | (011) | (−111) | (120) | ((022) | (310) |
| HfO2 | 11 | 0.013 | 24.35 | 28.51 | 38.84 | 50.39 | 55.92 |
| Hf0.97Fe0.03O2 | 10 | 0.014 | 24.46 | 28.53 | 38.92 | 50.41 | 55.96 |
| Hf0.95Fe0.05O2 | 8 | 0.016 | 24.58 | 28.67 | 38.98 | 50.56 | 56.07 |
3.2. Raman scattering
The nanoparticles of HfO2 were characterized by monoclinic symmetry with the point group (m) and space group (P21/C) [20]. A group theoretical analysis, considering the site symmetry for the zone center (Γ-point) phonons of monoclinic HfO2, indicate that the only 18 (9Ag + 9B1g) modes are Raman active [21]. The room temperature Raman scattering data of Hf1−xFexO2 (x = 0.0, 0.03, 0.05) nanomaterials were obtained by employing normal backscattering geometries and the results are presented in figures 2(a) and (b). Figure 2(a) represents the Raman spectra of monoclinic HfO2 nanoparticles at room temperature. We observed a total of 17 Raman modes at 110, 133, 147, 164, 241, 256, 324, 335, 382, 397, 498, 522, 552, 579, 639, 672 and 776 cm−1, which are comparable to earlier reported Raman spectra of HfO2 with the same monoclinic symmetry [19, 20]. The Raman mode at 110, 133, 147, 256, 335, 382, 498 (with high intensity Raman mode), 579 and 672 were assigned as A1g Raman modes whereas Raman modes at 133, 164, 241, 324, 397, 522, 552, 639, 776 cm−1 were assigned to B1g mode. The Fe doped HfO2 samples (Fe = 0.03 and 0.05) show a Raman mode at 215 cm−1 (figure 2(b)), which may be correspond to tetragonal phase of HfO2. This clearly indicates the presence of two phases (monoclinic and tetragonal) in Hf1−xFexO2 (x = 0.03 and 0.05) nanomaterials as were observed in the x ray pattern. A similar Raman mode close to 215 cm−1 in HfO2 was reported earlier to correspond to tetragonal phase of HfO2 [1, 20]. We did not observe any evidence of the presence of extra phase of Fe (Fe2O3 or Fe3O4) in the Raman spectra of Hf0.93Fe0.03O2 and Hf0.95Fe0.05O2.

Figure 2. (a). Raman Spectra of HfO2 nanoparticle at room temperature classified into monoclinic vibrational modes. (b). Micro-Raman spectra of Hf1−xFexO2 nanoparticles, calcined at 600 °C. (a) HfO2 (b) Hf0.97Fe0.03O2 (c) Hf0.95Fe0.05O2. [Inset presents the Raman shift in lower phonon modes with Fe concentration].
Download figure:
Standard image High-resolution imageFrom figure 2(b), we also observed that the FWHM and intensity of all the Raman modes show anomalous changes with increase in Fe3+ ions concentration. The phonon frequencies and line widths of high intensity Raman modes of Hf1−xFexO2 samples were obtained using Peak FIT (version V4) program and are presented in table 2. The steady decrease in Raman peak intensity and an increase in FWHM with increase in Fe 3+ concentration indicate the reduction in crystalline size. The broadening of Raman peaks due to the reduction in particle size have been reported earlier for Mn2O3, SnO2 TiO2 nanoparticles [23–25].
Table 2. Raman frequency and corresponding full width at half maximum (FWHM) of high intensity Raman mode for HfO2, Hf0.97Fe0.03O2 and Hf0.95Fe0.05O2. nanoparticles.
| HfO2 | Hf0.97Fe0.03O2 | Hf0.95Fe0.05O2 | |||
|---|---|---|---|---|---|
| Raman frequencies (cm−1) | FWHM (cm−1) | Raman frequencies (cm−1) | FWHM (cm−1) | Raman frequencies (cm−1) | FWHM (cm−1) |
| 110 | 11.89 | 105 | 14.41 | 102 | 15.15 |
| 133 | 7.56 | 131 | 8.94 | 131 | 14.66 |
| 147 | 7.17 | 146 | 8.32 | 145 | 9.80 |
| 241 | 7.39 | 238 | 12.12 | 236 | 13.01 |
| 256 | 11.23 | 251 | 15.12 | 247 | 17.11 |
| 498 | 15.52 | 495 | 24.99 | 492 | 32.17 |
The lower wavenumber Raman modes between 109 to 300 cm−1 are dominated by vibration in Hf–Hf stretching bonds, whereas Raman modes between 300 to 600 cm−1 are dominated by the vibrations in O–Hf–O bending and Hf–O stretching bond [22]. We observed that all the intense Raman modes associated with the monoclinic symmetry of HfO2 are present in Fe3+ ion doped HfO2 nanoparticles, indicating that all Fe doped samples retained good lattice order. As the concentration of Fe ions increased, the lower Raman modes (Low phonon mode below 300 cm−1) due to stretching vibration in Hf–Hf, shifted towards the lower frequencies (shown in inset of figure 2(b)). This may be due to the large atomic mass difference between Hf and Fe, whereas higher Raman modes due to vibration in O2− ions does not show remarkable Raman shift. These results clearly show that the incorporation of Fe ions occurs at Hf sites of HfO2 lattice.
3.3. Scanning electron microscopic studies
X-ray diffraction and micro-Raman studies confirm that there is no other impurity or phase formation in the synthesized Hf1−xFexO2 (x = 0.0, 0.03, and 0.05) nanoparticles. In order to study the surface morphology of Hf1−xFexO2 nanoparticles and the existence of the doping element (Fe) in Hf1−xFexO2, scanning electron microscopic and EDX studies were performed and the results are presented in figure 3. It can be seen from SEM pictures that the materials are in nanosize range. The EDX spectra of pure HfO2 show the presence of Hf and O atoms, while EDX spectrum of Fe doped samples shows the presence of Hf, Fe and O atoms. Absence of any element other than Hf, Fe, and O confirm the purity of synthesized Hf1−xFexO2 nanoparticles.
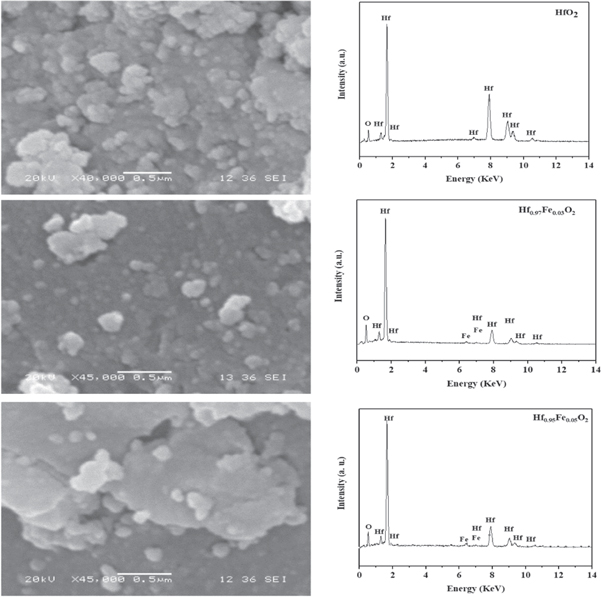
Figure 3. Scanning electron micrographs and corresponding EDX specta of Hf1−xFexO2 (x = 0.0, 0.03, and 0.05) nanoparticles, calcined at 600 °C.
Download figure:
Standard image High-resolution image3.4. Magnetic properties
Figure 4 shows the room temperature magnetization versus magnetic field (M–H) hysteresis for pure HfO2 and Fe-doped samples at magnetic field up to ±4000 Oe. All the samples show a superimposed saturating ferromagnetic like behavior and after subtracting the diamagnetic part (the linear component χp), the corrected magnetization curves clearly display the ferromagnetic behavior as shown in figure 4. The magnetization curves are almost hysteretic, as is often the case for ferromagnetic oxides. The saturation magnetization value for the pure HfO2 samples is about 0.1142 emu g−1, which might be due to the presence of defects as also found in the earlier reports [2, 5]. C.D. Pemmaraju and S. Sanvito [26] explained the origin of ferromagnetism in HfO2 thin film nanostructure using first principle calculation and observed that the isolated cation vacancies site in HfO2 thin films lead to formation of high spin defect states, resulting in a ferromagnetic state in HfO2. A Sundram et al [27] suggest that the origin of ferromagnetism in nanoparticles of nonmagnetic oxides such as SnO2, In2O3, CeO2, Al2O3, ZnO may be due to exchange interaction between localized electron spin moments resulting from oxygen vacancies at the surface of nanoparticles.
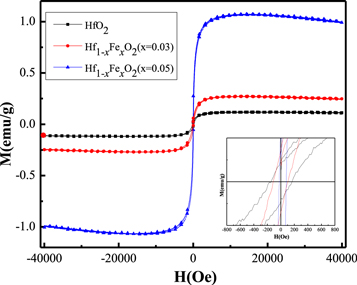
Figure 4. Magnetization versus Field graphs for pristine HfO2, and Fe doped HfO2 nanoparticle samples at room temperature.
Download figure:
Standard image High-resolution imageThe Fe doped HfO2 samples showed noticeable increase in ferromagnetic properties as compared to pristine HfO2 sample. The value of saturation magnetization increased with Fe concentration and reached 0.238 and 1.002 emu g−1 for Hf1−xFexO2 (x = 0.03) and Hf1−xFexO2 (x = 0.05), respectively. The inset of figure 4 shows the coercivity of undoped HfO2 and Fe-doped nanoparticles. The value of coercivity of undoped HfO2 nanoparticle was observed as 180 Oe at 300 K. The coercivity (Hc) of Hf1−xFexO2 decreased to 100 Oe and 52 Oe for (x = 0.03) and (x = 0.05), respectively. The decrease in coercivity may be due to the reduction in crystallite size with increase in Fe3+ concentration as calculated from the XRD values. A comparative list of the values of saturation magnetization (Ms) and coercive field (Hc) of Hf1−xFexO2 (x = 0.0, 0.03, 0.05) nanoparticles and similar materials Ti1−xFexO2 (x = 0.01, 0.02, 0.03) are given in table 3. We found that for both the materials, saturation magnetization (Ms) increases while the coercive field (Hc) decreases upon increasing Fe concentration. These comparative magnetization parameters suggest that room temperature ferromagnetism in Fe doped HfO2 is driven by the oxygen vacancy, similar to Fe doped TiO2 and the oxygen vacancies increases upon increasing Fe concentrations [28].
Table 3. Magnetization parameter of the Hf1−xFexO2 (x = 0.0, 0.03, 0.05) nanoparticles compared with magnetization parameter of similar materials Ti1−xFexO2 (x = 0.01, 0.02, 0.03) [28]: saturation magnetization (Ms), and Coercive field (Hc) were determine from M-H loop.
| Name of material | Ms (emu gm−1) | Hc (Oe) |
|---|---|---|
| HfO2 | 0.114 | 180 |
| Hf0.97Fe0.03O2 | 0.238 | 100 |
| Hf0.95Fe0.05O2 | 1.002 | 52 |
| Ti0.99Fe0.01O2 | 0.004 | 134 |
| Ti0.98Fe0.02O2 | 0.007 | 71 |
| Ti0.97Fe0.03O2 | 0.012 | 53 |
The existence of significant improvement in the saturation magnetization is possibly due to the ferromagnetic nature of Fe nanoparticles and mainly due to the increased magnetic volume fraction in the doped samples. Coey et al [29] proposed a bound magnetic polaron model, in which polarons interact with the magnetic ions present at interstitial sites. The resulting indirect ferromagnetic interaction that arises align the magnetic polarons. Therefore, the ferromagnetism in metal doped nonmagnetic oxides may be due to formation of magnetic polarons. According to this model, low concentrations of metal dopant dominate the local properties of HfO2 like materials and play an important role in mediating long range magnetic order. We observed anomalous change in frequency (shift up to 10 cm−1) and in FWHM in the lowest phonon mode at 110 cm−1 and in the oxygen ion dominated high frequency phonon modes at 776 cm−1 (marked as * in figure 2(b)) as the Fe concentration in the HfO2 lattice increased. Gao and coworkers [30] predicted that these two modes are highly localized, and they could be introduced by oxygen vacancies in HfO2. These observations reveal that oxygen vacancies increase with Fe concentration and this may be a reason for the enhancement of ferromagnetic behavior with increasing Fe concentration in HfO2.
Figures 5(a) and (b) shows the zero-field-cooled (ZFC) and field-cooled (FC) magnetization measurements as a function of temperature obtained at applied magnetic field of 100 Oe for pure HfO2 and Fe-doped HfO2 samples, respectively. The Curie temperature (Tc) of pure HfO2 is estimated to be above 400 K (figure 5(a)), which is consistent with the earlier reports [8, 26].

Figure 5. Zero-field-cooled (ZFC) and field-cooled (FC) magnetization versus temperature plots for (a) pristine HfO2, and (b) Hf1−xFexO2 (x = 0.03, and 0.05) nanoparticles.
Download figure:
Standard image High-resolution image
Figure 5(b) shows that the value of magnetization increases with Fe doping concentration as compared to pure HfO2, which is also consistent with the magnetization versus field analysis. The ZFC and FC magnetization behavior of the Fe-doped HfO2 samples shows that when temperature increases from about 100 to 400 K, the magnetization decreases very slowly but remains nonzero in the experimental range, which also confirms the ferromagnetic nature of the samples. Further, the ZFC and FC curves of the Fe-doped HfO2 samples did not show any peak near 45 K and 84 K or abrupt transition near 120 K, which indicates the absence of other phases (such as α- Fe2O3 or Fe3O4) in Fe doped HfO2 compounds, as recently reported by Sales and coworkers [12]. This also confirms that the Fe is doped at the Hf sites instead of generating the other phases in the structure, which is supported by the results obtained from Raman spectra (figure 2(b)). Therefore, Fe doping is found to be beneficial for the improvement of magnetization of HfO2 system.
4. Conclusions
Phase pure HfO2, Hf0.93Fe0.03O2, and Hf0.95Fe0.05O2 nanoparticles were synthesized successfully. The crystallite sizes of the synthesized materials were found to be in the range of 8–11 nm. SEM studies also confirm the nano-crystallinity of HfO2, Hf0.93Fe0.03O2, and Hf0.95Fe0.05O2 materials. Raman spectra of Fe doped HfO2 also indicate the incorporation of Fe at Hf sites in HfO2 lattice without any extra phase of Fe ions. The x—ray diffraction and micro-Raman spectra analysis reveal the existence of two separate structure (tetragonal and monoclinic) in Hf0.93Fe0.03O2, and Hf0.95Fe0.05O2 samples. The anomalous change in Raman mode at 110 cm−1 and 773 cm−1 reveal that oxygen vacancies increase with increase in Fe concentration, and this may be a reason for the enhancement of ferromagnetic behavior with increasing Fe3+ ion concentration in HfO2. Undoped and Fe doped HfO2 nanoparticles show ferromagnetism at room temperature. Furthermore, substantial enhancements of saturation magnetization were observed with increasing the Fe concentration in Hf1−xFexO2 nanoparticles.
Acknowledgments
The financial support received from CCSU-AAUP faculty research grant is gratefully acknowledged.