

Abstract
Biodegradable PLA is commonly derived from renewable resources and benign to the environment. It is a brittle thermoplastic with high strength and modulus; thus a suitable candidate for replacing conventional petroleum-based plastic. However, due to its limitation, PLA needs to be blended with other polymers and fillers for properties modifications. The aim of this work was to prepare PLA/PA6/GNP nanocomposites and characterize on the mechanical, thermal, chemical and dispersion of nanofiller in binary blend systems. PLA/PA6/GNP nanocomposites were blended by using a Haake twin screw extruder via melt intercalation method. The ratio of the polymer matrix was fixed at 20:80 and the processing temperature was in the range of 205 °C to 260 °C. Graphene nanoplatelet fillers were then loaded in the PLA/PA6 blends with 0.5, 1.0, 3.0 and 5.0 wt%. It was found that PLA/PA6/GNP (5.0) nanocomposites were the overall highest in terms of thermal and mechanical properties. PLA/PA6/GNP nanocomposites improved the mechanical properties in terms of elongation at break and maximum stress as well as improved the degradation temperature. The property improvement in the nanocomposites was due to the dispersion of GNP in the polymer matrix. It was also found that there was no chemical interaction between a functional group of nanocomposites. It can be concluded that nanocomposites were incompatible and immiscible with PA6.
Export citation and abstract BibTeX RIS
1. Introduction
In the era of current development, application of packaging are based on non-biodegradable plastic from petroleum; it triggers the environmental awareness and attracts biodegradable polymers to replace the conventional plastics.
Among the various biodegradable synthetic polymers family, poly (lactic acid) (PLA) is one of the most appealing polymers. It has a great potential to replace conventional petroleum-based plastic [1]. According to Fukushima et al, PLA can be naturally degraded in soil and compost in 80 days [2]. In addition, PLA offers other advantages such as good mechanical properties, renewability, and relatively low cost as compared traditional polymers [3, 4].
However, PLA that derived from renewable resources is a brittle thermoplastic with high strength and modulus [5], slow degradation rate, and hydrophobicity [3]. For some applications, PLA needs some modifications such as the enhancement of thermal properties, mechanical and barrier properties become possible by filling them with layered silicate [6, 7].
It is known that conventional plastic made from petroleum will lead to plastic pollution due to non-biodegradable. Besides that, dumping and burning is the incorrect way which can cause pollution. This serious problem in the ocean, as well as landfills, make people aware to save the environment in the future. However, the usage of plastic in our life helps to make things easier. The only solution is to produce a biodegradable plastic in order to replace the conventional plastic. After many studies that had been carried out, it is proven that PLA can replace petroleum plastic.
Polyamides 6 also known as Nylon 6 is a suitable candidate to toughen PLA properties due to high impact resistance, tough, strong, durable fibres [8]. PA6 is highly valued thermoplastic that is widely used as synthetic fibres, construction materials, food packing material, and as engineering resins. Typically, nanofiller such as graphene is currently very popular for mechanical properties enhancement such as stiffness and strength [9]. The binary blending of PLA/PA6 leads to incompatible or immiscible as both of the materials are brittle that usually resulting in poor mechanical properties. The use of GNP would enable the mechanical and thermal properties of PLA/PA6 to be improved [10, 11]. O' Neill et al investigated the in situ preparation and characterization of PA6/GO and PA6/rGO composition. They reported the inclusion of graphene promoted nucleation of crystallites [12]. On the other hand, Kausar et al reported a novel PLA based polyurethane was synthesized and used as a blend component with Nylon 6, 12. It was found that graphene increased the tensile and flexural strengths of the composites [13]. Recently, Codou et al reported the morphology between nylon 6 (PA6)/PP/PLA ternary blends with PP-g-MA. The addition of PP-g-MA has contributed to a significant reduction of particle size of PP but not for PLA [14]. Although there were many studies done on PLA with PA, there is a little work carried out on the melt blend of PLA/PA6 with graphene nanoplatelet. The aim of this work is to prepare and characterize a novel PLA/PA6 binary blend filled with graphene nanoplatelets.
2. Experimental
2.1. Methodology
Materials used for this experiment are PLA, PA6, and GNP. PLA was obtained from NatureWorks that had melting temperature of 155 °C to 170 °C and glass transition temperature of 55 °C to 60 °C. As for PA6, it has a melting point of 220 °C and glass transition temperature of 55 °C to 75 °C with density 1.084 g ml−1. Besides, graphene nanoplatelet, GNP had a melting temperature more than 3000 °C. The melt blending was carried out in a Haake twin-screw extruder at 50 rpm.
Prior to melt intercalation, PLA resin was dried at 40 °C for 24 h. The blend compositions for PLA, PA6 and GNP are given in table 1.
Table 1. The composition of PLA, PA6 and GNP.
| Sample | PLA (wt%) | PA6 (wt%) | GNP (%) |
|---|---|---|---|
| PLA/PA6 | 20.0 | 80.0 | 0 |
| PLA/PA6/GNP(0.5) | 19.9 | 79.6 | 0.5 |
| PLA/PA6/GNP(1.0) | 19.8 | 79.2 | 1.0 |
| PLA/PA6/GNP(3.0) | 19.4 | 77.6 | 3.0 |
| PLA/PA6/GNP(5.0) | 19.0 | 76.0 | 5.0 |
PLA/PA6/GNP nanocomposites were prepared and blended via melt intercalation method by using a twin screw extruder with the temperature range of 205 °C to 260 °C. The ratio of the polymer matrix, PLA: PA6 was fixed at 20:80 and GNP loadings were varied at 0.5, 1.0, 3.0, and 5.0 wt%. The stress-strain analysis was carried out by using universal Tensile Machine and tested according to the ASTM D638 under ambient conditions with crosshead speeds of 50 mm min−1. For morphological evaluation, a scanning electron microscopy (SEM) FEI Quanta 450 and Transmission Electron Microscopy (TEM) FEI Technai G2 20 Twin were used. Then, thermal analysis was measured by Differential Scanning Calorimeter (DSC) Perkin Elmer heated from 50.00 °C to 300.00 °C at 10.00 °C min−1. Degradation behaviour was carried out from 30 °C to 600 °C by using a Thermogravimetric Analysis (TGA) STA 7200. Finally, a Perkin Elmer Fourier Transform Infrared Spectroscopy (FTIR) was used to monitor the chemical interaction between functional groups after blending.
3. Results and discussion
3.1. Mechanical Properties
The effect of incorporation of nanofiller on the mechanical properties of PLA nanocomposites was analysed by tensile testing, which will establish the structure-property relationship. The tensile properties were tabulated in table 2 and figure 1.
Table 2. Mechanical properties for PLA/PA6/GNP.
| Sample | Stress (MPa) | Strain (%) |
|---|---|---|
| PLA | 62.0 | 3.5 |
| PLA/PA6 | 17.7 | 4.5 |
| PLA/PA6/GNP(0.5) | 25.8 | 6.4 |
| PLA/PA6/GNP(1.0) | 22.6 | 7.0 |
| PLA/PA6/GNP(3.0) | 28.4 | 7.1 |
| PLA/PA6/GNP(5.0) | 30.6 | 8.2 |

Figure 1. Stress versus strain curves.
Download figure:
Standard image High-resolution imageThe improvement of the mechanical properties of the polymer nanocomposite can be attributed to the aspect ratio and modulus of the graphene. From the table 2, it can be observed that PLA/PA6/GNP (5.0) shows improvement compared to a small amount of graphene (PLA/PA6/GNP(3.0), PLA/PA6/GNP(1.0) and PLA/PA6/GNP(0.5)) is added to the polymer. When a relatively softer matrix is reinforced with filler with high moduli, the polymer becomes highly restrained mechanically which enables a significant portion of an applied load to be carried by the filler, assuming that the bonding between two phases is adequate [15].
3.2. Morphology
Scanning Electron Microscopy, SEM analysis was used to analyse the dispersion and dispersed condition from the surface of nanocomposites. This is illustrated in figure 2, of SEM micrographs resulted from the surfaces of composites using 1000x magnifications for all compositions. It was found that the surface condition for PLA/PA6 is smooth. It can also be observed that when a high amount of nanofiller added to the polymer matrix, the surface condition became rougher due to better dispersion of nanofiller. It was observed that PLA/PA6/GNP (5.0) nanocomposites have better uniform dispersion in the polymer matrix as compared to other blend composition which contributed to the better mechanical strength.
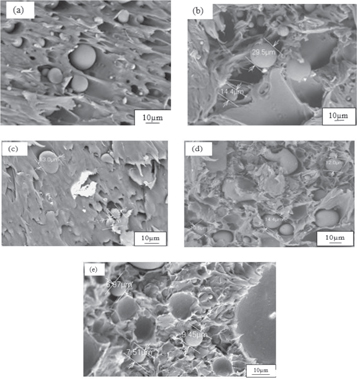
Figure 2. SEM of (a) PLA/PA6,(b) PLA/PA6/GNP(0.5), (c) PLA/PA6/GNP(1.0), (d) PLA/PA6/GNP(3.0) and (e) PLA/PA6/GNP(5.0).
Download figure:
Standard image High-resolution imageThe dispersion of PLA/PA6/GNP in the nanocomposites was further investigated by using a TEM (FEI, Tecnai G2F20) operating at 200 kV. In figure 3, the dispersion of PLA/PA6/GNP (0.5) is poor as compared to other nanocomposites. PLA/PA6/GNP (3.0) shows a good state of nanofiller dispersion in the polymer matrix while PLA/PA6/GNP (5.0) starts to clump together due to the excess amount of nanofiller.

Figure 3. TEM images (a) PLA/PA6/GNP(0.5), (b) PLA/PA6/GNP(1.0), (c) PLA/PA6/GNP(3.0), (d) PLA/PA6/GNP(5.0).
Download figure:
Standard image High-resolution image3.3. Thermal properties
TGA analysis was carried out to study the effect of graphene nanoplatelet on the thermal degradation behaviour of PLA under nitrogen, were heated from 25 °C to 600 °C at a rate 10 °C per minute and the mass loss recorded as a function of temperature. Loss of mass happened because of chemical reactions or changes in physical during the heating process. The TGA traces for PLA/PA6/GNP are shown in figure 4. The graphene present in PLA/PA6 material higher the onset of degradation due to the more thermally stable organic cations. To gain quantitative measurements the data were analysed by recording the temperature at which T5, T10, and T50 weight loss had occurred. The results are tabulated in table 3.
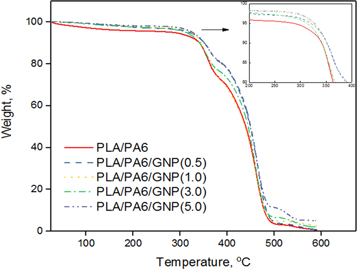
Figure 4. TGA thermograms of PLA/PA6, PLA/PA6/GNP(0.5), PLA/PA6/GNP(1.0), PLA/PA6/GNP(3.0) and (e) PLA/PA6/GNP.
Download figure:
Standard image High-resolution imageTable 3. Degradation temperatures for PLA/PA6 nanocomposites.
| Sample | T5% | T10% | T50% |
|---|---|---|---|
| PLA/PA6 | 285.9 | 341.4 | 439.6 |
| PLA/PA6/GNP(0.5) | 319.9 | 351.5 | 449.9 |
| PLA/PA6/GNP(1.0) | 323.6 | 344.5 | 437.8 |
| PLA/PA6/GNP(3.0) | 312.9 | 341.1 | 444.5 |
| PLA/PA6/GNP(5.0) | 326.8 | 351.2 | 449.0 |
The most important parameters taken from TGA curves are the onset of degradation at T5% and the midpoint temperature of degradation T50%. When 5% weight loss is selected as point of comparison the degradation profile shows that the PLA/PA6 material starts to decompose at 285.9 °C and, when the PLA/PA6 is then combined with the graphene nanoplatelet, there is an improvement in temperature degradation with PLA/PA6/GNP (0.5), PLA/PA6/GNP (1.0) and PLA/PA6/GNP (5.0) having a temperature degradation at 319.9 °C, 323.6 °C and 326.8 °C respectively. The improvement in thermal stability of the nanocomposites is mainly due to better dispersion in which the interaction between the graphene and the polymer, thus the PLA/PA6/GNP (5.0) in having the best dispersion have the largest improvement in thermal stability.
Thermograms of PLA/PA6/GNP/shows high thermal stability than PLA/PA6 blends. This is probably due to the dispersion state of GNP layers in the polymer matrix. The graphene improved the thermal stability of PLA/PA6 matrix due to the intrinsic characteristic of the graphene leads to great enhancement of the thermal stability of the polymer matrix. Graphene sheets take a role of thermal barriers and improve the thermal stability of polymer matrix. With the incorporation of GNP into polymer matrix will influence the material's thermal stability. The layer structure gives a greater barrier effect to inhibit the evaporation of the volatile degradation products generated in thermal decomposition of the nanocomposite.
The DSC glass transition temperature, cold crystallization and melting temperature for all nanocomposites are illustrated in table 4 and figure 5 respectively. PLA has semicrystalline polymer, the crystallinity depends on its mechanical properties. Thus, DSC is used to measure the changes of crystallinity between PLA/PA6 blend and PLA/PA6/GNP nanocomposites. Figure 4 shows the blend of PLA/PA6 and its nanocomposites which gives the similar peaks of melting curves and the similar result of the melting point of PLA/PA6 blends and its nanocomposites.
Table 4. Temperature transitions of PLA/PA6 nanocomposites.
| Sample | Tg (°C) | Tcc (°C) | Tm (°C) |
|---|---|---|---|
| PLA | 65.0 | — | 170.2 |
| PLA/PA6 | 84.6 | 159.6 | 220.0 |
| PLA/PA6/GNP (0.5) | 82.9 | 163.1 | 222.6 |
| PLA/PA6/GNP (1.0) | 88.4 | 162.9 | 219.6 |
| PLA/PA6/GNP (3.0) | 89.2 | 161.2 | 219.1 |
| PLA/PA6/GNP (5.0) | 90.0 | 162.2 | 219.4 |
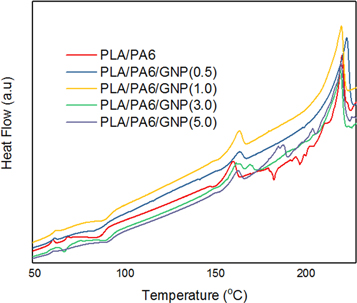
Figure 5. DSC thermograms of PLA/PA6, PLA/PA6/GNP(0.5), PLA/PA6/GNP(1.0), PLA/PA6/GNP(3.0) and (e) PLA/PA6/GNP.
Download figure:
Standard image High-resolution image3.4. Chemical properties
Fourier Transform Infrared spectroscopy, FTIR was used to analyse PLA/PA6/GNP which measures the intensity transmittance over a range of wavelengths at a time. It is also used to monitor the functional group of the polymer matrix and to investigate any chemical reaction that occurred between the matrix and graphene. For comparison, the blend of PLA/PA6/GNP have been compared with their two pristine components which are PLA and PA6. The discussion of the results begins with PLA and PA6 as pure components are shown in figure 6.
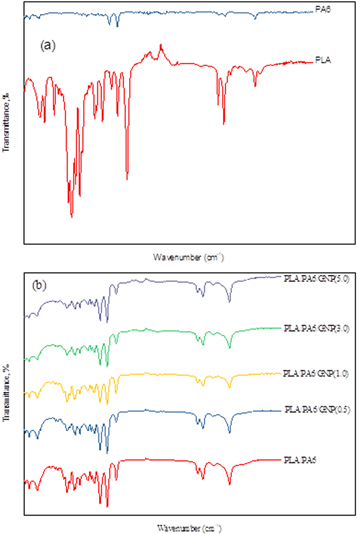
Figure 6. (a) FTIR spectrum pristine PLA, PA6 and (b) its nanocomposites.
Download figure:
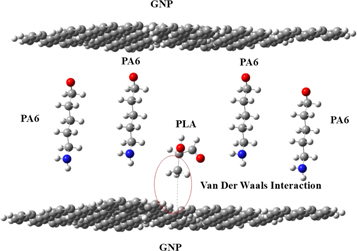
Standard image High-resolution imageThe addition of graphene in the polymer blend shows the change of CH stretching band from 3080 to 3066 cm−1 (figure 6), indicating that the van der Waals interaction occurred in the blend system [16]. There is no new functional group formed thus suggesting that only non-covalent interaction involved in the system. Figure 7 shows the schematic diagram of van der Waals interaction that was expected to have occurred in the blend systems (PLA/PA6/GNP). It can be concluded that the blends are not compatible and immiscible.
Figure 7. Schematic diagram of expected van der Waals interaction in polymer blend (PLA/PA6/GNP) system.
Download figure:
Standard image High-resolution image
4. Conclusions
In this work, the preparation of PLA/PA6/GNP nanocomposites and characterization of chemical interaction between functional group, dispersion of nanofillers in PLA/PA6 matrix, thermal properties and mechanical properties have been studied. The ratio of PLA/PA6 was fixed to 20:80 throughout the study and the suitable temperature for melt intercalation method by using twin screw extruder is around 205 °C to 260 °C. It was found that PLA/PA6/GNP (5.0) nanocomposites were the overall highest in terms of thermal and mechanical properties. Degradation temperature, glass transition, cold crystallization temperature and melting temperature also were increased when more GNP added to the polymer matrix. This is due to better dispersion of graphene nanofiller in the PLA matrix. The FTIR analysis revealed that van der Waals interaction occurred in the blend system.
Acknowledgments
The authors wish to acknowledge Universiti Malaysia Pahang (UMP) for the financial assistance provided under the internal research grants (RDU160336 and RDU180351).