

Abstract
Temperature-dependent x-ray diffraction (XRD), neutron powder diffraction and high-field electron spin resonance (ESR) have been employed to study the structural and magnetic properties of distorted honeycomb lattice Mn2V2O7. The XRD data reveal that upon cooling Mn2V2O7 undergoes a martensitic-like β–α structural phase transition at ~270 K. Upon heating, however, the reversible α–β structural transition takes place at ~210 K, showing the first-order feature of the transition. The temperature range, where the two phases coexist, is well determined. With further decrease in temperature, a paramagnetic-to-antiferromagnetic (AFM) phase transition takes place at TN = ~23 K as indicated by ESR and neutron powder diffraction data. The ESR data demonstrate the AFM resonance modes below TN, which can be well understood by conventional AFM resonance theory with uniaxial anisotropy.
Export citation and abstract BibTeX RIS
1. Introduction
Two-dimensional (2D) honeycomb-lattice spin systems have been investigated intensively because novel ground states might be induced by frustration and enhanced quantum fluctuations [1–6]. For instance, the frustrated spin-1/2 J1–J2 Heisenberg antiferromagnet on honeycomb lattice with antiferromagnetic (AFM) first- (J1) and second-neighbor (J2) interactions was considered as a promising candidate for spin liquid state [7, 8]. Besides, superconductivity was observed in pnictide SrPtAs with honeycomb-lattice [9, 10], in contrast to the well-known iron pnictide superconductors that contain square lattices [11]. Moreover, iridium oxides with honeycomb lattice have recently been identified as platforms for realizing Kitaev topological spin liquid [12].
Compounds with formula A2V2O7 (A = Cu, Ni, Co and Mn) have attracted much interest due to their rich structural features and magnetic properties [13–20]. In particular, Mn2V2O7 was reported to possess a distorted honeycomb lattice [21, 22] and could be considered as a dielectric material and a new energy material for solar water splitting application [23, 24]. Mn2V2O7 exhibits two different phases, i.e. the β-phase and the α-phase [22], depending on the environments. The β-Mn2V2O7 crystallizes in the monoclinic structure with space group C2/m, while the α-Mn2V2O7 in the triclinic structure with space group P-1. As temperature decreases, the crystallographic symmetry of Mn2V2O7 reduces and leads to the β-to-α phase transition. This structural phase transition is fully reversible with a significant thermal hysteresis, in line with the first-order character of the structural phase transition. In [22], the β–α structural transition of Mn2V2O7 takes place at ~200 K on cooling, whereas it occurs at 250 K on heating. Therefore, it was suggested that this reversible structural transition is a martensitic-like transformation [22], which is a first-order thermoelastic solid-solid phase transition involving lattice distortion but without atomic exchange or diffusion [25, 26]. We note that the reported β–α transition was mostly based on macroscopic characterization methods such as magnetization measurement and differential scanning calorimetry thermal analysis. Microscopic evidence on temperature-induced structural phase transition is absent.
The magnetic and heat capacity measurements showed that Mn2V2O7 is antiferromagnetically ordered below TN = 20 K [22]. A field-induced spin-flop transition takes place at Hsf = 2.5 T when magnetic field is applied along the [1 1 0] direction of β-phase (i.e. [0 0 1] of α-phase), indicating the presence of magnetic anisotropy. It is also noticed that the broad peak in magnetic susceptibility, which is an indication of low-dimensional magnetism, is absent in Mn2V2O7. This implies the existence of interaction between honeycomb layers due to the distorted structure. Indeed, it was tempting to describe the magnetic behavior of α-Mn2V2O7 within the framework of 3D antiferromagnetism [21].
In order to understand the structural and magnetic properties of Mn2V2O7 at the microscopic level, we carried out temperature-dependent x-ray diffraction (XRD), neutron powder diffraction and high magnetic field electron spin resonance (ESR) measurements of polycrystalline Mn2V2O7. The microscopic studies will help us to understand how the phase revolution takes place in this compound, which provides a direct way to comprehend how the first-order thermoelastic phase transition can influence the magnetic properties of the compound.
2. Experimental details
Polycrystalline sample of Mn2V2O7 was prepared using sol–gel method by dissolving stoichiometric amounts of high purity Mn(NO3)2·6H2O and NH4VO3 in deionized water. The powder XRD measurements were performed using a Huber G670 Guinier imaging plate diffractometer with Cu Kα1 radiation and a closed-cycle cryostat. The program FullProf [27] was used for the Rietveld refinement in order to obtain structural parameters. The zero-field-cooled (zfc) magnetization was measured using a superconducting quantum interference device (SQUID) magnetometer. The magnetically aligned sample was prepared by mixing powder sample of Mn2V2O7 with nonmagnetic epoxy resin at a weight ratio of 1:10. The mixture was filled into nonmagnetic thin walled pipe. Then a magnetic field of 5 T was applied along the axis of the pipe until the mixture was hardened. The field-increasing ESR spectra were collected in the pulsed magnetic fields. The polarized neutron scattering measurements were carried out on the diffuse neutron scattering spectrometer DNS [28] at the Heinz Maier–Leibnitz Zentrum (Garching, Germany). A PG(0 0 2) monochromater was used to produce a monochromatic neutron beam with the wavelength of 4.14 Å. About 1 g of Mn2V2O7 powder sample was put inside a thin aluminum sample holder that was fixed to the cold tip of the sample stick of a 4He close cycle cryostat, allowing the measurements at different temperatures from 300 K down to 3 K.
3. Results and discussion
3.1. Martensitic-like structural phase transition
The quality of synthesized sample Mn2V2O7 was examined by XRD. Figure 1 shows the XRD patterns measured at 300 K and 10 K, respectively. By adopting Rietveld refinement method, there is a good agreement between observed XRD pattern and calculated one with a weighed pattern factor Rwp = 16.9% (10 K) and Rwp = 14.6% (300 K), respectively. At 300 K, Mn2V2O7 crystallizes in monoclinic (C2/m) structure and the derived lattice parameters are a = 6.7236(4) Å, b = 8.7211(5) Å, c = 4.9641(3) Å and β = 103.775(3)°, whereas the symmetry of the system is lowered to triclinic (P-1) at 10 K and the lattice parameters are a = 6.8660(4) Å, b = 7.9351(2) Å, c = 10.9029(2) Å, α = 87.407(7)°, β = 72.001(9)°, and γ = 83.238(2)°. The refined atomic positions for 300 K (β-monoclinic phase) and 10 K (α-triclinic phase) are listed in tables 1 and 2, respectively.
Table 1. Experimental atomic positions of α-Mn2V2O7 (10 K) obtained from x-ray diffraction Rietveld refinement.
| Atom | Wyckoff position | x | y | z |
|---|---|---|---|---|
| Mn1 | 2i | 0.094 73 | 0.128 37 | 0.589 07 |
| Mn2 | 2i | 0.398 30 | 0.409 10 | 0.403 06 |
| Mn3 | 2i | 0.414 35 | 0.413 73 | 0.895 93 |
| Mn4 | 2i | 0.074 44 | 0.125 30 | 0.081 89 |
| V1 | 2i | 0.555 56 | 0.149 15 | 0.129 75 |
| V2 | 2i | 0.564 32 | 0.165 45 | 0.639 75 |
| V3 | 2i | 0.085 47 | 0.731 75 | 0.616 06 |
| V4 | 2i | 0.078 13 | 0.599 49 | 0.142 24 |
| O1 | 2i | 0.395 38 | 0.143 67 | 0.027 94 |
| O2 | 2i | 0.121 59 | 0.923 21 | 0.970 25 |
| O3 | 2i | 0.413 99 | 0.645 05 | 0.788 68 |
| O4 | 2i | 0.527 72 | 0.021 20 | 0.736 76 |
| O5 | 2i | 0.422 72 | 0.165 80 | 0.543 25 |
| O6 | 2i | 0.188 76 | 0.884 60 | 0.444 10 |
| O7 | 2i | 0.409 49 | 0.611 38 | 0.287 10 |
| O8 | 2i | 0.050 68 | 0.887 14 | 0.697 63 |
| O9 | 2i | 0.724 70 | 0.412 24 | 0.438 40 |
| O10 | 2i | 0.171 73 | 0.346 60 | 0.405 64 |
| O11 | 2i | 0.046 41 | 0.647 56 | 0.767 48 |
| O12 | 2i | 0.010 09 | 0.739 19 | 0.299 14 |
| O13 | 2i | 0.725 42 | 0.415 22 | 0.947 30 |
| O14 | 2i | 0.107 50 | 0.336 78 | 0.966 79 |
Table 2. Experimental atomic positions of β-Mn2V2O7 (300 K) obtained from x-ray diffraction Rietveld refinement.
| Atom | Wyckoff position | x | y | z |
|---|---|---|---|---|
| Mn | 4g | 0.000 00 | 0.810 25 | 0.000 00 |
| V | 4i | 0.733 03 | 0.000 00 | 0.409 13 |
| O1 | 2d | 0.500 00 | 0.000 00 | 0.500 00 |
| O2 | 4i | 0.903 84 | 0.000 00 | 0.699 04 |
| O3 | 8j | 0.738 01 | 0.162 56 | 0.19170 |

Figure 1. Observed and calculated XRD patterns and the difference between them: (a) β-Mn2V2O7 at 300 K; (b) α-Mn2V2O7 at 10 K. The green vertical bars indicate the expected Bragg reflection positions.
Download figure:
Standard image High-resolution imageThe temperature dependent XRD patterns were collected by cooling the sample first, and then heating the sample within a temperature range between 300 and 10 K. Figure 2 plots the temperature evolution of the two strongest peaks, A and B. The peak A is composed of (2 0 0), (1 1 1) and (0 2 1) reflections, and the peak B is a single (−2 0 1) reflection, according to the monoclinic β-phase. As the sample is cooled down from 300 K, the intensity of A and B is slightly reduced (see figure 2(a)). Meanwhile, the reflections A and B move to higher Bragg angles. All reflections in the XRD patterns between 300 and 280 K can be properly indexed with the monoclinic structure model. Once the temperature decreases below 270 K, a new peak located between A and B appears and it splits into two peaks (D and E) with a further decrease in temperature, accompanied with the complete suppression of peak B. According to the low-temperature triclinic structure model, peak C consists of (2 1 1), (2 0 0), (2 0 2) and (1 − 2 0) reflections, peak D consists of (0 − 1 3), (0 2 2), (1 − 1 3) while peak E consists of (2 1 0), (0 − 2 2) and (2 1 2) reflections. Both peaks D and E shift slightly toward higher Bragg angle with decreasing temperature, suggesting a decrease in the lattice parameters. The peak splitting in XRD patterns provides direct evidence of monoclinic (β)-triclinic (α) structural phase transition. The system is monoclinic above 270 K but it transforms into triclinic structure below 210 K, while two phases coexist between 270 and 210 K.

Figure 2. Temperature dependence of XRD patterns of Mn2V2O7: (a) cooling, T = 300–180 (step = 10 K), 160–60 (step = 20 K), 50, 40, 30, 25, 20–12 K (step = 2 K) from top to bottom; (b) heating, T = 300–180 (step = 10 K), 160–60 (step = 20 K), 50, 40, 30, 25, 20–10 K (step = 2 K) from top to bottom.
Download figure:
Standard image High-resolution imageAs the Mn2V2O7 sample is warmed up from 10 K (see figure 2(b)), the pure α-phase holds until 240 K. Above this temperature the β-phase appears and coexists with the α-phase up to 300 K. The obvious difference in the XRD patterns between cooling and heating procedures suggests that the monoclinic (β) to triclinic (α) structural phase transition is strongly thermally hysteretic, thus confirming the first-order character of the structural phase transition. A scrutiny of structural features reveals that the honeycomb layers in the β-Mn2V2O7 are parallel to the (0 0 1) plane and those in the α-Mn2V2O7 are parallel to the (1 − 1 0) plane. The primitive vectors, a, b and c, in the β-phase can be converted into a', b' and c' in the α-phase by the following correlation equations: a' = 1/2(a − b + 2c), b' = 1/2(a − b − 2c) and c' = a + b. Figure 3 shows the temperature dependence of the lattice parameters a', b', c' and the unit-cell volume in the α-phase representation. In the pure β-phase zone, the lattice parameters have no significant change (see figure 3(a)), while the lattice parameters exhibit a decrease upon cooling in the pure α-phase zone. In the region of coexistence of the two phases, the lattice parameters of the two different structures deviate largely from each other.

Figure 3. Temperature dependence of the lattice parameters and unit cell volume in the low-temperature α-phase representation: (a) cooling and (b) heating. The colored area is the region of the coexistence of two phases. The arrows show the direction of the temperature change.
Download figure:
Standard image High-resolution imageWe now discuss how the honeycomb lattice is distorted during the temperature-induced first-order structural phase transition. We choose two temperatures (10 K and 300 K) far away from the critical temperature to analyze this distortion by comparing the manganese hexagon. The honeycomb lattice at 300 K has a higher crystallographic symmetry, the distance of nearest-neighbor Mn2+ ions along the b-axis is 3.3097 Å, while the other four edges of manganese hexagon are all 3.5223 Å in length. With decreasing temperature, the lattice starts to deform and reaches maximum in magnitude at 10 K. Our Rietveld refinement for the structural parameters shows that there are two different kinds of Mn–Mn bond lengths in the manganese hexagon (3.3097 Å and 3.3097 Å) at 300 K, while at 10 K the manganese hexagon consists of three kinds of Mn-Mn bond lengths (3.3278 Å, 3.4173 Å and 3.3900 Å).
3.2. Magnetic properties and AFM resonance
The magnetization measurement confirms the AFM ordering at TN = 23 K. The top inset of figure 4 shows that the 1/χ(T) curve above 50 K follows the Curie–Weiss law with Weiss constant θp = −32 K and an effective magnetic moment µeff = 5.4 μB/Mn2+, in good agreement with previous report [21]. The main panel of figure 4 is the field dependence of magnetization measured at 2 K under applied magnetic field up to 9 T. The M–H curve is linear in low field because of the AFM ground state. A field-induced spin-flop transition takes place at Hsf = 2.5 T, indicating the existence of magnetic anisotropy, which is also confirmed by the frequency-dependent EPR spectra collected at 2 K. The spin-flop transition reveals the spin structure variation at low temperature. The critical field is similar with the value obtained from single crystal along [0 0 1] direction of α-phase [29]. Above Hsf, the magnetization increases continuously. The extrapolation of the linear part points to the origin, which is expected for the spin-flop transition in AFM state. The M–T curves of magnetically aligned sample measured at 0.1 T are shown in the bottom inset of figure 4, which also reveals the presence of a big magnetic anisotropy in this compound.

Figure 4. The M–H curve measured at 2 K for α-Mn2V2O7. The dashed line stands for the extrapolation of the linear part. The inset shows the zfc heating 1/χ(T) curve measured at 0.01 T and the M–T curves of the magnetically aligned sample measured at 0.1 T.
Download figure:
Standard image High-resolution imageIn order to study microscopic magnetism of Mn2V2O7, we performed neutron diffraction experiment with a polarization analysis. The neutron diffraction patterns of α-Mn2V2O7 at 3 K (<TN) are shown in figure 5. The nuclear coherent, spin incoherent and magnetic signals are well separated from the total neutron scattering of the sample. In contrast to the spin incoherent scattering, which is almost featureless in the whole Q range from 0.4 to 2.6 Å−1, both the nuclear and magnetic contributions are significant. Owing to the formation of long-range ordering of Mn2+ moments, the magnetic scattering reflections are clearly observed and some of them exhibit similar intensities compared to nuclear reflections. Apparently, most of the magnetic reflections locate in low Q range, suggesting the presence of a magnetic superstructure. It was found that the magnetic structure of α-Mn2V2O7 might be incommensurate in nature since the magnetic reflections cannot be indexed properly with commensurate propagation vector. Given the fact that α-Mn2V2O7 possesses very low symmetry and four different Mn sites, it is nontrivial to determine the magnetic structure of Mn2V2O7 based on barely the neutron powder diffraction data. Future single crystal neutron diffraction studies are necessary to unambiguously solve the magnetic structure.

Figure 5. Neutron scattering patterns of α-Mn2V2O7 at 3 K. The contributions from nuclear coherent scattering, spin incoherent scattering and magnetic scattering are separated by xyz-polarization analysis.
Download figure:
Standard image High-resolution imageFigure 6 shows the evolution of magnetic Bragg reflections in low-Q range at different temperatures. Upon the increase in temperature, the long-range magnetic order diminishes gradually and an order–disorder transition takes place as indicated by the decrease of intensity of magnetic reflections. The temperature dependence of integrated intensity of magnetic reflections around 0.7 Å−1 was plotted in the inset of figure 6, showing the onset of magnetic order at TN = 23(2) K.

Figure 6. Temperature dependence of magnetic Bragg reflections in low-Q range. The inset shows the temperature dependence of the integrated intensity of magnetic reflections between 0.5 and 0.9 Å−1. The solid curve is a guide to the eyes.
Download figure:
Standard image High-resolution imageThe high-field ESR is a powerful tool to reveal the ordered state of magnetic systems with large magnetic anisotropy. Figure 7 shows the temperature-dependent resonance spectra measured at 120 GHz. A single PM resonance peak is observed at high temperature. The g value is derived to be g = 1.99, a typical value of PM Mn2+ ion. Decreasing temperature leads to a broadening of the peak. Below TN = 23 K, the resonance peak splits into three modes. The mode 2 is stronger in intensity than the other two modes. With decreasing temperature, there is no shift of mode 1, whereas mode 2 shifts significantly toward the low field. The third mode also exhibits a slight shift and it could be ascribed to the EPR with a larger g value (see below), due to a small amount of paramagnetic impurities present in the sample.

Figure 7. Temperature-dependent ESR spectra measured at 120 GHz.
Download figure:
Standard image High-resolution imageThe frequency dependence of the ESR spectra measured at 2 K is shown in figure 8. Above 85 GHz, mode 1 and mode 2 as well as the EPR mode are observed. With increasing frequency, the difference of resonance fields between mode1 and mode 2 becomes smaller. Below 85 GHz, a new mode, which is denoted as mode 3, appears and its resonance field increases with decreasing frequency. There is an additional mode, which is marked by asterisks in figure 8, and its origin is not clear. Figure 9 gives the frequency-field (f-H) relationship, which indicates that the observed resonances are AFM resonance modes with easy-axial type anisotropy [30–37]. The EPR mode is linear and passes through the origin with g = 2.11.

Figure 8. Frequency-dependent EPR spectra collected at 2 K.
Download figure:
Standard image High-resolution image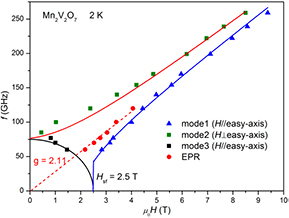
Figure 9. Frequency-field (f–H) relationship at 2 K (<TN). Green, blue and black solid lines are guides to the eyes, according to the AFM resonance theory with easy-axis anisotropy. The red dashed line is the EPR line.
Download figure:
Standard image High-resolution image
The AFM resonances with easy-axis anisotropy can be understood within the framework of the conventional molecule-field theory [38, 39]. For a simple two-sublattice collinear antiferromagnet, the zero-field gap is given by Δ = gμBHsf/h for AFM state [40], in which h is the Plank constant. With Hsf = 2.5 T from the magnetization data, the AFM gap is derived to be about Δ = 75 GHz. According to [41], mode 1 and mode 3 belong to H// easy axis and follow hf/gμB =  and hf/gμB =
  , respectively. The mode 2 corresponds to H⊥ easy axis and can be described as hf/gμB =
  , where HRes is the resonance field. The zero-field AFM gap originates from the exchange interaction HE and magnetic anisotropy HA, it can be expressed as Δ =
  . Figure 9 shows that our ESR data do not match with the theoretical model completely. This is probably because our treatment using a two-sublattice model is only an approximation. In fact, there are four different Mn ions in α-Mn2V2O7 and the magnetic structure is very complicated based on our neutron scattering experiments.
4. Conclusions
In summary, we have investigated the structure and magnetic properties of the distorted honeycomb-lattice antiferromagnet Mn2V2O7 by using various experimental techniques, including magnetic measurements, temperature-dependent XRD, neutron powder diffraction and high-field ESR. As a result, the first-order martensitic-like β–α structural phase transition has been illustrated microscopically. The temperature region for coexistence of the two phases is derived to be 270–210 K for the cooling process and 240–300 K for the heating process. The spin-flop transition at Hsf = 2.5 T observed in magnetization curve is due to the uniaxial anisotropy, which is well evidenced by our ESR spectra at 2 K.
Acknowledgments
This work was supported by the National Natural Science Foundation of China (Grant Nos. 11474110) and Project Based Personnel Exchange Program (PPP) with China Scholarship Council (CSC Nos. 2016-6041) and German Academic Exchange Service (Project-ID 57219934). ZCX is grateful for support from the National Key Research and Development Program of China (Grant No. 2016YFA0401003) and the Natural Science Foundation of China (Grant No. 11674115). JFW is grateful for the Natural Science Foundation of China (Grant No. 11574098).