
Abstract
The growing demand for safe, cost-efficient, high-energy and high-power electrochemical energy storage devices has stimulated the development of aqueous-based supercapacitors with high capacitance, high rate capability, and high voltage. 2D titanium carbide MXene-based electrodes have shown excellent rate capability in various dilute aqueous electrolytes, yet their potential window is usually narrower than 1.2 V. In this study, we show that the potential window of Ti3C2Tx MXene can be efficiently widened to 1.5 V in a cost-effective and environmentally benign polyethylene glycol (PEG) containing molecular crowding electrolyte. Additionally, a pair of redox peaks at −0.25 V/−0.05 V vs. Ag (cathodic/anodic) emerged in cyclic voltammetry after the addition of PEG, yielding an additional 25% capacitance. Interestingly, we observed the co-insertion of the molecular crowding agent PEG-400 during the Li+ intercalation process based on in-situ x-ray diffraction analysis. As a result, Ti3C2Tx electrodes presented an interlayer space change of 4.7 Å during a complete charge/discharge cycle, which is the largest reversible interlayer space change reported so far for MXene-based electrodes. This work demonstrates the potential of adding molecular crowding agents to improve the performance of MXene electrodes in aqueous electrolytes and to enlarge the change of the interlayer spacing.
Export citation and abstract BibTeX RIS

Original content from this work may be used under the terms of the Creative Commons Attribution 4.0 license. Any further distribution of this work must maintain attribution to the author(s) and the title of the work, journal citation and DOI.
1. Introduction
There is an increasing need for safe, low-cost, high-energy and high-power electrochemical energy storage (EES) devices due to the rapidly growing market for electric vehicles and renewable energy. Capacitive/pseudocapacitive energy storage, which involves the formation of an electrochemical double layer (EDL) and/or surface-controlled redox reactions, shows a high power density and superior cycling stability, but a lower energy density compared to Li-ion batteries [1, 2]. Commercial EDL capacitors with activated carbon electrodes and traditional organic electrolytes can achieve an energy density of 10 Wh kg−1 at a superior power density of 30 kW kg−1 [3]. However, the inherent flammability and toxicity of organic electrolytes raise significant safety concerns. Aqueous electrolytes are considered reliable alternatives to organic electrolytes because they are much safer, more cost-effective, and eco-friendly. The main issue with dilute aqueous electrolytes is that their electrochemical stability window (ESW) is limited by the water electrolysis reaction (∼1.23 V). The narrow ESW not only restricts the options of promising electrodes but also limits the energy and power density of aqueous energy storage devices [4]. Increasing the salt concentration in water has been found to extend the ESW of aqueous electrolytes by suppressing water decomposition. For example, the use of 'water-in-salt' (WIS) 21 m Lithium bis(trifluoromethanesulfonyl)imide (LiTFSI) electrolyte leads to a wide ESW of up to 3 V [5]. Meanwhile, the high cost of the WIS electrolytes with fluorinated lithium salts impedes their practical application. As a promising alternative, molecular crowding electrolytes (MCE) can widen the ESW and improve the safety without increasing the cost. By introducing polyethylene glycol (PEG) as the crowding agent, a wide ESW of 3.2 V has been reached with only 2 m LiTFSI concentration. In MCE, the ethereal oxygen atom in PEG has a higher negative charge density than the oxygen atom in water, leading to weaker hydrogen bonding between H2O–PEG compared to H2O–H2O. Thus, the H–O covalent bond in water is strengthened, and hence, a higher overpotential is needed to electrochemically decompose water [6].
MXene (Mn +1Xn Tx ) is an emerging family of two-dimensional transition metal carbides and/or nitrides, in which M is an early transition metal, X represents C and/or N, and Tx stands for surface groups such as =O, –OH, –Cl or –F. MXenes exhibit good mechanical stability, great hydrophilicity, superior electronic conductivity, and flexible interlayer spacing, which makes them promising electrode materials for EES [7–9]. A variety of cations, solvent molecules, and large organic molecules have been observed to intercalate spontaneously or electrochemically into the MXene interlayers, resulting in changes in interlayer spacing [10–12]. The electrochemical intercalation processes of ions and molecules are highly dependent on the surface chemistry of MXene and the electrolyte composition. For example, strong surface redox reactions have been observed with the proton intercalation process in Ti3C2Tx electrode with acidic aqueous electrolytes. The surface redox reaction occurs due to the transformation between the oxygen surface groups (=O) and hydroxyl (–OH) groups, accompanied by the change of Ti oxidation state [13–17]. Meanwhile, Ti3C2Tx displays EDL capacitive-dominating charge storage in neutral aqueous electrolytes due to the weaker interactions between the intercalated cations and MXene surface groups [18, 19]. Though the potential window of MXene in the neutral aqueous electrolyte is slightly wider than that in the acidic electrolyte, it is still <1.2 V, limited by the hydrogen evolution reaction and MXene oxidation. With the WIS electrolytes, MXene oxidation can be suppressed, which widens the potential window of Ti3C2Tx up to 1.6 V. Moreover, a unique desolvation-free Li+ ion intercalation process has been observed at the positive potential in the Ti3C2Tx electrode with WIS electrolytes, contributing to extra capacitance [20].
This study investigated the electrochemical behavior of Ti3C2Tx in a low-cost and environmentally benign aqueous MCE (2 m LiTFSI-PEG:H2O) for the first time. Interestingly, MXene with MCEs showed an extra pair of redox peaks on the cyclic voltammogram (CV) compared to 2 m LiTFSI aqueous electrolyte, contributing 25% capacitance increase. To reveal the electrolyte intercalation process of MXene with MCEs, we performed the x-ray diffraction (XRD) to monitor the Ti3C2Tx interlayer spacing change during cycling. The results indicate that the extra redox peak is due to the intercalation of solvated Li+. We also observed the co-insertion of PEG-400, which leads to a large reversible interlayer space change of MXene during the charge and discharge process.
2. Results and discussion
MCEs were made by adding PEG-400 or PEG-8000 to 2 m LiTFSI aqueous electrolyte, and the electrolyte compositions are listed as follows: 2 m LiTFSI-7:3 PEG-400:H2O (or 7:3 PEG-400), 2 m LiTFSI-8:2 PEG-400:H2O (or 8:2 PEG-400), and 2 m LiTFSI-7:3 PEG-8000:H2O (or 7:3 PEG-8000). The electrolyte properties, including stability window, viscosity, and ionic conductivity, are summarized in table S1. The addition of PEG-400 and PEG-8000 to 2 m LiTFSI with a PEG:H2O mass ratio of 7:3 lowered the ionic conductivity from 20.8 mS cm−1 of 2 m LiTFSI to 4.15 mS cm−1 and 4.25 mS cm−1, respectively. Further increasing the PEG-400:H2O ratio to 8:2 increased the viscosity and reduced the ionic conductivity of the electrolyte to 1.06 mS cm−1, which agrees with previous research [6, 21].
Ti3C2Tx MXene used in this study was obtained by selectively removing the A layer from the high-Al MAX precursor using LiF–HCl etching [22]. As shown in figure S1, the characteristic peaks of precursor Ti3AlC2 vanished after etching and the (002) peak downshifted to 6.96°, corresponding to a d-spacing of 12.7 Å, indicating the successful synthesis of Ti3C2Tx . The successful removal of the Al layer was confirmed, as no Al was detected in the x-ray photoelectron spectroscopy (XPS) survey (figure S2). The high-resolution Ti2p and C1s peaks were fitted (figure S3), showing the typical pattern reported for Ti3C2Tx in the literature [22]. When Ti3C2Tx was immersed in the electrolytes, the interlayer spacing increased to 17.1 Å, 19.2 Å, 17.4 Å and 16.1 Å in LiTFSI–H2O, 7:3 PEG-400, 8:2 PEG-400 and 7:3 PEG-8000, respectively. The d-spacing increase in the LiTFSI–H2O electrolyte can be explained by the spontaneous intercalation of Li+ and H2O molecules [23]. Compared to the LiTFSI–H2O electrolyte, the d-spacing change in both PEG-400 electrolytes is larger, which is likely due to the insertion of PEG-400 molecules. The spontaneous PEG-400 insertion could be facilitated by the strong hydrogen bonding between the functional group of MXene and PEG [24]. The d-spacing increase is the smallest for 7:3 PEG-8000 among all electrolytes, suggesting that PEG-8000 does not intercalate spontaneously. This is probably because the PEG-8000 molecules are larger than the original interlayer spacing of MXene [25].
The ESW of the electrolytes was evaluated on glassy carbon (GC) electrodes using linear sweep voltammetry (LSV) at a scan rate of 2 mV s−1. As shown in figure S4, the introduction of PEG did not significantly widen the ESW of 2 m LiTFSI electrolyte on the GC electrodes. In comparison, using MCEs expanded the potential window of MXene electrodes obviously (figure S5). As a higher overpotential is needed to break the stronger covalent O–H bonds of water due to the introduction of PEG, the MCE electrolytes could be operated at a more negative potential range. Additionally, MD simulations have confirmed the decreased fraction of 'free water' molecules in PEG-based MCE, which can suppress the oxidation of MXene and expand the positive potential range [26]. Therefore, a voltage window expansion of 0.3, 0.4, and 0.2 V compared to the 2 m LiTFSI electrolyte was achieved in 7:3 PEG-400, 8:2 PEG-400, and 7:3 PEG-8000, respectively. It is clear that the mass fraction of PEG influences the width of the stability window, which has also been observed in other studies [6, 27].
The electrochemical performance of Ti3C2Tx in MCE was evaluated using cyclic voltammetry at 2 mV s−1 in three-electrode devices. The CV curves for LiTFSI–H2O (figure 1(b)) were rectangular in shape, which is a characteristic of the EDL capacitive charge storage mechanism [2]. Meanwhile, the CVs with MCEs all showed a pair of redox peaks at a less negative potential, which were absent for the 2 m LiTFSI electrolyte (figure 1(b)). The emerged redox peaks in MCEs contributed ∼25% additional capacitance to the MXene electrodes. Similar redox peaks were also observed on Ti3C2Tx with 19.8 m LiCl WIS electrolytes, corresponding to the intercalation of desolvation-free Li+ ions in MXene sheets [20]. The difference is that the peak separations in all three MCEs were ∼0.2 V, which is much smaller than that of 0.76 V in the WIS electrolyte. The cathodic and anodic redox peaks of 7:3 PEG-400 were located at −0.25 and −0.05 V, respectively. Increasing the PEG:H2O ratio to 8:2 leads to a slight shift of redox peaks to −0.3 and −0.1 V. By using PEG-8000 in the MCE, a further shift of the voltage window and the position of the redox peaks (−0.5 and −0.3 V) was observed.
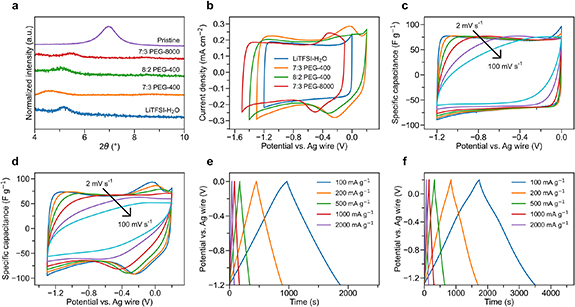
Figure 1. XRD patterns and electrochemical performance of Ti3C2Tx electrodes in four electrolytes: LiTFSI–H2O, 7:3 PEG-400, 8:2 PEG-400, and 7:3 PEG-8000. (a) XRD patterns of Ti3C2Tx before and after immersion in different electrolytes. (b) Comparison of cyclic voltammogram curves at 2 mV s−1 of Ti3C2Tx . (c) Cyclic voltammogram curves of Ti3C2Tx in LiTFSI–H2O at different scan rates. The scan rates from the outer to the inner cycle are 2, 5, 10, 20, 50, and 100 mV s−1. (d) Cyclic voltammogram curves of Ti3C2Tx in 7:3 PEG-400 at different scan rates. (e) Galvanostatic charge–discharge curves of Ti3C2Tx in LiTFSI–H2O. (f) Galvanostatic charge–discharge curves of Ti3C2Tx in 7:3 PEG-400.
Download figure:
Standard image High-resolution imageTo assess the high-rate performance of Ti3C2Tx in MCEs, we conducted the CV test at different scan rates and galvanostatic charge and discharge (GCD) at different current densities (figures 1(c)–(f) and S6). The GCD curves of Ti3C2Tx in LiTFSI–H2O (figure 1(e)) display a sloping curve with no observable voltage plateaus, indicating EDL capacitive mechanism (figure 1(c)). In the 7:3 PEG-400 electrolyte, the redox peak separation increased at higher scan rates. The redox peak intensity decreased, such that the peaks are no longer visible at 100 mV s−1 (figure 1(d)). Correspondingly, bumps can be observed in the GCD curves in 7:3 PEG-400 (figure 1(f)) at the potential of the redox reactions, which then flatten out at higher current densities. Similar trends were observed for the 8:2 PEG-400 and 7:3 PEG-8000 electrolytes (figure S6).
Figure 2(a) displays the capacitance retention of Ti3C2Tx in MCEs at different scan rates. In the LiTFSI–H2O electrolyte, Ti3C2Tx exhibited a capacitance of 80.2 F g−1 at 2 mV s−1 and a capacitance retention of 72% at 100 mV s−1. An increased capacitance of 100.8 F g−1 and 98.2 F g−1 was obtained in the 7:3 PEG-400 and 8:2 PEG-400 electrolytes at 2 mV s−1, respectively. However, they showed a lower capacitance retention of 52% and 29% at 100 mV s−1, respectively, caused by the reduced ionic conductivity of the electrolyte. Despite having the same ionic conductivity as 7:3 PEG-400, 7:3 PEG-8000 exhibited a worse rate performance due to its high electrolyte viscosity, retaining only 34% of the initial capacitance (96.0 F g−1) at 100 mV s−1. The decreased rate performance in MCEs compared to the dilute electrolyte can be attributed to the reduced ionic conductivity. It has been reported that by replacing PEG by polyethylene glycol dimethyl ether or reducing the chain length of PEG (PEG-200), a higher ionic conductivity and a lower viscosity was obtained [27, 28] Thus, an enhanced rate performance may be achieved by optimizing the crowding agent.
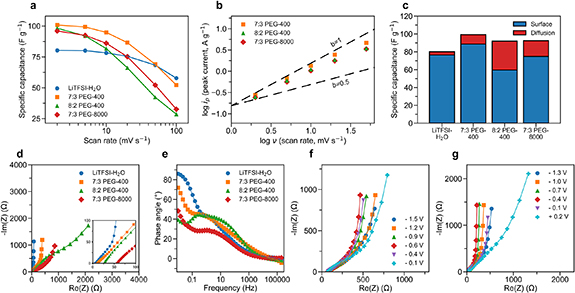
Figure 2. Electrochemical characterization of Ti3C2Tx electrodes in LiTFSI-H2O, 7:3 PEG-400, 8:2 PEG-400 and 7:3 PEG-8000 electrolytes. (a) Capacitance retention of Ti3C2Tx from 2 mV s−1 to 100 mV s−1. (b) Determination of the b value by taking the slope of the logarithm of the anodic peak current (ip) versus the logarithm of the scan rate (υ) from 2 mV s−1 to 50 mV s−1. Only electrolytes containing PEG are shown. (c) Bar chart displaying the capacitances contributed by either surface-controlled or diffusion-controlled process at 5 mV s−1. (d) Nyquist impedance of Ti3C2Tx at the open circuit potential, the inset shows a magnification of the high-frequency range. (e) Bode plot of Ti3C2Tx . Nyquist impedance of Ti3C2Tx in (f) 7:3 PEG-400 and (g) 7:3 PEG-8000 at different applied potentials during the discharge process.
Download figure:
Standard image High-resolution imageTo evaluate the reaction kinetics of the electrochemical process, the CVs recorded at different scan rates were used to obtain the b value in each MCE (figure 2(b)). Typically, a b value equal to 0.5 stands for semi-infinite diffusive behavior, whereas a b value of 1 represents surface-controlled behavior [29, 30]. The obtained b values were 0.88, 0.82, and 0.82 for 7:3 PEG-400, 8:2 PEG-400, and 7:3 PEG-8000, respectively, indicating that the electrochemical processes all involve combined diffusion-controlled and surface-controlled kinetics. A deconvolution analysis [31] was then performed to determine the contribution of surface-controlled and diffusion-controlled capacitance at 5 mV s−1 (figure 2(c)). Among all electrolytes, 8:2 PEG-400 showed the most sluggish kinetics, with 64.7% of its capacitance being surface-controlled. This value is followed by 81.0% of 7:3 PEG-8000, 89.4% of 7:3 PEG-400, and 95.4% of LiTFSI–H2O. The slower kinetics in MCE can also explain the worse rate performance compared to LiTFSI–H2O.
Electrochemical impedance spectroscopy (EIS) was recorded at the open circuit potential to further unravel the kinetics of Ti3C2Tx in MCEs . As shown in the Nyquist plot in figure 2(e), the serial resistance increased when PEG was introduced into 2 m LiTFSI, which was attributed to the decreased ionic conductivity and increased viscosity of the MCEs. No obvious semicircles have been observed at high frequencies for all electrolytes, suggesting negligible charge transfer resistances. In LiTFSI–H2O, a near vertical slope was observed in the low-frequency region in the Nyquist plot (figure 2(d)), and a phase angle response of −86° was recorded at a low frequency of 10 mHz in the bode plot (figure 2(f)). Both observations suggest a capacitive charge storage mechanism. Differently, the phase angles of the Ti3C2Tx electrode reached −72° and −49° at low frequency in 7:3 PEG-400 and 7:3 PEG-8000, respectively. The lower phase angles imply more sluggish diffusion kinetics in the MCEs than in LiTFSI–H2O [32]. Notably, a new arc emerged at the low-frequency region in the Nyquist plot in 8:2 PEG-400, which may indicate another charge transfer process at low frequency [33]. The Nyquist plots of Ti3C2Tx in the 7:3 PEG-400 electrolyte were recorded at different applied potentials during the discharge process (figure 2(g)). Capacitive behavior dominated at almost all applied potentials, except for +0.2 V. A similar trend was observed in 7:3 PEG-8000, as the slowest kinetics occurred at most positive potential. The more sluggish kinetics indicate a different electrochemical process at the most positive potential. The cycling stability of Ti3C2Tx electrode in 7:3 PEG-400 electrolyte was evaluated using GCD at a current density of 1 A g−1. A capacitance retention of ∼80% was obtained after 10 000 cycles, indicating great reversibility (figure S7).
In-situ XRD was used to investigate the interlayer spacing changes of Ti3C2Tx during the first three CV cycles. The interlayer space changes of MXenes during the charge and discharge process are determined by both the steric effect and the electrostatic interaction [13]. In general, the insertion of cations that have large solvated ionic radius may lead to an expansion of d-spacing, whereas the intercalation of small cations may lead to a d-spacing shrinkage. Therefore, the evolution of the interlayer spacing during cycling provides important information about the intercalated species. As mentioned above, significant increases in d-spacing were observed when Ti3C2Tx was immersed in all electrolytes, due to the spontaneous intercalation of solvated Li+ or PEG-400 (figure 1(a)). During the first CV cycle, the continuous increase of both the d-spacing and the intensity of (002) peak was observed during charging, which may be attributed to the gradual wetting of Ti3C2Tx in viscous MCEs. The d-spacing evolution of the second cycle was the same as the third cycle in each electrolyte, indicating that the charge/discharge process was stabilized and reversible from the second cycle onwards. As shown in figures 3(a) and S8(a), when a negative potential was applied, the d-spacing of Ti3C2Tx in LiTFSI–H2O electrolyte decreased continuously from 16.9 Å to 16.4 Å during the Li+ intercalation process. The continuous shrinkage of the interlayer space upon charging has also been observed in other MXenes-dilute aqueous electrolyte systems, where the electrostatic attraction between the MXene surface and the intercalated cations causes a slight shrinkage [23]. During the discharge process, the de-intercalation of Li+ happened, leading to an expansion of d-spacing back to 16.9 Å (figure 3(a)).
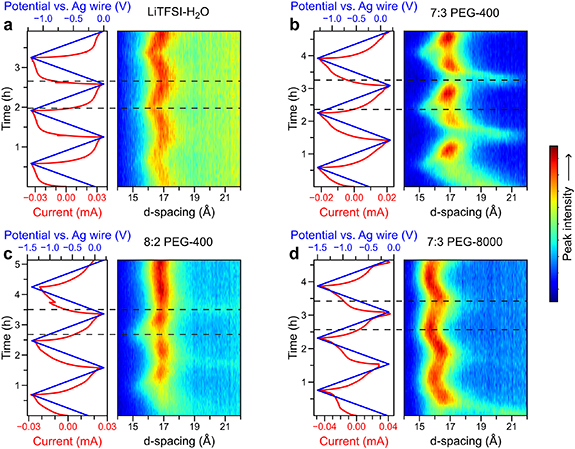
Figure 3. in-situ XRD contour plots and current profile obtained while cycling Ti3C2Tx at a constant scan rate of 0.5 mV s−1 in (a) LiTFSI–H2O. (b) 7:3 PEG-400. (c) 8:2 PEG-400. (d) 7:3 PEG-8000. The x-axis of the contour plot represents the d-spacing of Ti3C2Tx . The dashed lines indicate the position of the largest and smallest d-spacing.
Download figure:
Standard image High-resolution imageBy introducing PEG-400 or PEG-8000 as the crowding agents, a different solvation structure is formed due to the hydrogen bonds between H2O and PEG molecules, resulting in a significantly decreased amount of free water. As a result, a more complex d-spacing evolution of the MXene was observed in the 7:3 PEG-400 electrolyte (figures 3(b) and S8(b)). During the charging process, an additional (002) diffraction peak with a large d-spacing of 20.1 Å suddenly appeared at −0.2 V vs. Ag. Simultaneously, a reduction of the intensity of the pristine (002) peak (16.9 Å) was observed. These synchronous changes indicate that part of the MXene flakes underwent an interlayer space expansion of 3.2 Å at −0.2 V vs. Ag. A reduction peak can be observed on the corresponding CV curve, indicating that enhanced Li+ intercalation occurs during this process, accompanied by a large interlayer space change. A similar abrupt increase of interlayer spacing by 1.9 Å was observed using in-situ XRD when fully solvated Li+ ions (Li (H2O)3 +) intercalated MXene in a WIS electrolyte [20]. Compared to the WIS electrolyte, the larger d-spacing change of 3.2 Å in 7:3 PEG-400 electrolyte may be attributed to the co-insertion of the PEG-400 molecule. As the potential decreased further to −1.3 V, the d-spacing continuously decreased to 15.4 Å, possibly due to stronger interactions between the more negatively charged MXene surface and a larger number of intercalated Li+ ions. Reversibly, the d-spacing increased from 15.4 Å at −1.3 V to 17.0 Å at +0.2 V during discharge due to the Li+ de-intercalation. In the following cycles, an abrupt d-spacing increase was again observed during the cathodic scan, at the potential of the reduction peak on the CV curve . During the overall charge/discharge process, a reversible d-spacing change of 4.7 Å was observed, which, to our best knowledge, is the largest value ever reported for MXene electrodes. Such a large change in d-spacing may hold great potential for MXene-based electrochemical actuators where the actuating behavior is driven by the deformation of electrode [34]. By further increasing the ratio of PEG-400, the evolution process of the d-spacing in 8:2 PEG-400 was similar to that in 7:3 PEG-400 (figure 3(c)), except that less MXene flakes exhibited abrupt interlayer spacing change due to the increased viscosity of the electrolyte. The co-intercalation of PEG was also confirmed by XPS measurements. Figure S8 illustrates the high-resolution C1s and O1s XPS pattern of charged Ti3C2Tx (at −0.5 V). There was a notable rise in C-O content in the 7:3 PEG-400 compared to the LiTFSI–H2O electrolyte, which is likely attributed to the intercalation of PEG.
To understand the impact of the PEG insertion process on the d-spacing evolution, PEG-400 was replaced by PEG-8000 with a much larger size of 3 Å × 42 Å × 102 Å [25]. The insertion of the PEG-8000 was prevented as no sudden d-spacing change was observed in 7:3 PEG-8000 (figures 3(d) and S8(c)). Instead, a small and continuous d-spacing expansion from 16.2 Å to 16.4 Å can be observed from −0.1 V to −0.8 V during charging. This small expansion is different from both the PEG-400 MCE and the dilute system, where a significant increase and a slight continuous decrease in the d-spacing occurs, respectively. This phenomenon can be explained by the intercalation of solvated Li+. Further charging led to a continuous d-spacing shrinkage from 16.4 Å to 15.9 Å, which may be attributed to the strong electrostatic interaction between MXene and intercalated Li+. Despite the lack of abrupt d-spacing changes in PEG-8000 electrolyte, redox peaks can still be seen in the CV (figure 1(b)). This suggests that the additional redox process is governed by the intercalation of solvated Li+, rather than the co-insertion of the PEG molecules. The (de-)intercalation of solvated ions was also observed in 2D TiS2 materials. Due to the small and stable solvation shell around Na+ in diethylene glycol dimethyl ether (DEGDME), the DEGDME was co-intercalated with Na+ at 1.70 V vs. Na+/Na, leading to an expansion of the interlayer distance from 5.69 Å to 14.33 Å during the sodiation process [35].
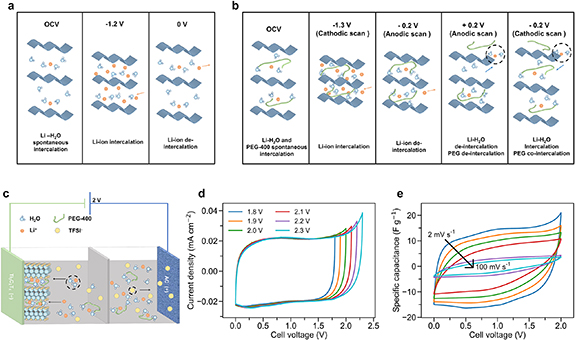
Based on the previous discussion, the charge storage process of Ti3C2Tx in the MCEs differs from that in the 2 m LiTFSI aqueous electrolyte (figures 4(a) and (b)). In the 2 m LiTFSI aqueous electrolyte, the intercalation of Li+ into the MXene layers during the charging process leads to a continuous decrease of d-spacing (figure 4(a)). The continuous d-spacing shrinkage is caused by the increasing electrostatic attraction between the MXene surface and the intercalated ions [23]. Meanwhile, the Li+ intercalation process in the MCEs (both PEG-400 and PEG-8000) involves two steps, such that the interlayer spacing first increases and then decreases. The interlayer spacing increase in PEG-400 and PEG-8000 containing electrolytes is likely correlated to the Li+-H2O co-intercalation [20]. The interlayer spacing shrinkage process at the more negative potentials is similar to that in the 2 m LiTFSI electrolyte, indicating that less or no co-inserted water accompanies the Li+ intercalation. Compared to the dilute aqueous electrolyte, the additional redox peaks on the CV in MCEs are likely related to Li+-H2O co-intercalation caused by the changed electrolyte environment in the bulk electrolyte with the addition of PEG. This extra solvated Li+ intercalation process leads to an increase of capacitance by 25%, compared to the dilute electrolyte. Notably, a unique abrupt interlayer spacing increase (up to 3.2 Å) was observed in PEG-400 containing MCE at the potential of the redox peak on the CV curve. The abrupt interlayer spacing change can be explained by the co-insertion of PEG-400. As a result, the discharge process in 7:3 PEG-400 leads to a significant overall interlayer spacing change of 4.7 Å. DFT simulations and other in situ techniques, such as electrochemical quartz crystal microbalance, should be used to gain more insights on the co-intercalation process.
Figure 4. (a) Schematic illustration of the charge storage mechanism of Ti3C2Tx in LiTFSI–H2O. (b) Schematic illustration of the charge storage mechanism of Ti3C2Tx in LiTFSI-PEG-400:H2O. (c) Schematic illustration of a full cell with a Ti3C2Tx negative electrode, an active carbon positive electrode, and a PEG-400:H2O electrolyte. (d) Voltage window determination of an asymmetric Ti3C2Tx //AC full cell with a 7:3 PEG-400 electrolyte by cyclic voltammetry. (e) Cyclic voltammogram curves of an asymmetric Ti3C2Tx //AC full cell in 7:3 PEG-400. The scan rates from the outer to the inner cycle are 2, 5, 10, 20, 50, and 100 mV s−1.
Download figure:
Standard image High-resolution image
We assembled a full cell using Ti3C2Tx as the negative electrode and 7:3 PEG-400 as the electrolyte to demonstrate the practical application of the electrolyte. An activated carbon-based positive electrode was paired with the MXene electrode with a mass ratio 1:1, as illustrated in figure 4(c). The optimal voltage window was determined to be 2.0 V using CV at 2 mV s−1, reaching >95% Coulombic efficiency (figure 4(d)). Figure 4(e) shows the rate performance of the full cell. A specific capacitance of 25.6 F g−1 was obtained at 2 mV s−1 based on the mass of both electrodes, and 55% of the capacitance was retained at 20 mV s−1. The wide voltage window allowed the Ti3C2Tx //AC asymmetric capacitor to deliver a high energy density of 14.2 Wh kg−1 in 7:3 PEG-400 electrolyte with a power density of 52 W kg−1, which is comparable to that of the WIS electrolyte (9.2 Wh kg−1 at 41 W kg−1) [20].
3. Conclusion
In this study, the electrochemical behavior of Ti3C2Tx was investigated in combination with safe and low-cost PEG-based MCEs. The introduction of PEG expanded the potential window of Ti3C2Tx in 2 m LiTFSI from 1.2 V to ∼1.5 V. More interestingly, Ti3C2Tx showed an additional pair of redox peaks (−0.25 V/−0.05 V) on the CV curve in all MCEs, which contributed 25% additional capacitance to the MXene electrode. Based on the in-situ XRD analysis, abrupt interlayer spacing expansion and shrinkage were observed at the potentials of the redox peaks in the PEG-400 containing MCE, whereas no abrupt changes were observed in the PEG-8000 containing MCE. This indicates that PEG-400 can reversibly co-insert into the MXene interlayer while the insertion of PEG-8000 is prevented. Also, the additional redox peaks on CV are likely attributed to the changed solvation structure with the addition of PEG in the bulk electrolyte, rather than the co-insertion of PEG. The co-intercalation of PEG-400 with Li+ at the peak potential, and the following intercalation of Li+ at the more negative potential during the charge process led to a significant MXene interlayer spacing change of 4.7 Å. The enhanced pseudocapacitive performance and the large reversible interlayer spacing change demonstrate the uniqueness of using MCEs with MXene electrodes.
4. Experimental
4.1. Synthesis of Ti3AlC2 MAX phase
TiC (Alfa Aesar, 99.5%, 2 μm powder), Ti (Alfa Aesar, 99.5%, 325 mesh) and Al (Alfa Aesar, 99.5%, 325 mesh) powders were mixed in a 2:1.25:2.2 molar ratio and sintered at 1380 °C in a tube furnace (TMAXCN, KTL1700) for 2 h under an 80 SCCM argon flow. The resulting sintered MAX phase was then milled into a powder, washed with 9 M HCl (Alfa Aesar, 36%), and subsequently neutralized with deionized water, after which it was dried overnight at 80 °C.
4.2. Synthesis of Ti3C2Tx MXene
0.5 g of Ti3AlC2 MAX phase powder and 0.8 g of LiF powder (Alfa Aesar, 98.5%) were mixed in 10 ml of 9 M HCl. The etching was conducted for 24 h at 35 °C with a 500 rpm stirring speed. After etching, the sediment was washed with deionized water until the pH of the supernatant reached 6. Then, the supernatant was collected and sonicated for 30 min. Ti3C2Tx dispersion was obtained by subsequent centrifuging for 30 min at 3500 rpm, after which it was filtered into a film over a membrane (Jinteng, 0.2 μm pore size).
4.3. Electrochemical setup
Swagelok cells with GC current collectors were used to assemble the three-electrode cell. Ti3C2Tx film with a mass loading of 1.0 mg cm−2 was used as the working electrode. For the XPS measurement of charged Ti3C2Tx , the MXene film was first charged and discharged using CV at a scan rate of 2 mV s−1 for 2 cycles, which was then followed by a linear sweeping voltammetry (LSV) from OCV to −0.5 V vs. Ag wire in LiTFSI–H2O and 7:3 PEG-400:H2O. The charged Ti3C2Tx film was then collected and washed with de-ionized water to remove extra electrolyte.
A mixture of activated carbon (Brunswich, YP-50F 6μ) and PTFE (Sigma-Aldrich, 60 wt% in H2O) in a 95:5 mass ratio was used as an overcapacitive counter electrode. They were separated by a glass fiber membrane (Whatman, GF/A). Polished Ag wire (Alfa Aesar, 99.9%) was used as a reference electrode. A 3-electrode electrochemical cell was used for in-situ XRD, in which a Ti3C2Tx working electrode was pressed against a GC current collector by Kapton film. Pt was used as the counter electrode and an Ag wire was used as reference electrode.
4.4. Electrochemical characterization
All electrochemical measurements were performed on a Biologic VSP-300 potentiostat. The scan rates used for cyclic voltammetry ranged from 2 mV s−1 to 100 mV s−1. The current densities used for galvanostatic cycling ranged from 100 mA g−1 to 2000 mA g−1. EIS was done with frequencies ranging from 10 mHz to 200 kHz with a 10 mV amplitude.
The gravimetric specific capacitance determined from cyclic voltammetry data is given by:
where C is the normalized capacitance in F g−1, m is the mass of the working electrode in g, ΔV is the potential window in V, i is the measured current in A and υ is the scan rate in V s−1.
The b value is determined by taking the slope of the logarithm of the anodic peak current versus the logarithm of the scan rate:
where ip is the anodic peak current in mA, a is a fitting parameter, v is the scan rate in mV s−1. This can be rewritten to a linear relationship of which the slope equals b:

Current deconvolution was done using k1 k2 analysis for a combined charge storage mechanism. Equation (1) can be rewritten to:

where i(V) is the current in mA at a given potential, k1 and k2 are weighing factors for surface and diffusive-controlled current respectively. v is the scan rate in mV s−1. Rewriting this to a linear equation gives:
k1 and k2 are represented by the slope and y-intercept. The ratio between k1 and k2 is the ratio between surface and diffusion-controlled current at a given potential. Taking the average k1 and k2 for all data points in CVs at different scan rates gives the share of surface and diffusion-controlled contribution to the total capacitance.
4.5. Material characterization
Viscosity measurements were done on a TA Instruments Discovery HR-3 Hybrid Rheometer. Shear stress (σ) was measured as a function of strain rate ( ), from which the viscosity was obtained using the plateau value of η = σ/
 . The relationship in all electrolytes was linear with an intercept close to zero.
The chemical composition of Ti3C2Tx was analyzed by XPS using a ThermoFisher K-Alpha surface spectrometer with a monochromatic Al Kα (1486.6 eV) x-ray source source that was operated at 36 W (12 kV, 3 mA), a flood gun operating at 1 V, 100 μA, and a spot size of approximately 800 x 400 μm2. The base pressure in the analysis chamber was approximately 2·10−9 mbar. Two types of measurements were carried out: detailed high-resolution scans of the Ti2p and C1s region in which the pass energy of the analyser was set to 50 eV ('Scan' mode) as well as survey scans were collected across the entire binding energy range with the analyser set to a pass energy of 200 eV. In the analysis, the binding energy was corrected for the charge shift using the primary C1s hydrocarbon peak at BE = 284.8 eV as a reference. The ThermoFisher Avantage software was used to fit the using the weighted least-squares fitting method and a nonlinear Shirley-type background.
XRD was used to characterize the interlayer structure of Ti3C2Tx using an X'Pert Pro diffractometer (PANalytical, 45 kV & 40 mA) with Cu-Kα (λ = 1.54 Å) radiation. For in-situ XRD, Cyclic voltammetry was conducted at 0.5 mV s−1 from the open circuit potential using a Lahne G340A potentiostat and XRD patterns of the Ti3C2Tx electrode were collected in the range 2θ = 3°–20° with a step of 3.5° per minute.
Acknowledgments
C Chen and A de Kogel contributed equally to this work. The authors thank F Ooms, R Dankelman and M Steenvoorden for their help with experiments. C Chen gratefully acknowledges financial support from the China Scholarship Council (CSC). This work was supported by the Dutch Research Council (NWO) under Open Competition Domain Science XS (OCENW.XS22.3.009).
Data availability statements
All data that support the findings of this study are included within the article (and any supplementary files).
Supplementary data (0.8 MB PDF)