
Abstract
Electrochemical intercalation and storage of alkali metal ions into the graphite interlayer space is a key ingredient for commercial rechargeable ion batteries. While this has been exceptionally fruitful for lithium, the use of other more abundant chemical species such as potassium has fallen behind due to their less favorable ionic radius and host–guest interactions. Here, we deploy a device level on-chip cell architecture to study the reversible intercalation of potassium into the single van der Waals gallery of a graphene bilayer at room temperature and monitor in a time-dependent manner the electronic properties of the graphene bilayer during the insertion and extraction processes. The potassium diffusion is highly reversible and a charge transfer up to about 2.5 × 1013 cm−2 is achieved. The diffusion coefficient well exceeds 10−7 cm2 s−1 at room temperature, an order of magnitude larger than previously reported values in graphite and other compounds.
Export citation and abstract BibTeX RIS

Original content from this work may be used under the terms of the Creative Commons Attribution 4.0 license. Any further distribution of this work must maintain attribution to the author(s) and the title of the work, journal citation and DOI.
1. Introduction
Selective intercalation of ions and molecules is a well-known and powerful strategy to modify the structural, electrical and optical properties of layered solids [1]. Ever since the first breakthrough in 1840 [2], a variety of chemical elements acting as donors and acceptors, including calcium [3], lithium [4, 5], sulfuric acid [6] and iron(III) chloride [7, 8], have been driven into the van der Waals galleries of graphite, forming graphite intercalation compounds (GICs) [9]. They deliver appealing characteristics in superconductors [10], catalysts [11] and energy storage devices [12]. Especially, lithium GICs are playing an important role in secondary batteries. However, increasing demand calls for low-cost analogues due to scarce and depleting lithium resources. Potassium (K) GICs are considered a promising alternative, because of the natural abundance of K (1.5 wt % in earth's crust) [13]. Equally important is the redox potential of K+/K (−2.93 V versus the standard hydrogen electrode (E0)). It is close to that of Li+/Li (−3.04 V vs E0), resulting in a comparable energy density [14]. Potassium intercalation does face the less favorable ionic radius and weight of K+ (1.38 Å, 39.1 g mol−1) as compared to Li+ (0.68 Å, 6.9 g mol−1). The substitution of Li by larger K ions alters the guest–host interactions and a rebalancing is required to achieve a favorable coordination environment [15]. This in turn modifies the diffusion properties, redox behavior and interfacial compatibility. The larger ionic radius of K also causes a much greater volume expansion during potassiation [15]. For instance in graphite the volume expansion amounts to 60%, whereas it is only 11% for lithium. This goes hand in hand with high strain and may give rise to poor cycling stability.
Initially, K-intercalation was achieved using non-electrochemical methods. A two-zone vapor transport route was chosen [16]. Although stage-1K-GICs (i.e. KC8) can be prepared, such methods provide limited insight in the intercalation process itself. Techniques such as cyclic voltammetry in electrochemical cells are more suitable for that. For example, reversible K intercalation into graphite was observed in molten salt of KF or KF/AlF3 at 1163 K [17], in which, staging, the most characteristic property of GICs, was evidenced in cyclic voltammetry. Nonetheless, the insertion and extraction processes in this system were disturbed by severe structural damage due to the instability of the K-GICs at this high temperature. K-intercalation has also been investigated in batteries composed of either graphite powder, hard carbon or graphitic carbon together with binders and a non-aqueous K-containing electrolyte such as KClO4 and KPF6 in carbonate esters [18]. Ex situ x-ray diffraction unveiled reversible, sequential formation of GIC stage phases (e.g. KC36, KC24 and KC8) at room temperature [13]. K-diffusion in such layered bulk materials is highly anisotropic and takes place through the abundantly available defect sites and grain boundaries [19]. Hence, it not only proceeds along the basal planes of individual layers but also in the vertical direction. The solid electrolyte interphase (SEI) derived from the mixed active materials also introduced additional disorder and complexity for the K-ion insertion and a real-time study of the intercalation and diffusion process is still lacking.
Here, we monitor in situ K-ion intercalation and diffusion in the single van der Waals gallery of a graphene bilayer using an on-chip peripheral electrochemical cell configuration. The geometry offers a well-defined one-dimensional (1D) diffusion front with access to a single in-plane diffusion pathway only. Complications due to staging, interlayer interaction from bulk materials as well as the formation of an SEI are effectively avoided. Intercalation and extraction are conveniently controlled by tuning the potential differences between the bilayer that acts as the working electrode and the K-based counter electrode.
2. Results and discussion
The device layout and an optical image of an actual device are displayed in figures 1(a) and (b) as well as figure S1 in the supplementary information (SI available online at stacks.iop.org/TDM/9/025020/mmedia). A mechanically exfoliated bilayer flake was placed on top of a silicon substrate covered with 300 nm thick SiO2. The doped silicon substrate served as a back-gate for initial device testing (section S2, SI). The bilayer nature was confirmed by Raman spectroscopy (figure 1(c)). It revealed the characteristic 2D mode composed of four lines. The flake was patterned into an elongated Hall bar shape. Hall voltage probe pairs along the perimeter, a source (right) and drain (left) contact as well as an additional lead, that does not touch the graphene bilayer, were fabricated out of titanium. The source contact only partially covers the bilayer width in order to avoid contact failure due to the repetitive vertical expansion and shrinkage during K intercalation and de-intercalation. K metal was applied to the additional lead within the argon atmosphere of a glovebox and was covered by an electrolyte drop, described in more detail below. It served as counter electrode and K-ion sink (K+ + e− = K, −2.93 V vs E0). By varying the voltage UG between this counter electrode and a graphene terminal potassium intercalation is controlled via the redox reaction (nK+ + ne− + C8 → Kn C8, 0 ⩽ n ⩽ 1). This reaction is the driving force to push potassium ions into the van der Waals gallery. The intercalated potassium ions continue to diffuse within the gallery beyond the electrolyte drop to homogenize the concentration. The small electrolyte coverage of the bilayer surface prevents undesirable disorder, which may deteriorate or alter the intrinsic properties for ion motion within the bilayer. The amount of charge transferred to the graphene layers by the potassium ions is determined at the location of the Hall probe pairs using the classical Hall effect. Its time dependence provides immediate information about the ion diffusion. Instead of using a conventional liquid electrolyte, a gel polymer electrolyte was used to improve sample handling. The gel polymer, composed of a potassium salt and two dimethacrylic oligomers (figure 1(d)), provides good ionic conductivity and proper mechanical strength. The K-ion is the only effective intercalation species, regardless of the chosen anion. Even though potassium salts such as KPF6, KClO4 and potassium bis(fluorosulfonyl)imide have been popularly explored in K batteries [20], here potassium bis(trifluoromethane)-sulfonamide (K-TFSI) was selected, because of the versatile solubility in the gel polymer. Bisphenol A ethoxylate dimethacrylate (BEMA) exhibits long polyethoxy chains, which are beneficial for the formation of a flexible 3D polymer network and fast K-ion diffusion within the polymer matrix. The addition of poly(ethylene glycol) methyl ether methacrylate (PEGMA) improves the viscosity of the mixture, which is crucial for position control during drop casting. It also enhances the overall ionic conductivity. A cross-linking reaction is triggered by a photoinitiator (e.g. 2-hydroxy-2-methylpropiophenone), which releases free radicals upon UV exposure and subsequently initiates free radical polymerization of two oligomers (section S3, SI), producing soft and solid copolymers [21]. The ionic conductivities for different K-TFSI feed ratios were measured with impedance spectroscopy in cells with stainless steel electrodes. The conductivity increased proportional to the K-TFSI concentration. It was varied from 0.1 to 0.5 M. The values ranged from 1.44 × 10⁻⁵ to 6.69 × 10⁻⁵ S cm−1 (figure 1(f) and section S4, SI).
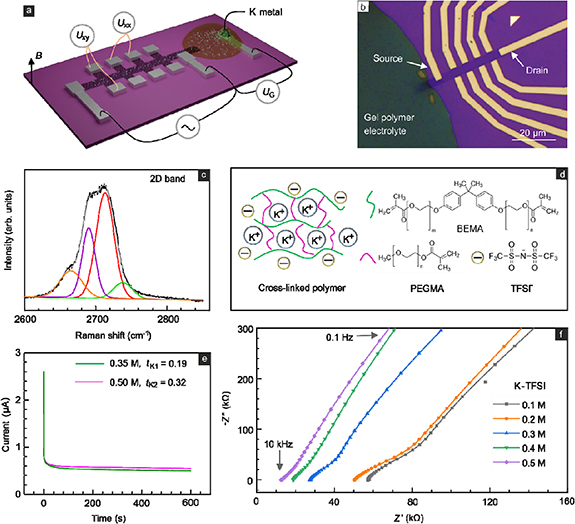
Figure 1. (a) Schematic of the device geometry for device level and on-chip intercalation of potassium. The graphene bilayer (black) is shaped into a Hall bar to probe the Hall voltage (Uxy ) at different locations away from the electrolyte drop as well as the longitudinal voltage (Uxx ) during potassium intercalation and extraction. The galvanic cell is formed by the graphene bilayer as working electrode, K-metal on top of titanium as the counter-electrode and a gel polymer electrolyte drop covering a small portion of the graphene bilayer. (b) Optical micrograph of a typical device geometry. (c) Typical Raman spectrum recorded on the bilayer flake with a blue laser (λ = 488 nm). (d) Chemical composition of the gel polymer electrolyte consisting of potassium salt (K-TFSI) and two cross-linked polymers, PEGMA and BEMA. (e) Chronoamperometry profile of a gel polymer with K-TFSI (0.35 or 0.50 M) and 2 wt % photoinitiator after UV curing. Data were obtained at ambient temperature for a 10 mV dc bias. (f) Impedance spectra of gel polymers with different K-TFSI concentrations (from 0.1 M to 0.5 M) measured across the frequency range from 10 000 Hz to 0.1 Hz in a cell with stainless steel electrodes.
Download figure:
Standard image High-resolution imageNot only the ionic conductivity, but also the K+ transference number (tK) is a critical parameter for intercalation. It is defined as the fraction of the total electrical current carried by K+ ions in the gel electrolyte. A large transference number is beneficial to avoid concentration gradients and, hence, concentration polarization as well as localized changes in the electrolyte properties such as conductivity [22]. It is also indicative for the number of cycles a cell can be put through [23]. Here, this number was measured in a home-made blocking-type cell where the glass fiber membrane and gel electrolyte were sandwiched between two K metal electrodes. Two polymer electrolytes with 0.35 and 0.5 M K-TFSI were examined for comparison. The time-dependent current change during the application of a constant bias potential was recorded until it reached the steady state (figure 1(e)). As anticipated, the interfacial resistances increased after such potentiostatic tests. Impedance spectra recorded before and after potentiostatic measurements are plotted in section S4 (SI). For 0.5 M K-TFSI the transference number (tK) equals 0.32. This value indicates moderate conductivity, nevertheless sufficient for intercalation studies. Note that in liquid electrolytes, t is usually close to 1. In the family of polymer electrolytes, it is typically below 0.5 [24].
The transport properties of the graphene bilayer (device D1) were first measured in the absence of a magnetic field by applying an ac-current I = 100 nA between the source and drain terminals as marked in the optical image of the typical device geometry in figure 1(b) (actual device see figure S6(a), SI). Hall probe pairs are separated by 20 µm and labeled by position coordinates x1 through x4 with x1 being closest to the electrolyte drop. The voltage drop in current direction (Uxx ) was monitored with a lock-in amplifier. Intercalation of K+ was initiated by applying a cell dc voltage UG equal to 0.1 V. The extraction of K+ proceeded at UG = 2 V vs K/K+. As intercalants enter, charge transfer from the 4s level intercalated K+ fills additional states in the graphene bilayer. Apparently, the bilayer is hole doped prior to intercalation, since Rxx develops a high resistance feature with a maximum of 36.4 kΩ reminiscent of the charge neutrality peak in more common field effect data when changing the back-gate voltage (figure 2(a)). Beyond this charge neutrality point conduction band states gradually fill resulting in a drop of Rxx . Here, the magnitude of the initial doping prevents the observation of the charge neutrality peak in a conventional field effect trace as it requires too large back-gate voltages (section S2, SI).
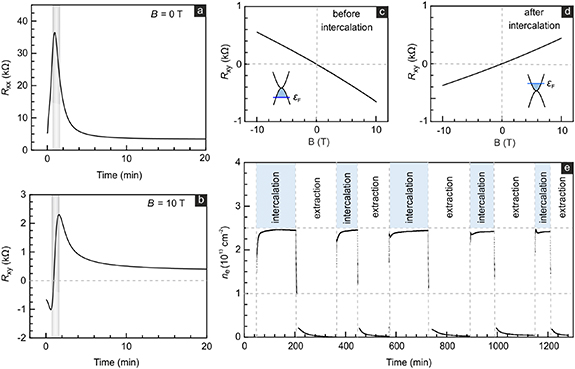
Figure 2. (a) Longitudinal resistance (Rxx ) for B = 0 T of an initially p-doped bilayer graphene device measured during potassium intercalation. (b) Hall resistance (Rxy ) measured at B = 10 T and position x1 during potassium intercalation. (c), (d) Rxy as a function of applied magnetic field before intercalation and at the end of the intercalation, respectively. (e) The electron density induced by charge transfer from the K-ions as extracted from the Hall resistance during multiple intercalation and extraction cycles. All measurements were performed in vacuum (p ⩽ 10−6 mbar) and at 300 K.
Download figure:
Standard image High-resolution imageThe Hall resistance recorded at x1 is plotted in figure 2(c) as a function of the perpendicular magnetic field B and confirms an initial hole doping of nimp (x1, t = 0) = −9.2 × 1012 cm−2. We adopt the convention that negative densities refer to hole densities. Figure 2(b) illustrates the time-dependence of the Hall resistance during intercalation recorded for B = 10 T. The sign reversal signals the transition from hole doping to net electron doping as more potassium ions appear at x1. In the grey shaded region, electrons and holes are simultaneously present due to the disorder induced spatial landscape of electron and hole puddles [25]. In this regime the extraction of the net density is difficult as it requires a two charge carrier model. However, outside of the grey shaded region the electron charge induced by intercalated potassium can be determined from ne(x) = B/eRxy
(x) − nimp(x, t= 0) where, e is the elementary electron charge. Density functional theory estimates a charge transfer from K to graphene of about 0.5 e per K-ion [26], so that the local intercalant density should be approximately equal to nK(x)  2 ne(x). The Hall resistance as a function of B after potassiation is plotted in figure 2(d) and has, as expected, a slope of opposite sign, because the charge carrier type has changed to electrons. The final density equals n =1.54 × 1013 cm−2 corresponding to a total electron density induced by intercalation equal to ne (x1) = 2.46 × 1013 cm−2. Figure 2(e) illustrates the variation of the induced electron density during multiple intercalation and extraction cycles. No data points are included in the regime where the Hall resistance is governed by two charge carrier transport. The maximum electron density only slightly decreases during subsequent cycles. It drops to 98.4% of the original value (i.e. 2.42 × 1013 cm−2) after five cycles. Hence, potassiation is highly reversible. This small decrease may be caused by ions getting trapped at the bilayer boundaries or at internal defects. At the boundary the intercalant may leak out and either evaporate or react with residuals from the environment. The reaction products would be immobilized and pinned. A similar scenario may take place at internal defects of the crystal structure. They too may act as pinning sites where K intercalants get stuck and react with residuals [27]. Such areas are then no longer available for reversible ion storage and charge transfer. In our previous studies of Li intercalation [4, 5], the pile up of reaction products at the boundary and at wrinkles has indeed been experimentally confirmed in secondary ion mass spectrometry experiments. Because a single defect can act as a pinning site, a small number of defects is sufficient to cause an observable reduction in the useable area for reversible storage at higher cycle counts, even though the number of crystal defects may remain undetectable by Raman spectroscopy.
It has been implicitly assumed that K-diffusion takes place within the van der Waals gallery. In principle, diffusion may also occur on the bilayer surface or between the SiO2-substrate and the bottom graphene layer. Hall measurements would not be able to distinguish these alternative diffusion pathways. In order to exclude these, in situ time-resolved Hall measurements were also performed on a monolayer device (section S5, SI). Contrary to bilayer devices, such a monolayer device did not show any change in the Hall voltage when initiating the intercalation process. As a result, K diffusion at the graphene/SiO2-heterointerface and on the top surface of the bilayer can be excluded. Among potassium-based graphite intercalated compounds, the highest achievable K content occurs for stage-1 KC8 [28]. The staging index refers to the number of graphene layers sandwiched between adjacent intercalant layers. However, in our case, staging is not applicable, since all K+ ions are restricted to a single gallery and the stoichiometry should be expressed as C8K2y C8 with y varying between 0 and 0.5 depending on the intercalation degree. For a completely potassiated bilayer (C8KC8), the ions occupy a 2 × 2 superlattice with a two-dimensional triangular close-packed structure and a lattice constant of 4.92 Å (section S6, SI). This stoichiometry would correspond to a maximum ion density nK = 4.77 × 1014 cm−2 [7]. Since the charge transfer is only 0.5 e, the maximum intercalation induced electron density would correspond to 2.38 × 1014 cm−2 or one order of magnitude higher than the experimentally measured value. Note that the detected charge carrier density only reflects the amount of potassium that has actually entered in the van der Waals gallery. These results are unable to identify difficulties with the insertion of the large K-ions in the area where the electrolyte overlaps with the graphene bilayer itself. This can be an issue for these room temperature experiments in view of the large discrepancy between the theoretical storage limit and the achieved stored K-amount. Contrary to previously explored experimental configurations, the device design ensures a well-defined 1D diffusion front that moves downstream away from the electrolyte drop along the elongated direction of the device. This however also implies that there are fewer possibilities for intercalants to enter and circumvent potentially blocked areas.
Similar experimental data were also recorded for other Hall pair probes at positions x2, x3 and x4 located further away from the drop. They are contained in section S7 of the SI. The maximum density drops along the device and equals 2.1 × 10¹³, 1.4 × 10¹³ and 1.3 × 1013 cm−2 at x2, x3 and x4, respectively. This suggests that K-diffusion over extended distances is more difficult. Local blockages and pinning will continue to affect the ion transport further downstream, since the insertion only takes place at one end of the bilayer. We also note that due to its flexibility in the third direction bilayer graphene will conform to the topography of the supporting substrate. Surface corrugations or adsorbents that locally deform the bilayer cause local strain variations and will also locally modify the interlayer spacing which can have an impact on the ion mobility. This may hinder the diffusion more and more along the elongated device geometry. The time dependent Hall resistance data at different locations can be converted to the potassium density assuming a charge transfer of 0.5 e per K-ion. This data can then be used to determine the diffusion kinetics by solving Fick's second law:
This exercise was carried out for a second device (D2, figure 3(a)) with three Hall pair probes, each 10 µm apart, and a lower initial hole doping nimp = −1.8 × 1012 cm−2 in order to reduce the electron–hole puddle regime (section S9, SI). Hall pair probes are labeled x1 (closest to the electrolyte drop) through x3 and the drain electrode, also 10 µm away from the last Hall probe pair, is at position xend. Intercalation is triggered by potentiostatic polarization with 0.1 V vs K+/K followed by K diffusion along the device. Figure 3(b) plots the extracted time-dependent densities nK (x, t) at x1 = 0, x2 = 10 µm, x3 = 20 µm during the second potassiation cycle. Data points are plotted up to ∼1013 cm−2. Equation (1) was solved numerically following the approach outlined in section S8 (SI) and using the time-dependent density nK (x = x1 = 0, t) measured next to the electrolyte as the first boundary condition. This avoids having to deal with the SEI and/or insertion barriers. They do not matter. This is analogous to a four point resistance measurement that avoids contact resistances. For the second boundary condition we can use ∂nK (x= xend, t)/∂x =0, since the drain electrode blocks ion diffusion. The diffusion coefficient Dδ remains as the only fit parameter. While the K-density systematically decreases further away from the electrolyte drop, as anticipated for diffusive motion, the time dependencies are dissimilar and difficult to fit with equation (1) over a longer time interval. The use of this 1D equation assumes that layer spacing and useable sample cross-section are equal across the entire sample and remain identical over time. This is however an idealized case. The previously described ion pinning and reactions with residual at defects, wrinkles and crystal boundaries as well as the inevitable local variations of the layer spacing locally reduces the sample cross-section for diffusion with time or hinder the diffusion. This obviously complicates an analysis of the diffusion kinetics. Therefore, only a rough, lower estimate of the diffusion coefficient can be obtained by restricting the analysis to a short time interval. For instance between 60 and 80 s we obtain Dδ = (1.4 ± 0.3) × 10−7 cm2 s−1. This is much greater than what has been reported previously for graphite [29], graphitic carbon [30], hard carbon [31] and layered metal oxides [32] for which the diffusion coefficients ranged from 10−12 to 10−8 cm2 s−1. Note that the extraction of the diffusion coefficient using conventional coin batteries cannot distinguish insertion barriers for instance at the SEI from the diffusion process. In our sample configuration where the time dependence of the density at the Hall probe pair closest to the electrolyte drop serves as initial boundary condition, the insertion itself as well as any SEI issues take place elsewhere and therefore do not skew the extraction of the diffusion coefficient. In coin batteries both in-plane as well as out-of-plane diffusion play a role which in view of the strong anisotropy is a plausible explanation for a lower overall diffusion coefficient. The observed enhancement of the diffusion of potassium in an isolated graphene bilayer here is similar to the previously reported large enhancement of lithium diffusion obtained in a similar device configuration with a single gallery [4]. We note that enhanced diffusion of potassium can be achieved in larger angstrom scale slits [33]. It may even surpass that of lithium [4]. Varying the interlayer spacing therefore represents a powerful knob to tune ion transport.
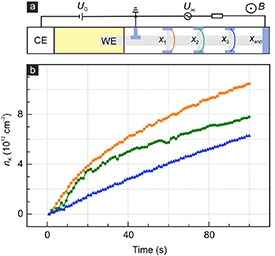
Figure 3. (a) Schematic of the device used for measuring the time and position dependent K-density during intercalation in an attempt to extract the diffusion coefficient. The devices consists of a working electrode (WE), polymer electrolyte (yellow area) and a patterned graphene bilayer (gray area). The Hall probe pairs are connected in the same color as the corresponding data set in panel (b). (b) The time-dependent K concentration (nK) extracted from Hall measurements at B = 10 T and T = 300 K at positions x1, x2 and x3 (yellow, green and blue).
Download figure:
Standard image High-resolution imageRaman spectroscopy has been frequently used in the past to monitor the intercalation of guest species, such as lithium [34] and iron(III) chloride [7], into graphitic hosts especially few-layer graphene, because the lattice vibrational modes of carbon atoms are susceptible to doping and tiny structural changes in this low-dimensional system. Raman spectroscopy was performed here as well on a separate device (D3) before and after intercalation at different locations along the sample (figure 4 and section S10, SI). These positions are labeled xR0 through xR4 in the optical microscope image in the inset to figure 4(d). Given that the gel electrolyte has strong background signal using 488 or 532 nm laser excitation, a 633 nm laser beam was used instead and focused to a spot size with a diameter of less than 1 µm. Figures 4(a) and (b) display Raman data in the spectral range of the G and 2D bands, respectively [35]. The trace at xR0 was recorded prior to intercalation, the others after intercalation. The full spectra can be found in section S10. The D band at approx. 1300 cm−1 is not visible in any of the curves, suggesting a negligible number of lattice defects. Before K intercalation, the G band is centered at 1570 cm−1, but after intercalation shifts to higher wavenumber: 1583 cm−1 (xR1), 1578 cm−1 (xR2), 1574 cm−1 (xR3), and 1572 cm−1 (xR4). Likewise, the 2D band also shifts toward higher wavenumber at the positions of xR1, xR2, xR3 and xR4.

Figure 4. (a) Raman G band of bilayer graphene measured after K intercalation at the locations xR1, xR2, xR3 and xR4 marked in the optical image of the device in panel (d). The bottom trace at xR0 was recorded prior to intercalation. (b) Same as in (a) but for the 2D Raman band. (c) Summary of the G and 2D peak shift after intercalation. The xR0 data points serve as reference as they were recorded prior to intercalation. (d) The intensity ratio of the 2D band to G band. The inset shows the optical image of the device and the locations where measurements were taken. The excitation laser wavelength is λ = 633 nm. The dashed lines in panels (a) and (b) (except for xR0 in panel (b)) are single-Lorentzian fits to the signal.
Download figure:
Standard image High-resolution image
Figure 4(c) summarizes these changes of the Raman G-band and 2D-band frequency. The shift is larger closer to the electrolyte drop and is a result of the stiffening of the E2g-phonon mode with doping consistent with other reports of the doping dependence of the G band up to of 3 × 1013 cm−2, irrespective of the doping type [36]. The G-band can be fitted to a single Lorentzian, although an unexpected shoulder feature appears in the spectra at xR3 and xR4. Its origin is unclear and we cannot exclude the presence of local surface contaminants there. The blue shift of the 2D band is attributed to electron doping for concentrations lower than 1.5 × 1013 cm−2 [37]. The ratio of the integrated intensity of the 2D and the G band (I2D/IG) is an alternative quantity providing information about the carrier density [38]. This ratio is plotted as a function of position in figure 4(d). Closest to the electrolyte drop this ratio is smallest as anticipated. This reflects the gradient in the K density also observed in the Hall measurements. When potassium ions are inserted between the two graphene sheets, the interlayer distance is expected to expand from 3.35 Å to 5.40 Å for C8KC8 [39]. This expansion should be accompanied by a reduction of the interlayer interaction and coupling. In principle, this should modify the shape of the 2D Raman band, since the band structure changes with layer number. The 2D band of a Bernal stacked bilayer is composed of four Lorentzians, whereas the 2D band of monolayer graphene is described by a single Lorentzian [40]. In our experiments the 2D band mainly weakens in strength, but remains broad and a clear identification of the number of contributing lines at the highest intercalation degree is difficult. The amount of intercalated potassium in our work corresponds to about 10% of the theoretical limit. This intercalated potassium is presumably distributed in a random fashion. The intercalants will only locally alter the distance between the carbon atoms of the two layers. The confocal Raman spectroscopy probes an area with a diameter of about 1 µm of which the largest part remains unaffected by the intercalants. Hence, in view of these circumstances, neither a decoupling of the graphene layers nor a clear transition of the Raman spectrum from multi-mode to single mode can be expected. Indeed, neither is observed. For the sake of completeness, we note that a recent report demonstrated a complete decoupling of bilayer graphene achieved through thermal vapor intercalation of metal chlorides (for instance, CuCl2, AlCl3 and FeCl3) [41]. Given that potassium exhibits a similar diameter as these metal chlorides, the scenario of full decoupling of the two graphene sheets is conceivable when the theoretical limit of potassium intercalation is approached.
In summary, we have successively demonstrated electrochemistry driven intercalation of potassium in the single van der Waals gallery of bilayer graphene with a peripheral on-chip galvanic cell. The charge transfer was monitored as a function of time with the classical Hall effect. A maximum intercalant density of about 4.8 × 1013 cm−2 was observed. To account for the experimental results a diffusion coefficient with a value of at least 1.4 × 10⁻⁷ cm2 s−1 is required.
Acknowledgments
We thank Faxing Wang and Panpan Zhang (TU Dresden) for impedance measurements, Nils Gross for assistance with graphics, and Fangdong Tang, Daniela Tabrea and Dong Zhao for helpful discussions. J H S also acknowledges financial support from the EU graphene flagship core 3 program and the DFG (SPP 2244).
Data availability statement
The data that support the findings of this study are available upon reasonable request from the authors.