
Abstract
Coupled nanomechanical resonators are interesting for both fundamental studies and practical applications as they offer rich and tunable oscillation dynamics. At present, the mechanical coupling in such systems is often mediated by a fixed geometry, such as a joint clamping point of the resonators or a displacement-dependent force. Here we show a graphene-integrated electromechanical system consisting of two physically separated mechanical resonators—a hybrid graphene comb-drive actuator system and a suspended silicon beam—that are tunably coupled by the integrated graphene membrane. The graphene membrane, moreover, provides a sensitive electrical read-out for the two resonating systems showing 16 different modes in the frequency range from 0.4 to 24 MHz. In addition, by pulling on the graphene membrane with an electrostatic potential applied to silicon beam resonator, we control the mechanical coupling, quantified by the g-factor, from 20 kHz to 100 kHz. Our results pave the way for coupled nanoelectromechanical systems requiring controllable mechanically coupled resonators.
Export citation and abstract BibTeX RIS

Original content from this work may be used under the terms of the Creative Commons Attribution 4.0 license. Any further distribution of this work must maintain attribution to the author(s) and the title of the work, journal citation and DOI.
1. Introduction
Resonating silicon-based micro- and nanoelectromechanical systems can operate over a wide range of frequencies, varying from the kHz to the GHz regime, very much depending on the applications. This includes high-quality-factor band pass filters [1–3], signal amplifiers [4, 5], high-precision sensors (incl. biosensors) [6], or even logic gates [7]. Moreover, mechanically coupled resonators have attracted increasing attention thanks to their interesting dynamics [8–11], improved performance and advanced tunability compared to single resonators [12]. The mechanical coupling between different resonators can be well-designed [13] and can be used e.g. as low-noise signal amplifier [14]. Yet, up to now, the coupling is mediated by a fixed geometric contact or clamping between the mechanical resonators or a position-dependent force, which limits the control over the coupling [8, 9, 15, 16]. The implementation of an integrated and independent control of the mechanical coupling is still a major technological challenge. This is mainly a consequence of the missing frequency tunability of the individual mechanical resonators and their weak vibration coupling [8].
Graphene-integrated nano-electromechanical systems are promising candidates for overcoming these limitations of silicon-based micro-electromechanical systems (MEMS). Graphene, an atomically thin crystal of carbon atoms, features a high mechanical strength [17, 18], an unprecedented high carrier mobility [19], and an highly sensitive electrical read-out scheme for its mechanical motion [20–22]. Moreover, the low mass density and the high Young's modulus [17, 23] make graphene interesting for resonator based sensor applications [24], for example as force [25–27], ultrasound [28–31] or pressure sensors [32]. There is also a growing interest to implement graphene as a mechanical element in silicon MEMS devices such as accelerometers [33, 34], since their high flexiblity allows for a considerable down-scaling of the device footprint while maintaining high sensitivity. These prototype demonstrations show that graphene is an interesting candidate for the integration in MEMS as a motion sensor. Despite its high flexibility and the large tuning range of stiffness, the implementation of graphene as a tunable spring and mechanical coupler in silicon based MEMS devices has up to now not been demonstrated.
Here we show that a suspended graphene membrane can be used to uniquely couple two physically separated mechanical resonators; a hybrid graphene comb-drive actuator system and a suspended silicon beam. Crucially, the graphene membrane simultaneously provides a unique electrical read-out scheme for the motion of both of these resonators. Without the graphene membrane, we would not be able to measure the motion of the hybrid-MEMS device. The mechanical coupling between the resonators, mediated by the graphene membrane, can be tuned over a wide range by an electrostatic potential, realizing a controlled, substantially enhanced coupling, when compared to systems without integrated membranes [8].
2. Results and discussion
The device was fabricated by an electron-beam lithography (EBL) based structuring of a Cr/Au/Cr hard mask on a silicon-on-insulator substrate consisting of 725 µm silicon, 1 µm SiO and 2 µm highly p-doped silicon followed by a deep reactive ion etching (DRIE) step, as described in detail in [35, 36] and in the supplementary note 1 (available online at stacks.iop.org/2DM/8/035039/mmedia). The silicon beam (SB), which also operates as a bottom electrostatic gate for tuning the graphene membrane, was fabricated by interrupting the DRIE step after etching 275 nm deep followed by the deposition of an additional Cr mask before etching completely through the highly p-doped silicon layer. After removal of the Cr layer, a graphene/PMMA stack is transferred on the patterned comb-drive (CD) actuator. Confocal Raman spectroscopy confirms the single-layer nature of the graphene flake (supplementary figure 1). By an additional EBL step we partly cross-link the PMMA to clamp the graphene membrane [37] onto the actuator on one side and to a fixed anchor on the other side (figures 1(a)–(d)). Finally, the actuator with the integrated graphene membrane is released from the substrate by removing the SiO
 layer with 10% hydrofluoric (HF) acid solution followed by a critical point drying (CPD) step. In the measurements presented here, the suspended graphene membrane has a length of L ≈ 2 µm and a width of W ≈ 3 µm (supplementary figure 1). During sample fabrication, no measures were taken to eliminate buckling or ripples, nor did we take any special measures to prevent the unlikely but possible sagging of the membrane during cooling (see supplementary note 1). All measurements were performed on the graphene-CD device shown in supplementary figure 1 in a 3He/4He dilution refrigerator with a base temperature around 20 mK, unless otherwise stated.

Figure 1. (a) Top view scanning electron microscope (SEM) image of a comb-drive (CD) actuator device. The suspended part of the CD actuator is held by four springs (blue arrows). (b) Illustration of an actuator device with integrated graphene (blue) clamped by cross-linked PMMA (yellow) and electrical contacts. The potential  generates an electrostatic force
  in the direction of the white arrow. The potential
  tunes the charge carrier density in the suspended graphene membrane and
  is the applied bias, which results in a down-mixing current
  (see text). (c) False-color SEM image (taken under an angle) of a different device with an integrated clamped graphene membrane (light blue). The close-up the corresponding area marked by the dashed box in panel a. (d) Schematic cross-sectional view of the device, highlighting the graphene membrane the suspended silicon beam (SB) and the CD actuator. (e) A simplified electrical circuit diagram of the nanoelectromechanical device. (f)
  as a function of ω/2π showing sixteen mechanical resonances. This data was recorded at a temperature of ∼2.3 K and at a low 4He pressure (1 mbar). (g) Close-ups of the data in panel (f) around the main resonances: I (1.48 MHz), II (5.14 MHz) and III (11.44 MHz). The yellow dashed lines are fits to the data.
Download figure:
Standard image High-resolution imageFigures 1(b) and (e) depicts the electrical scheme of the measured device. A potential difference  between the asymmetrically placed fingers of the CD actuator gives rise to an electrostatic force,
  that pulls the suspended comb in the x-direction (see figure 1(d)) and white arrow in figure 1(b). Here, the capacitance
  and
and  are given by the zeroth and the first order term in the displacement δx of the actuator in a series expansion of the parallel plate approximation for the capacitance between its fingers [35].
To measure the resonance frequencies of the device, we employ an amplitude-modulated down-mixing scheme [38]. In this scheme, an AC potential  applied on the suspended SB at frequency ω/2π supplies an external drive force acting on the suspended graphene membrane. Experimental details on the used equipment, applied potentials and frequencies is provided in supplementary figure 2. The mechanical displacement of the graphene δz perpendicular to the membrane plane (z-direction, see figure 1(d) at frequency ω/2π modulates the capacitance
  . Note that other (in-plane) displacement directions do not modulate the conductance G and thus do not contribute to the signal [20]. Both the varying potential
  on the SB and δz cause a modulation of the conductance G of the suspended graphene membrane at frequency ω/2π. As the resonance frequency of suspended graphene membranes is usually in the MHz range [39–41], a drain-source bias
  is applied at a slightly different frequency (ω ± Δω)/2π, with Δω in the low kHz regime. This results in a total current through the graphene membrane
  containing a component
  passing the graphene membrane at a low, measurable frequency Δω/2π [38]:

where  is the applied DC potential on the SB acting as gate, and
  is the transconductance. The measured conductance and transconduction as function of
  is shown in supplementary figure 3. The capacitance
  fF and
  nF m−1 are given by the zeroth and the first order term in δz of an analytical series expansion of the parallel plate approximation for the capacitance between the suspended SB and the graphene membrane.
To extract the resonance frequencies of the device, we measure  as a function of ω/2π. The mechanical resonances are observed as dips and peaks in
  (see figure 1(f)). We observe in total sixteen resonances in the range from 0.4 to 24 MHz. In this work, we focus on the three resonances (labelled as I, II, and III) with the largest amplitude. Corresponding close-ups are shown in figure 1(g). We fit the resonances with a nonzero-phase Lorentzian [38] to extract the resonance frequency ω0/2π, the quality factor Q, and the effective drive amplitude A.
To understand the physical origin of the different resonances, we extract the effective masses and spring constants of the resonances from the tuning of the resonance frequencies with applied electrostatic potentials. Here, we slowly sweep the DC voltages up to a value  , then sweep to
  and then back to 0 V, similarly as in [35]. As we did not see any hysteresis in the measurement presented here, we conclude that slipping at side walls and or clamping points does not play any role. Figure 2(a) shows the measured down-mixed current as a function of
  for
for  V. From such data, we extract the dependencies of the resonance frequencies on the applied potentials. Figures 2(b)–(d) show the dependencies of resonances I, II, and III on
  (blue) and
  (red). The dependencies are slightly asymmetric in
  and
and  due to residual charges on the graphene and the CD actuator. Resonances I and III tune towards lower frequencies for increasing
  , whereas resonance II tunes towards lower frequencies for increasing
  . The tuning towards lower frequencies for increasing
  or
or  suggests a dominating capacitive softening effect [42–45]. Therefore, we fit the tuning of ω0 with [38]
where k0 is the effective spring constant,  is the effective mass,
  mF m
mF m characterizes the capacitive softening of the actuator capacitance, and
  mF m
mF m characterizes the capacitive softening of the graphene-SB capacitance
  (see figure 1(e)). Here,
  denotes the second order term in δx(z) of an analytical series expansion of the parallel plate approximation for
  . The fit results for the resonances I, II, and III are depicted by black lines in the lower panels of figures 2(b)–(d). The fit parameters are summarized in supplementary table 1. Resonances I and II have an effective mass
  of 1.75 ± 0.02 ng and 0.56 ± 0.01 ng, respectively, and that of resonance III is 0.065 ± 0.001 ng. We confirmed the extracted values for
  (and k0) with a second independent measurement, in which we extracted the effective drive amplitude A as a function of the driving force [38, 46]
  by varying
  for a fixed
  and
and  (supplementary figure 4). In this measurement, the measured transconductance
  (supplementary figure 3), in combination with the applied potentials and the estimated capacitances allows us to quantitatively extract the physical vibration amplitudes A contained in δz. The effective masses for our device are at least three orders of magnitude larger than the ones typically observed for graphene resonators [38], indicating that the graphene mass is irrelevant for the total device.
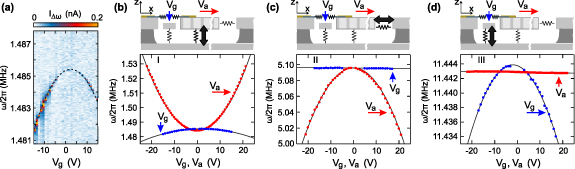
Figure 2. (a) Down-mixing current  as a function of ω/2π and
  (raw data) the dashed line highlights the resonance frequency. ((b)–(d) bottom) Frequency dependence of the resonances I, II, and III on the applied potentials
  (blue) and
  (red). All
  -dependent measurements were recorded with
  V. The
  -dependent measurements in (b)–(d) were recorded with
  , and −8 V, respectively. The black lines are quadratic fits in accordance to the applied electrostatic force (see text). ((b)–(d) top) Schematic illustrations of the mechanical system. The black arrows indicate the main vibrating component of the corresponding resonance. The red and blue arrow indicate the direction of the force induced by
  and
and  , respectively.
Download figure:
Standard image High-resolution imageThe effective masses of resonances I and II are comparable to the estimated mass of the CD actuator when taking a density of 2329 kg m13 for the highly p-doped silicon leading to  ng, in good agreement with the effective mass extracted from resonance I. The effective mass extracted from resonance II is roughly one-third of
  , which can be explained by the effective mass reduction for a doubly clamped beam [47] in its fundamental mode and thus highlights the importance of the mode shape. The effective mass
  extracted from resonance III is approximately equal to the estimated mass of the suspended silicon beam,
  ng. This suggests that the observed resonances can be attributed to resonances of the actuator and of the silicon beam, and not to the mechanical motion of the graphene membrane.
To verify the origin of the resonances and to clarify the mode shapes, we performed finite element calculations [48]. It is important to include the suspended graphene membrane in the simulations for two reasons: (a) we can only measure modes with an oscillation of the graphene membrane in the z-direction (see equation (1)) and (b) the spring constant ∼6.7 N m−1 of the silicon actuator in the x-direction is much smaller than the expected spring constant  = 510 N m−1 of the graphene membrane. Here we used the literature value
  N m−1 for the two-dimensional Young's modulus of graphene that is expected at cryogenic temperatures [17, 49, 50]. The highly p-doped silicon has a Young's modulus of ≈160 GPa [51, 52]. We find excellent agreement between all the measured and computed resonance frequencies: the ratio between them is on average 1.04 ± 0.06 (see supplementary table 2). The top panels in figures 2(b)–(d) schematically illustrate the main vibrating components for resonances I, II, and III. We find that resonances I and II correspond to an out-of-plane and in-plane motion of the CD actuator. Resonance III is an out-of-plane mode of the silicon beam, which is supported by the absence of any tunability with
  . Details of all computed frequencies and mode shapes are provided in supplementary table 2 (and supplementary figure 5). The computed mode shapes are consistent with the observed capacitive softening. In total we directly detect sixteen mechanical resonances of the CD actuator and one of the suspended silicon beam. As the observed frequency-tuning is in agreement with capacitive softening, we can use the extracted effective spring constants to determine the static displacements δx and δz. We compute these displacements by dividing the electrostatic forces
  and
and  by the spring constant of the lowest in-plane and out-of-plane mode, respectively (supplementary figure 6). The in-plane displacement δx goes up to 3 nm and is in agreement with the related strain values extracted by Raman spectroscopy measurements on similar devices [35].
To understand the increase of resonance I with applied  in figure 2(b), we now focus on the graphene membrane. As illustrated in the top panel of figure 2(b), resonance I is dominated by a spring along the z-direction, i.e. by an out-of-plane motion of the CD. Both the actuator and the graphene contribute to this spring. The contribution of the graphene membrane is highly sensitive to the induced strain Δε, and thus to a δx displacement, as it changes the pretension in the membrane [53, 54]. The total spring constant, the in-plane displacement of the actuator as well as the dimensions of the graphene membrane are known. Hence, the only free parameter is the Young's modulus of the graphene membrane (see section 3). Requiring the same in-plane actuator displacement for tuning resonance I as for resonance II, we obtain an effective Young's modulus of
  N m−1 (see section 3 and supplementary figure 6). The extracted Young's modulus agrees well with values reported in the literature [17, 49] and supports the used value in the finite element calculations above. Remarkably, the extracted Young's modulus indicates that buckling, ripples and possible sagging of the graphene membrane due to the negative thermal expansion coefficient when cooling down have no effect in the presented measurements at 20 mK. This also agrees with work reported in the literature [39, 50]. The type of analysis here thus gives us a complete understanding of the mechanical behavior of the system.
Let us next focus on the resonance III attributed to the suspended silicon beam. When measuring this resonance as a function of  and
and  , we observe the emergence of avoided crossings, which is a clear signature for two strongly coupled modes. Figures 3(a) and (b) show the down-mixing current as function of
  for various
  values (separated by dashed lines). We fit these measurements to extract the resonance frequency as function of
  for various
  values, which are plotted in figure 3(c). Remarkably, we only observe both interacting modes at the avoided crossings. This suggests that the graphene membrane has no measurable motion in the z-direction for the mode with which the silicon beam is interacting. However, we can reconstruct the dependence of the mode with which the silicon beam is interacting by tracing the position of the avoided crossing as a function of
  , as indicated by the black dashed parabola in figure 3(c) (for more data see supplementary figure 7). The computed resonance frequency spectrum of the CD actuator shows a twist mode close to the one of the suspended SB with negligible net graphene motion (displacement) in z-direction. We thus attribute the avoided crossing to a strong coupling between the silicon beam and the twist mode of the CD actuator (see illustration in figure 3(d).

Figure 3. (a), (b) Raw data of the down-mixing current  as a function of ω/2π and
  for different fixed
  (black labels) reveal avoided crossings. Different measurements are stitched together at the dotted lines. (c) The colored lines indicate the extracted resonance frequencies for different fixed
  (black labels). The dashed black line traces the dependence of the avoided crossings on
  . (d) Schematic illustration highlighting the two interacting modes.
Download figure:
Standard image High-resolution imageWe extract the coupling strength between the modes, i.e. the so-called g-factor [11],  from each individual avoided crossing by taking the minimal distance between the two modes along the frequency axis (see close-ups in figures 4(a) and (b). The linewidth Γ = ω0/2πQ was computed from the extracted resonance frequencies and Q-factors obtained by fitting two non-zero phase Lorentzians to the data. Figure 4(c) shows that the strong coupling (
 ) between the modes is tunable with applied
  , i.e. by the electrostatic force between the silicon beam and the graphene membrane [11]. Figure 5(a) shows Γ as function of
  highlighting that both modes fully hybridize with equal energy transfer between them [12], which is another sign of strong coupling. The linewidth comparison was performed on the data at
  V, which show the twist mode nearly over the full
  -range. The observed g-factor is in agreement with the coupling expected from the electrostatic softening between the silicon beam and the graphene membrane, as shown in figure 5(b). Both the motion of (a) the silicon beam and (b) the graphene membrane alter their separation, resulting not only in a shift of the resonance frequency, i.e. the well-known electrostatic softening [38], but also in a change of the coupling between the two resonators. Following equation (2), this coupling can be characterized by an effective spring constant
  (figures 5(b) and (c)). Please note that for a non-vanishing effective spring constant (
 ) it is crucial that the graphene flake has been placed asymmetrically with respect to the twist axis (see supplementary figure 1 and figure 1(c)). The g-factor can be estimated by
  . Here, the effective mass
  is the one of the hybridized modes. As the mass of the suspended silicon beam is much smaller than that of the twist mode, we set
  equal to the mass
  of the actuator. When using the estimated mass of the actuator (
 ng) for
  as well as the value for
  mF m
mF m given above, we find a remarkably good agreement with the experimentally extracted g-factor and the computed one (see dashed line in figure 4(c)). Thus, the suspended graphene membrane allows for a strong coupling between two physically separated resonators, and even allows for the tuning of this coupling by an applied voltage.
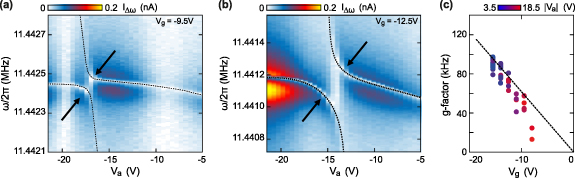
Figure 4. (a), (b) Zoom of avoided crossings. The g-factor is proportional to the minimal distance between the resonance lines (dashed black lines). (c) The g-factor extracted from the avoided crossings as a function of  reveals a tunable mode coupling. The dashed black line is the g-factor arising from the electrostatic force.
Download figure:
Standard image High-resolution image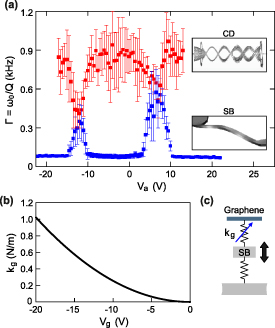
Figure 5. (a) Linewidths Γ = ω0/Q of the interacting modes at  V. The linewidths of the two modes (see insets and supplementary figure 5) become equal near the avoided crossing. (b) The tunable electrostatic softening spring
  as a function of
  . (c) Schematic illustration showing how
  connects the graphene membrane (coupled to the MEMS actuator) to the suspended silicon beam.
Download figure:
Standard image High-resolution image
In summary, by taking advantage of the high sensitivity of graphene resonators, we implement and quantitatively validate a new coupling scheme for nano-electromechanical systems. The coupling strength can be tuned from 20 kHz to 100 kHz and theoretically be completely switched off by an electrostatic potential. We thus realise a maximal coupling of almost 1000 times larger than in systems without any integrated graphene membranes [8] and approximately equal to that obtained for spatially separated graphene resonators [9]. The resonators themselves are not affected by the light-weighted graphene membrane. This coupling scheme is on-chip, poses no restrictions on the choice of material for the connected masses. It is possibly scalable by means of integrated graphene obtained via chemical vapour deposition, and can be possibly extended using other conducting two-dimensional materials instead. The presented technique provides a platform to study the route to chaos in nonlinear dynamics by systematically measuring the orbit diagram [55]. Additionally, the presented scheme enables one to switch on and off the mechanical coupling, giving rise to read-out schemes for quantum states at a well defined time instant with minimal back-action effects at other times.
3. Materials and methods
3.1. Young's modulus extraction
The effective spring constant  is given by the one of the actuator in parallel to the out-of-plane stiffness of the graphene membrane. The out-of-plane stiffness of the graphene membrane depends on the pre-strain ε0 [38]. For a fixed
  , we find a direct relation between the strain induced by the actuator Δε and the change of the out-of-plane spring constant Δk of the graphene membrane:
Here, W (L) is the width (length) of the suspended graphene membrane. Note that we neglect the increase in strain by pulling upon the graphene with  for two reasons: Firstly,
  is constant, and secondly, the in-plane spring constant of the CD actuator (∼6.7 N m−1) is much smaller than the expected in-plane spring constant of the graphene membrance (∼540 N m−1), thereby minimising the strain induced with
  . We extract Δk and Δε experimentally and determine W and L from optical and scanning electron microscope images, which leaves
  as the only free parameter. We extract δx from the in-plane modes of the CD actuator. The induced strain is then simply Δε = δx/L. We then determine Δk from the observed increase in resonance frequency of the out-of-plane mode:
In supplementary figure 6, we plot 3LΔk/16W as a function of Δε, such that the slope is directly providing  .
.
Data availability statement
The data that support the findings of this study are available upon reasonable request from the authors.
Acknowledgments
The authors thank F Haupt for help on the manuscript, R Dolleman and M Siskins for proof-reading, and S Staacks for help on the figures. Support by the ERC (GA-Nr. 280140), the Helmholtz Nanoelectronic Facility (HNF) [56] at the Forschungszentrum Jülich, and the Deutsche Forschungsgemeinschaft (DFG) (STA 1146/12-1) are gratefully acknowledged. G V acknowledges funding by the Excellence Initiative of the German federal and state governments.
Conflict of interests
The authors declare that there are no competing interests.
Contributions
G V and M G executed the experiments. G V designed the experiments and analysed the data. M G, J S, and T K fabricated the devices. Nvd D and D B provided support in device fabrication. C S supervised the overall project. All authors contributed to writing and reviewing the paper.