
Abstract
Chromium triiodide, CrI3, is emerging as a promising magnetic two-dimensional semiconductor where spins are ferromagnetically aligned within a single layer. Potential applications in spintronics arise from an antiferromagnetic ordering between adjacent layers that gives rise to spin filtering and a large magnetoresistance in tunnelling devices. This key feature appears only in thin multilayers and it is not inherited from bulk crystals, where instead neighbouring layers share the same ferromagnetic spin orientation. This discrepancy between bulk and thin samples is unexpected, as magnetic ordering between layers arises from exchange interactions that are local in nature and should not depend strongly on thickness. Here we solve this controversy and show through polarization resolved Raman spectroscopy that thin multilayers do not undergo a structural phase transition typical of bulk crystals. As a consequence, a different stacking pattern is present in thin and bulk samples at the temperatures at which magnetism sets in and, according to previous first-principles simulations, this results in a different interlayer magnetic ordering. Our experimental findings provide evidence for the strong interplay between stacking order and magnetism in CrI3, opening interesting perspectives to design the magnetic state of van der Waals multilayers.
Export citation and abstract BibTeX RIS

Original content from this work may be used under the terms of the Creative Commons Attribution 3.0 licence. Any further distribution of this work must maintain attribution to the author(s) and the title of the work, journal citation and DOI.
The discovery of magnetic order [1, 2] has disclosed novel opportunities in the field of two dimensional (2D) van der Waals crystals and heterostructures [3–5]. In many cases [2, 6, 7], the magnetic configuration of thin layers is the same as in the 3D parent compounds, although possibly with a reduced critical temperature owing to the larger sensitivity of 2D magnets to thermal fluctuations. This is expected as the intra- and inter-layer exchange interactions that determine the ground-state magnetic configuration are typically local and do not change significantly when thinning down the material.
A surprising exception is represented by chromium triiodide, CrI3, a van der Waals material that in its bulk form shows ferromagnetic (FM) ordering both within and between layers below a critical temperature  K [8, 9]. Recently, a multitude of experiments, ranging from magneto-optical Kerr effect measurements [1, 10] to tunnelling magnetotransport [10–13] and scanning magnetometry [14], have shown unarguably that instead thin samples up to at least ∼10 layers display an antiferromagnetic (AFM) interlayer exchange coupling between the FM layers. The AFM ordering can be manipulated through external electric fields [15] or doping [16] and it is responsible for a spin-filtering effect on electrons tunnelling through CrI3 barriers, giving rise to a record-high magnetoresistance [10–13] with potential application in spin transistors [17, 18].
In an attempt to clarify this unexpected change in magnetic ordering from bulk to few layers, most theoretical investigations have focused on the presence of a structural phase transition in bulk CrI3 at about 200–220 K [8, 19]. Across this transition, the structure evolves from a high-temperature monoclinic phase (figure 1(a), space group C2/m) to a rhombohedral structure (figure 1(b), space group  ) at low temperature, with the main distinction between the two phases being a different stacking order of the layers. First-principles simulations in [12], corroborated by additional theoretical investigations [20–24], have shown that the interlayer exchange coupling is FM in the rhombohedral phase (in agreement with experimental observations for bulk CrI3), while it is AFM in the monoclinic structure. The strong interplay between stacking order and magnetic configuration suggests a possible scenario to solve the conundrum: if thin samples exfoliated at room temperature from bulk monoclinic crystals are not able to undergo a structural phase transition, they remain in the metastable monoclinic phase and are thus expected to display AFM ordering at low temperature.

Figure 1. Lateral and top views of the crystal structure of CrI3 in the monoclinic (high temperature) phase (a) and in the rhombohedral (low temperature) phase (b). Both the primitive (thin dashed line) and the conventional (thick solid line) unit cells are reported. (c) Typical Raman spectrum of bulk CrI3 at room temperature without resolving the polarization. The black arrows indicate the pairs of Ag and Bg vibrational modes sensitive to the structural phase transition. The blue dashed rectangle highlights the Raman active modes on which we focus our attention in the following.
Download figure:
Standard image High-resolution imageThis picture is in agreement with recent measurements on few-layer CrI3 where either an accidental puncture [14] or an external pressure [25, 26] provided the energy to undergo a structural transformation with a corresponding transition to FM ordering. Additional validations supporting the connection between crystal structure and magnetism have been achieved in a related material, CrBr3, by observing different magnetic ordering associated with novel stacking patterns (not corresponding to the bulk phases) in bilayers grown by molecular beam epitaxy [27]. The ultimate confirmation of the proposed scenario requires a technique sensitive to the stacking order of few layer structures in order to verify the absence of structural phase transitions in few layers. In this regard, second-harmonic generation is an effect which is sensitive to the different crystal symmetry in the two phases and that has been recently adopted [28] to show that bilayer CrI3 remains monoclinic down to very low temperature. Alternatively, another practical approach that has been successfully employed [29] in a similar material, CrCl3, relies on polarization resolved Raman spectroscopy.
In this work, we show the absence of structural phase transitions in thin CrI3 through polarization resolved Raman spectroscopy. Based on general symmetry arguments, we develop a strategy to distinguish the monoclinic and rhombohedral phases by looking at the angular dependence of the Raman response to linearly polarized light. We validate this approach for bulk crystals by evidencing the existence of a monoclinic phase at high temperature and a rhombohedral one at low temperature, in agreement with the general understanding. Raman measurements on encapsulated CrI3 multilayers on the contrary show that thin crystals remain in the monoclinic phase even when the sample is cooled down to base temperature. This has crucial implications on the magnetic ground state of atomically thin samples, which is very sensitive to the stacking order of the layers, and finally explains the controversial AFM ordering observed in experiments.
Methods
CrI3 crystals are grown by the chemical vapor transport method and, owing to the enormous sensitivity of this material to atmosphere, stored in a nitrogen-gas-filled glove box with sub-ppm concentration of O2 and H2O. The investigated bulk crystals are freshly cleaved, mounted on a He-flow cryostat (cryovac KONTI cryostat) in the glove box, and sealed in the vacuum chamber with optical access before being transferred to the optical setup. The nm-thick multilayers of CrI3 are obtained by mechanical exfoliation with scotch tape. The flakes are then picked up with standard dry transfer techniques and fully encapsulated in 10–30 nm thick exfoliated hBN. The samples are removed from the glovebox and placed into the cryostat for optical investigations.
All Raman spectroscopy measurements in this work are performed using a Horiba scientific (LabRAM HR Evolution) confocal microscope in backscattering geometry. The nominal laser power before the microscope objective and the window of the cryostat is 60  W and the excitation wavelength 532 nm. After laser excitation the dispersed light is sent to a Czerni–Turner spectrometer equipped with a 1800 groves mm−1 grating, which resolves the optical spectra with a precision of 0.3
  . The light is detected with the help of a N2-cooled CCD-array. The incident linear polarization of the laser is varied using a
  /2-plate while the analyzer, placed on the detecting light path, is kept fix.
First-principles simulations have been performed within density functional theory using the Quantum ESPRESSO suite of codes [30, 31]. In order to treat magnetism and van der Waals interactions on an equal footing we have adopted the spin-polarized extension [32] of the van der Waals density functional (vdw-DF) method [33, 34]. The unit cell is kept fixed to the experimentally reported structure [8] for both the rhombohedral and monoclinic phase, while atomic positions have been relaxed so that any component of the force on any atom does not exceed  eV
eV  . Phonon frequencies at vanishing wave vector have been then computed by finite differences using the phonopy software [35]. From the computed phonon displacement patterns, the Raman tensors have been calculated within the Placzec approximation as derivatives of the electronic contribution to the dielectric tensor with respect to the phonon amplitude, again using finite differences. In all calculations, we adopt pseudopotentials from the Standard Solid State Pseudopotential Library (SSSP) [36], with a cutoff of 60 Ry for wavefunctions and 480 Ry for the charge density. The Brillouin zone corresponding to the primitive unit cell is sampled using a regular Monkhorst–Pack grid centered at
  with
with  or
or  k-points in either the monoclinic or rhombohedral phase.
Results and discussion
Figure 1(c) shows a typical Raman spectrum of bulk CrI3 at room temperature, in agreement with previous literature [19]. The visible modes belong to either one of two possible irreducible representations, Ag or Bg, of the 2/m (or C2h) point group corresponding to the high-temperature phase. When the structure undergoes a transition to the rhombohedral phase, some pairs of Ag and Bg modes (highlighted in figure 1) become degenerate and transform according to the two-dimensional Eg irreducible representation of the low-temperature  (or C3i) point group. The presence of degenerate or split modes thus represents a potential signature to distinguish between the two structural phases and to track the phase transition. Still, the frequency separation between the split modes is typically very small [19] (few
  ) and thus expected to get harder to be visible in unpolarized Raman spectra when the thickness of the sample is narrowed down and the signal gets weaker.
Such difficulty can be overcome in polarization resolved Raman spectroscopy by exploiting the different Raman response of Ag, Bg, and Eg modes to polarized light. Indeed, as we shall see, the dependence on the polarization angle cancels out when the contribution from the two degenerate modes forming a Eg peak is summed over in the rhombohedral phase, resulting in a constant spectrum insensitive to the polarization configuration. On the contrary, in the monoclinic structure the Ag and Bg modes that result from the splitting of the degenerate Eg peak have opposite response, giving rise to two peaks with an intensity that oscillates out of phase with the polarization angle, so that the close Ag and Bg peaks are much easier to resolve [19, 29].
To provide a rigorous foundation of this procedure, we first recall that in non-resonant Stokes conditions, the Raman spectrum can be expressed as

where the line-shape has been simplified to a  -function,
  is the Raman shift,
  is the frequency of the
  th long-wavelength phonon mode,
  and
and  the polarization vectors of the incident and scattered light with frequency
  and
and  , and
, and ![$ \newcommand{\e}{{\rm e}} n_\nu = [\exp(\hbar\omega_\nu/(k_{\rm B} T))-1]^{-1}$](https://content.cld.iop.org/journals/2053-1583/7/1/015007/revision2/tdmab4c64ieqn021.gif) is the Bose–Einstein occupation of the
is the Bose–Einstein occupation of the  th mode. Based on symmetry arguments, the Raman tensors
 ![$ \newcommand{\dvec}[1]{{\mathop{#1}\limits^\leftrightarrow}{}} \newcommand{\re}{{\rm Re}} \renewcommand{\d}{\,\textmd{d}} \newcommand{\bo}{\boldsymbol} \dvec{\boldsymbol{R}}^{\nu}$](https://content.cld.iop.org/journals/2053-1583/7/1/015007/revision2/tdmab4c64ieqn023.gif) entering equation (1) have the following general expressions for modes belonging to the Ag or Bg representations of the high-temperature point group
entering equation (1) have the following general expressions for modes belonging to the Ag or Bg representations of the high-temperature point group

and

for pairs of degenerate modes belonging to the Eg representation of the low-temperature point group.
To identify a strategy to distinguish the two phases, we focus on the most common back-scattering geometry with linearly polarized light, whose polarization vectors can thus be written as  . To simplify the derivation we observe that, as the degenerate Eg modes split into a Ag and a Bg mode, we expect
  (and
(and  ), so that
  for all the modes considered here. As a consequence, we find

yielding an intensity in equation (1) that can be written in terms of the cumulative angle  . From the general expressions for the Raman tensors, we find that the Raman spectrum is completely independent of the polarization angles close to a degenerate Eg peak in the low-temperature phase,

while the intensity of the split Ag and Bg modes of the monoclinic structure oscillates out of phase as a function of the angle  :
:
This provides us with a strategy to distinguish the two structural phases by looking at the evolution of the Raman spectrum as the cumulative polarization angle  is varied, e.g. by keeping fixed
  while sweeping
  . In the rhombohedral phase we expect degenerate Eg peaks whose intensity and frequency position do not change with the polarization angle, while the monoclinic structure is characterized by pairs of close peaks associated with Ag and Bg modes whose intensity alternates out of phase as a function of
  , enhancing the visibility of the split modes even when the frequency separation is very small. In the following we focus on the spectral range around 100
  , where this strategy is particularly suitable owing to the presence [19] of two nearby Eg modes in the rhombohedral phase split into two pairs of
  modes in the monoclinic phase.
The procedure is exemplified in figure 2 in a model calculation, where the Raman intensities and vibrational frequencies have been computed for the rhombohedral and monoclinic structures from first principles (see Methods), although the position of the strongest  peaks of the monoclinic crystal (and for consistency also the corresponding Eg peak in the rhombohedral phase) have been shifted by 4
  to result in a better qualitative agreement with experiments. The angular dependence of the two spectra are clearly different, supporting the effectiveness of our strategy to distinguish the two structural phases. Indeed, as expected from the above discussion, for the rhombohedral structure, the Raman spectrum is insensitive to the polarization angle
  (here we assume
  ), while in the monoclinic phase we have a transfer of spectral intensity as a function of
  between two peaks of a split
  pair. In particular, this results into very different spectra in parallel configuration (
 , or
, or  in Porto notation), where only Ag modes are visible, or cross configuration (
 , or
, or  ), where only Bg modes are present, allowing to clearly resolve their frequency separation.
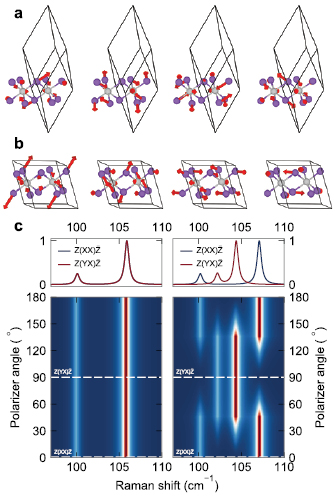
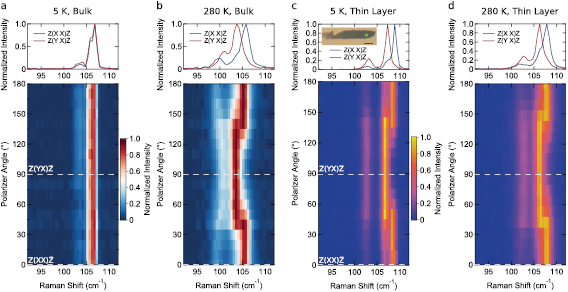
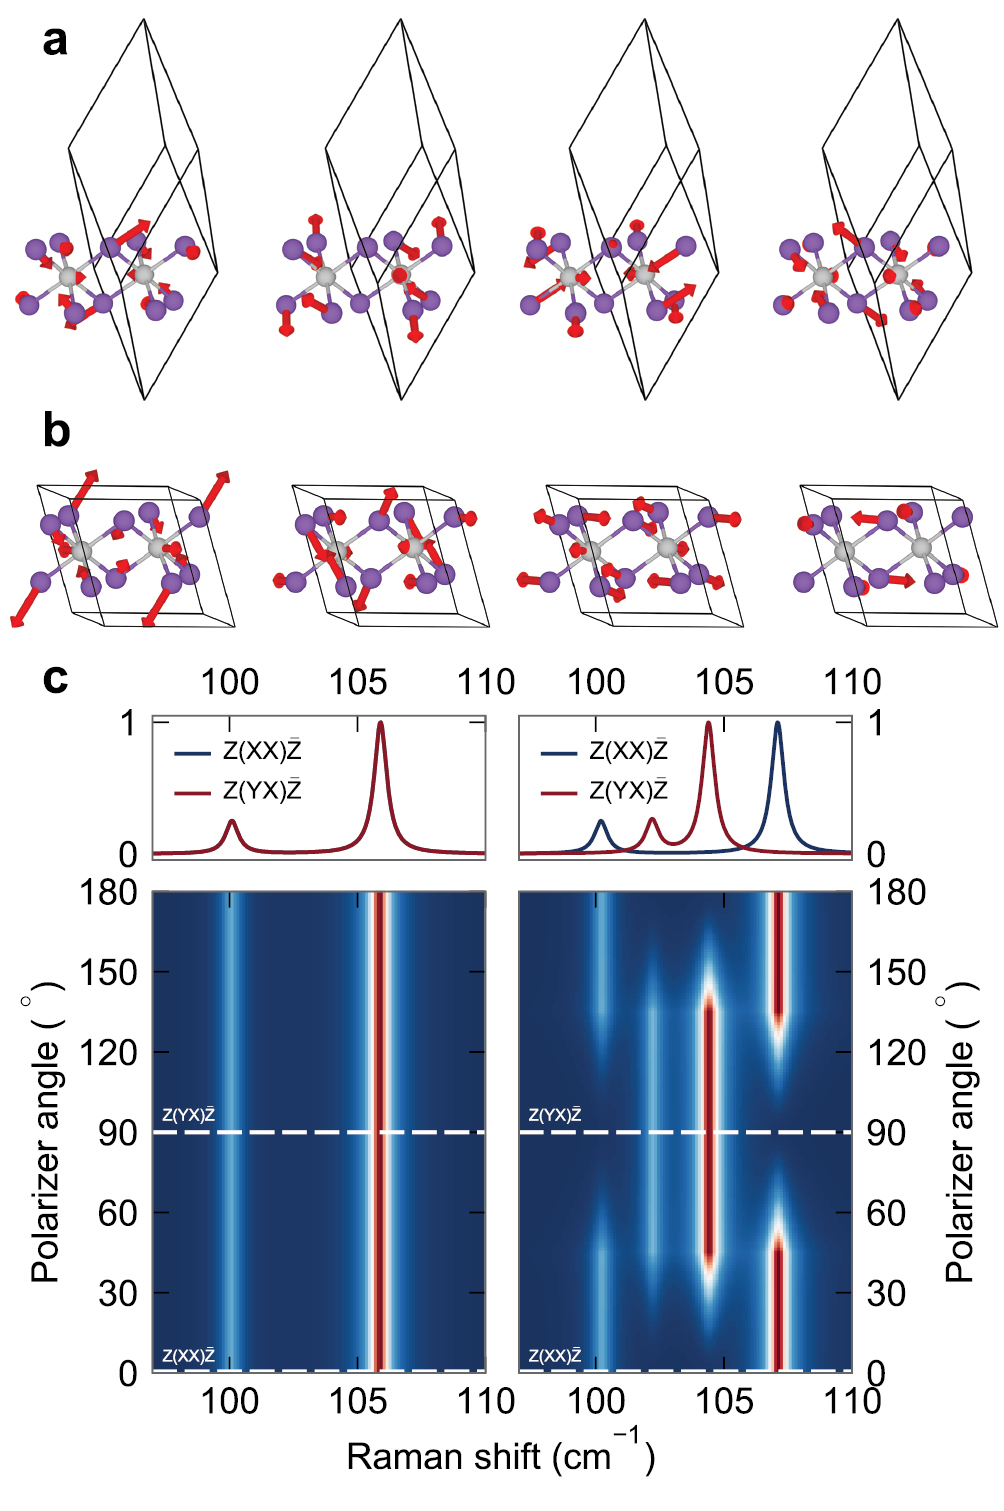
Figure 2. Phonon displacement pattern according to first-principles simulations of the modes visible in the Raman spectrum close to 100  either in the rhombohedral (a) or monoclinic (b) phase. The modes appear in order of increasing frequency. (c) Colour plot of the normalized Raman spectrum as a function of the polarization angle and Raman shift. Results for both the rhombohedral (left) and monoclinic (right) phase of bulk CrI3 are reported. Here we assume that the polarization angle of the incident light
  is varied, while keeping the detector for the scattered light fixed at
  . Intensities and vibrational frequencies are computed from first principles as detailed in the Methods, although the position of the brightest Ag and Bg modes of the monoclinic structure (as well as the corresponding Eg mode in the rhombohedral phase) have been displaced by 4
  to obtain a better qualitative agreement with experiments (see below). The upper insets show the Raman spectra in parallel (blue) or cross (red) polarization, corresponding to the horizontal dashed lines in the colour plots.
Download figure:
Standard image High-resolution imageWe first validate our approach by considering bulk samples, for which a structural phase transition is expected to occur at 200–220 K and should manifest itself in a change of the angular dependence of the Raman spectrum. Figure 3(a, b) shows the Raman response measured at two different temperatures, above and below the structural phase transition, as a function of the polarization angle  of the incident light, while the detecting polarizer is kept fixed (see Methods). At 5 K a weak and a strong peak are present at 103 and 107
  respectively, and their intensity does not evolve with
  , clearly showing that these are Eg modes of the rhombohedral structure.
Figure 3. Colour plots of the normalized intensity as a function of the Raman shift (in  ) in the investigated frequency region and of the angle of the incoming linearly polarized light. The white dashed lines indicate co- and cross-polarized configurations (
 and
and  , respectively). The top panels show individual line cuts for
  and
and  . Bulk CrI3 at T = 5 K (a) and T = 280 K (b) show excellent agreement with the theoretical predictions showing that the structural phase transition from monoclinic, at high temperatures, to rhombohedral, at low temperatures, takes place. The experimental data for a 4 nm thick crystal of CrI3 is shown in (c) and (d) for T = 5 K and T = 280 K, respectively. The area probed here and an optical micrograph of the flake is depicted in the inset of panel (c). The scale bar corresponds to 10
  . Except for a slight stiffening of the modes due to the decreased temperature we do not observe significant differences between the experimental data at low and high temperatures. In particular, the polarization pattern is virtually identical, indicating that no structural transition occurs so that the system remains in the monoclinic phase down to low temperature.
Download figure:
Standard image High-resolution image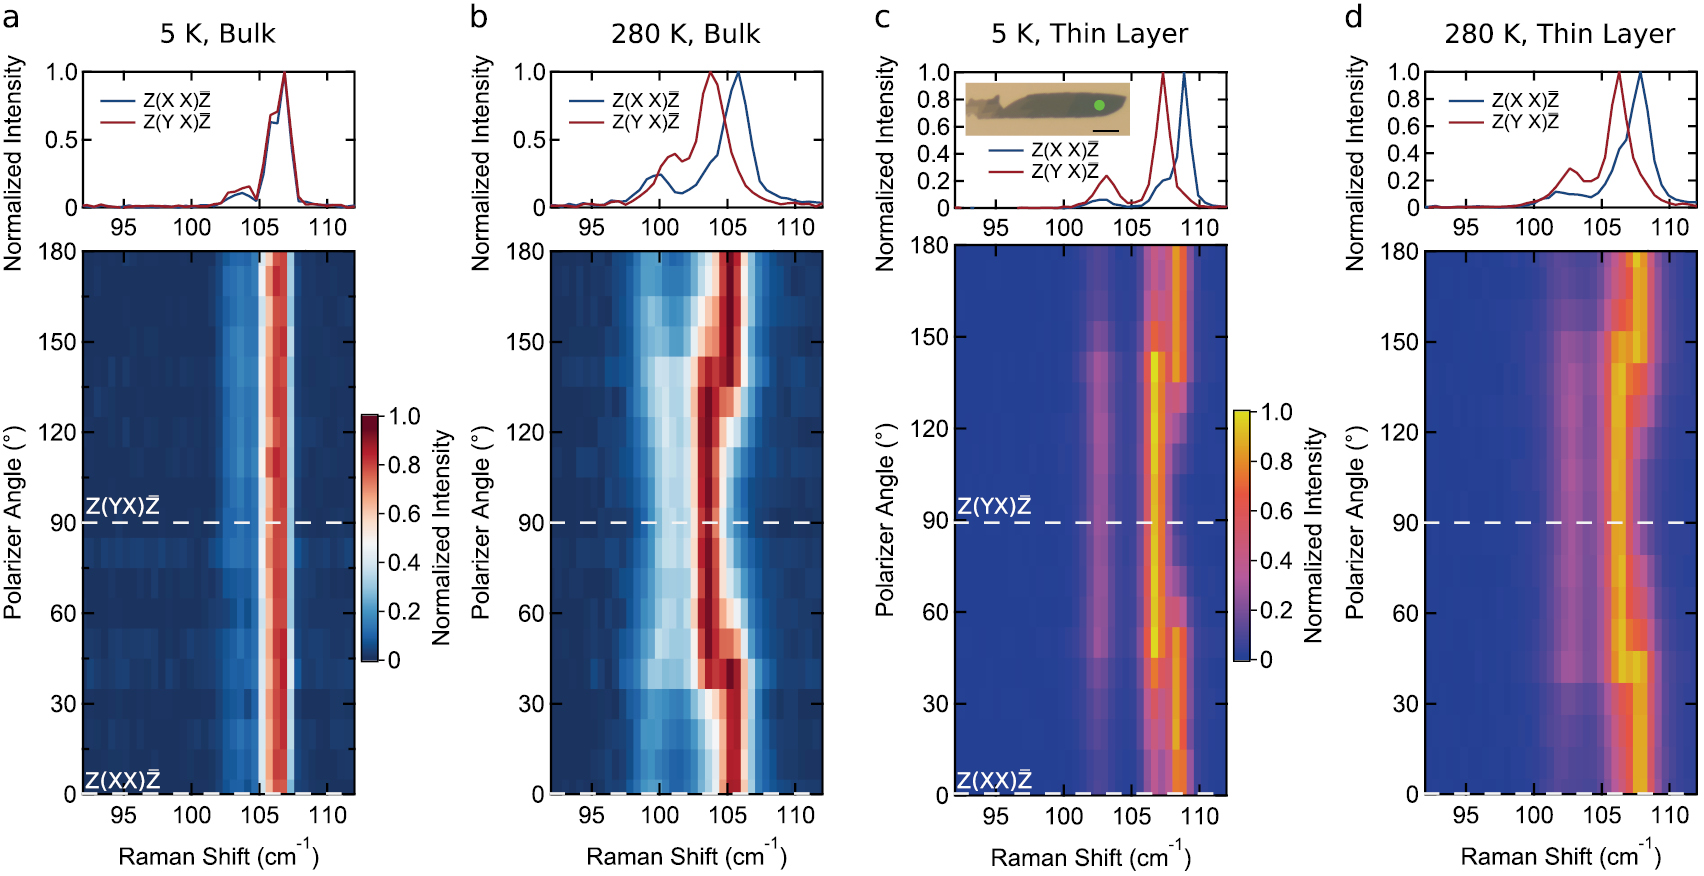
In particular, the relative intensity of the two modes is in very good agreement with the first-principles results in figure 2 and allows us to make a more definite assignment of the corresponding phonon patterns. At high temperature (280 K), each peak splits into two with intensities that oscillate out of phase as a function of  , so that for parallel and cross polarization (upper panel) only one of the two split modes is visible. This is exactly what is predicted for a monoclinic structure in figure 2 and we can thus unambiguously identify the peaks as pairs of
  modes, indicating that the structure is monoclinic at high temperature. Our approach thus confirms that bulk crystals undergo a structural transition from a monoclinic phase at high temperature to a rhombohedral phase at low temperature.
We are now in a position to consider thin samples obtained by mechanical exfoliation (see Methods). Figure 3(c, d) shows the Raman spectra obtained at 5 and 280 K for a 4 nm thick CrI3 crystal (see inset, approximately six layers) as a function of the polarization angle. For definiteness, we focus on the same spectral range considered for bulk samples. In this case, apart from a clear reduction of the peak width upon decreasing temperature, the two spectra are virtually identical. In particular, both at high and low temperature we find two pairs of close by peaks whose intensity varies with the polarization angle in phase opposition. Such transfer of spectral intensity as a function of  between nearby peaks is the clear signature of the monoclinic phase introduced before, ruling out the emergence of the rhombohedral phase.
As temperature plays a crucial role in the rhombohedral-monoclinic transition, sound conclusions on the presence or absence of structural changes require an independent cross check of the effective temperature of the sample for every experiment. Indeed, in a measurement of the Raman spectrum of insulators—which usually have low thermal conductivity—the laser can heat up the illuminated sample area. For instance the temperature can be lifted locally above a phase transition temperature, potentially leading to spectra that artificially look similar even at very different nominal temperatures [29]. Through the analysis of the intensity ratio between the Stokes and the anti-Stokes peaks in the entire spectral range [37] we ensure that the sample area which is probed remains below the temperatures of the phase transitions.
We can thus safely state that thin samples remain in the monoclinic structure down to very low temperature, even below the critical temperature Tc at which magnetism sets in. In this respect, the persistence of the monoclinic phase explains the observation [10–13] of layer antiferromagnetism in thin crystals, as opposed to the bulk FM order. Indeed, the monoclinic stacking order has been predicted to favour an AFM interlayer exchange coupling according to density-functional-theory simulations [12, 20–24]. The different magnetic state also results in a change in critical temperature, from 61 K in the bulk to 51 K [12] in thin crystals.
Remarkably, this reduced Tc matches exactly the temperature at which an anomaly is observed [8, 12] in the magnetization curves of bulk CrI3. This could indicate that also the outermost layers of bulk samples do not undergo a structural transition, in the same way as thin crystals. Indeed, by remaining in the monoclinic phase, such layers would display AFM order, giving rise to an anomaly at the onset of antiferromagnetism in monoclinic CrI3 (51 K instead of 61 K), which corresponds to the temperature of the anomaly observed in experiments.
The common behaviour of thin crystals and the outermost layers of bulk CrI3 would then suggest the importance of free surfaces in the suppression of the structural transition. Indeed, the absence of neighbouring layers at the surface could affect both the thermodynamics and the kinetics of the phase transition, e.g. by changing the vibrational free energy or the barrier height. Such effects could extend quite deeply inside the material or for relatively large thicknesses. Although this seems promising, further studies will be needed to clarify the precise nature and the spatial extension of the surface effects on the structural transition.
Conclusion
In conclusion, we have identified a strategy to distinguish between the two structural phases of CrI3 through polarization resolved Raman spectroscopy. We have validated our approach in the case of bulk crystals, confirming the existence of a structural transition from a monoclinic phase at high temperature to a rhombohedral phase at low temperature. When considering thin samples, our Raman spectroscopy analysis shows that the monoclinic structure persists down to very low temperature, clearly indicating the absence of any structural change when the thickness of the material is narrowed to few atomic layers. These results provide fundamental insight to confirm a plausible scenario that explains the full set of experimental data on CrI3, possibly including the presence of anomalies in the magnetization curves of bulk crystals.
Note. During the preparation of this manuscript we became aware that Raman results similar to the ones reported here have very recently appeared in [26].
Acknowledgments
We sincerely acknowledge Alexandre Ferreira for technical support. AFM gratefully acknowledges financial support from the Swiss National Science Foundation (Division II) and from the EU Graphene Flagship project. MG acknowledges support from the Swiss National Science Foundation through the Ambizione program. Simulation time was provided by CSCS on Piz Daint (project IDs s825 and s917). KW and TT acknowledge support from the Elemental Strategy Initiative conducted by the MEXT, Japan, A3 Foresight by JSPS and the CREST (JPMJCR15F3), JST. ZW acknowledges support from the National Natural Science Foundation of China (Grants No. 11904276).